

Kinesin Kif3b mutation reduces NMDAR subunit NR2A trafficking and causes schizophrenia-like phenotypes in mice
- PMID: 31746486
- PMCID: PMC6939202
- DOI: 10.15252/embj.2018101090
Kinesin Kif3b mutation reduces NMDAR subunit NR2A trafficking and causes schizophrenia-like phenotypes in mice
Abstract
The transport of N-methyl-d-aspartate receptors (NMDARs) is crucial for neuronal plasticity and synapse formation. Here, we show that KIF3B, a member of the kinesin superfamily proteins (KIFs), supports the transport of vesicles simultaneously containing NMDAR subunit 2A (NR2A) and the adenomatous polyposis coli (APC) complex. Kif3b+/- neurons exhibited a reduction in dendritic levels of both NR2A and NR2B due to the impaired transport of NR2A and increased degradation of NR2B. In Kif3b+/- hippocampal slices, electrophysiological NMDAR response was found decreased and synaptic plasticity was disrupted, which corresponded to a common feature of schizophrenia (SCZ). The histological features of Kif3b+/- mouse brain also mimicked SCZ features, and Kif3b+/- mice exhibited behavioral defects in prepulse inhibition (PPI), social interest, and cognitive flexibility. Indeed, a mutation of KIF3B was specifically identified in human SCZ patients, which was revealed to be functionally defective in a rescue experiment. Therefore, we propose that KIF3B transports NR2A/APC complex and that its dysfunction is responsible for SCZ pathogenesis.
Keywords: NMDAR; KIF3B; NR2A; neuronal plasticity; schizophrenia.
© 2019 The Authors.
Conflict of interest statement
The authors declare that they have no conflict of interest.
Figures
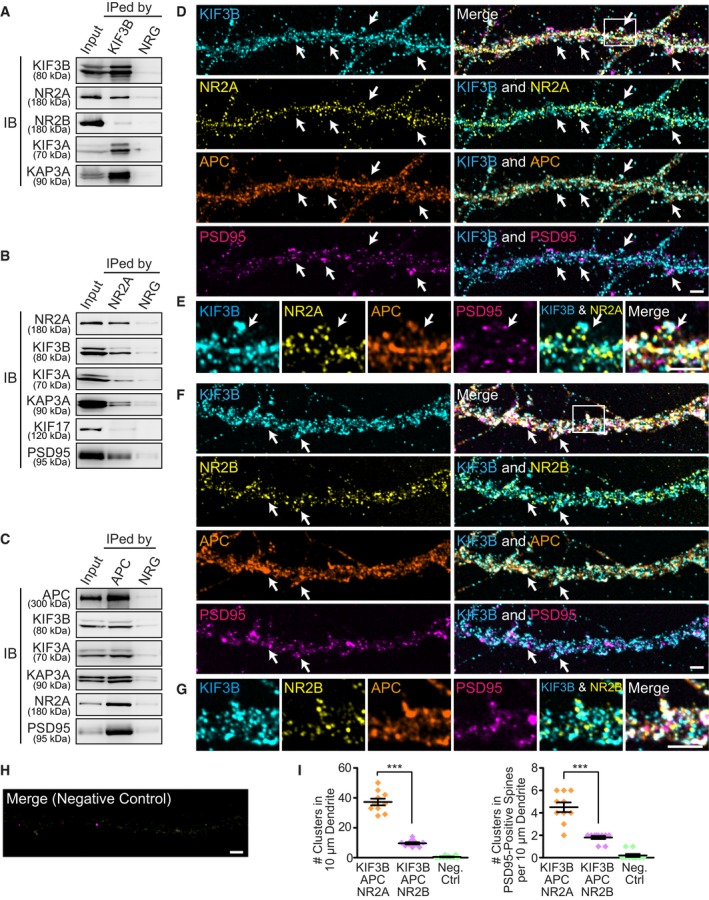
- A–C
Co‐immunoprecipitation (IP) of mouse whole brain extracts with an anti‐KIF3B antibody (A); and their vesicle co‐IP with an anti‐NR2A antibody (B) and an anti‐APC antibody (C); with normal rabbit IgG (NRG) as a control, immunoblotted (IB) against the indicated antibodies. n = 4. See Source data for Figure 1.
- D–I
Immunofluorescence microscopy showing the intracellular colocalization of KIF3B, APC, and NR2A (D and E) or NR2B (F and G) in PSD95‐positive spines of the dissociated hippocampal neurons with a negative control (H) and statistics (I). Arrows, positions of colocalization. Squares in (D) and (F), magnified regions in (E and G), respectively. Scale bars, 2 μm. Center and error bars show mean ± SEM. n = 10. ***P < 0.001; Student's t‐test.
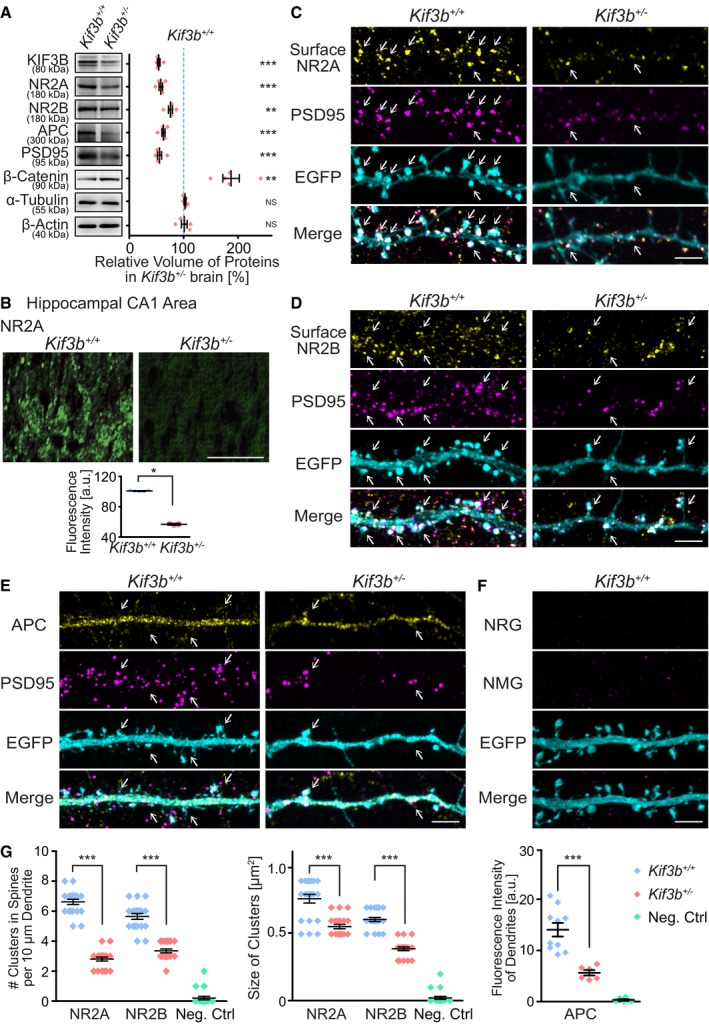
- A
Immunoblotting of adult mouse lysates of Kif3b +/+ and Kif3b +/− mice using the indicated antibodies with statistics. Protein volumes in Kif3b +/− brains were normalized with those in Kif3b +/+ brains and are expressed as the % of the control. Note that the expression levels of plasticity‐related proteins (NR2A, NR2B, and PSD95) and a KIF3‐associated protein (APC) were decreased, whereas that of β‐catenin was increased. Center and error bars show mean ± SEM. n = 5. NS, P ≥ 0.05; **P < 0.01; ***P < 0.001; one‐way ANOVA. See Source data for Figure 2.
- B
Immunofluorescence histochemistry of the hippocampal CA1 apical area of Kif3b +/+ and Kif3b +/− mouse brain coronal sections using an anti‐NR2A antibody and statistics for the fluorescence intensity. Scale bar, 50 μm. Center and error bars show mean ± SEM. n = 5. *P < 0.05; paired t‐test.
- C–G
Representative micrographs of distal dendrites of dissociated hippocampal neurons at DIV 16–18, immunostained against surface NR2A (C), surface NR2B (D), and cytoplasmic APC (E), accompanied by a negative control with normal rabbit and mouse IgGs (NRG and NMG, respectively in F), and statistics for the density and size of the surface NR2A‐ and NR2B‐positive clusters and the fluorescence intensity of APC (G). Neurons were permeabilized only in APC staining (E). Note that in Kif3b +/− neurons, the cluster size and density of both NR2A and NR2B, and the APC expression level were affected compared with Kif3b +/+ neurons. Arrows, signals at PSD95‐positive spines. Scale bars, 5 μm. Center and error bars show mean ± SEM. n = 20–21. ***P < 0.001; Student's t‐test. See Fig EV1.
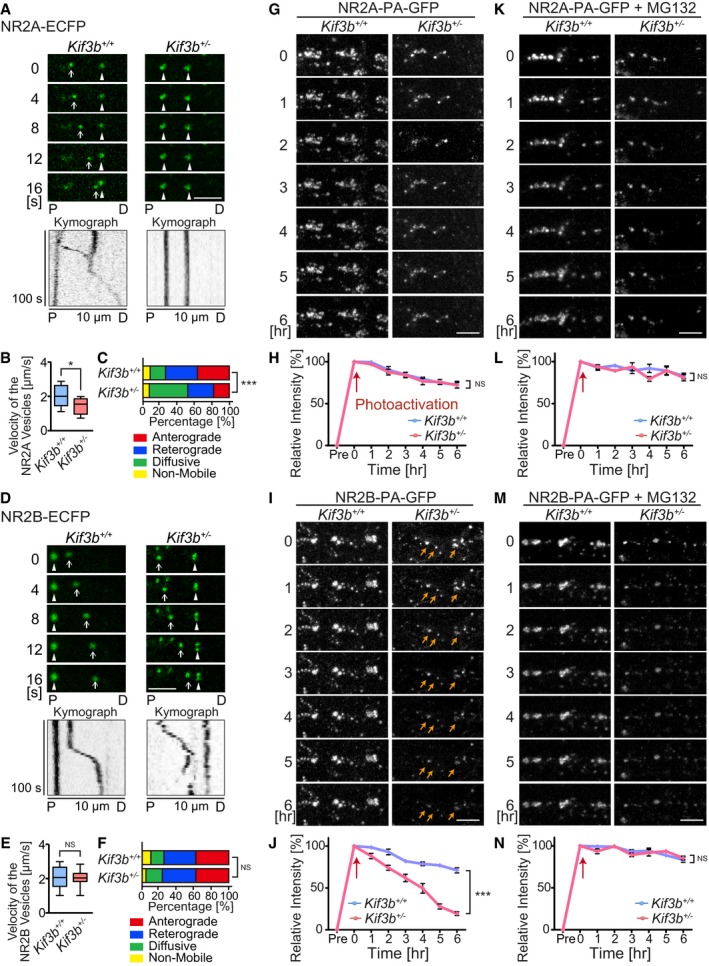
- A–F
Time‐lapse imaging of NR2A‐ECFP (A–C) and NR2B‐ECFP (D–F) along dendrites of dissociated hippocampal neurons, represented by the kymographs (A and D), and statistics for the velocity (B and E) and directionality of the vesicles (C and F). Note that the transport of NR2A vesicles, but not that of NR2B vesicles, was affected in Kif3b +/− neurons. Scale bars, 5 μm. P, proximal; D, distal region of the dendrite. Arrows, anterogradely moving vesicles; arrowheads, non‐mobile or diffusing vesicles. Boxplots in (B and E) represent median, first, and third quartiles, and whiskers represent minimum to maximum. n = 240–316 vesicles from 18 neurons. NS P ≥ 0.05; *P < 0.05; ***P < 0.001; Student's t‐test (B and E) and chi‐square test (C and F).
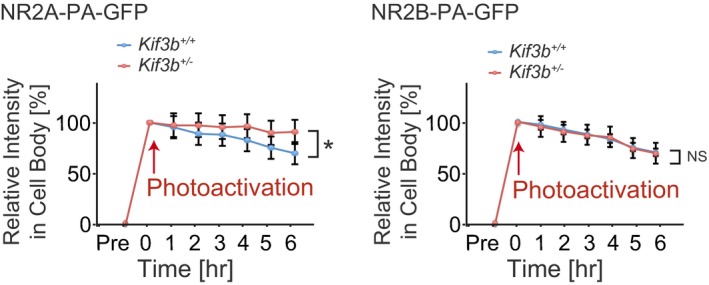
- G–N
Time‐lapse fluorescence images of NR2A (G and K)‐ or NR2B‐PA‐GFP‐expressing dissociated hippocampal neurons (I and M), in the absence (G and I) or in the presence of proteasome inhibitor, MG132 (K and M), and statistics showing the time course of degradation along dendrites at 1‐h intervals after photoactivation at time 0 (H, J, L, and N). Note that this proteasomal degradation of NR2B‐PA‐GFP, but not NR2A‐PA‐GFP, in Kif3b +/− dendrites, occurred in a significantly faster rate than in Kif3b +/+ dendrites. Orange arrows in micrographs, degrading clusters stimulated by photoactivation; red arrows in statistics, time point of photoactivation. Scale bars, 5 μm. Error bars show mean ± SEM. n = 10. ***P < 0.001; two‐way ANOVA. See Fig EV2.

- A–C
Fluorescence micrographs of EGFP‐expressing Kif3b +/+ and Kif3b +/− dendrites of dissociated hippocampal neurons at DIV 17 (A), accompanied by the statistics for the total and classified spine numbers per 40 μm dendrite (B) and morphological features including the number of spinules, head size, and neck size (C). Note that the number of stubby and filopodial spines was decreased and that of mushroom spines was increased in Kif3b +/− neurons. Scale bars, 10 μm. Center and error bars show mean ± SEM. n = 446–642 spines of 18 neurons from five mice. NS P ≥ 0.05; *P < 0.05; **P < 0.01, ***P < 0.001; Student's t‐test.
- D–G
Electrophysiological analysis of Schaffer collateral–CA1 synapses in acute hippocampal slices from Kif3b +/+ and Kif3b +/− mice. (D and E) Synaptic NMDA currents over AMPA currents recorded at +40 mV and −90 mV EPSCs, respectively with the representative traces (D) and current–voltage relationships of NMDAR channel currents recorded in Kif3b +/+ and Kif3b +/− slices (E). Current amplitudes were normalized to the values at +40 mV EPSC. Note that the synaptic NMDA currents were reduced in Kif3b +/− slices. Center and error bars show mean ± SEM. n = 12 cells from six mice. NS P ≥ 0.05; ***P < 0.001; Student's t‐test (D) and two‐way ANOVA (E). (F and G) Synaptic plasticity indicated by time course of the fEPSP slopes, with induction of LTP by high‐frequency stimulation (F) and of LTD by low‐frequency stimulation (G). Error bars show mean ± SEM. n = 9 slices from nine mice. ***P < 0.001; two‐way ANOVA.
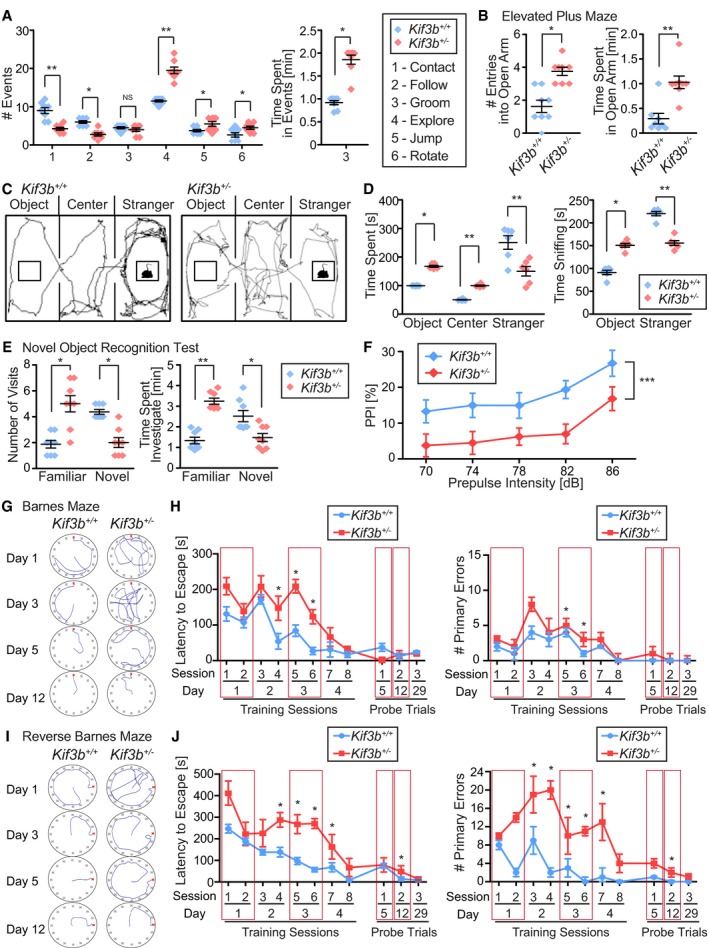
- A
Social interaction test using two unfamiliar adult male mice. The numbers of indicated events (#1–6) in a 10‐min trial were manually counted. Note that Kif3b +/− mice exhibited impaired social interest. Center and error bars show mean ± SEM. n = 8. NS P ≥ 0.05; *P < 0.05; **P < 0.01; Student's t‐test.
- B
Elevated plus‐maze test. Note that Kif3b +/− mice exhibited decreased anxiety and elevated activity. Center and error bars show mean ± SEM. n = 8. *P < 0.05; **P < 0.01; Student's t‐test.
- C, D
Three‐chambered sociability test with an object, center, and a stranger mouse in the same object areas (C), accompanied by statistics (D). Note that Kif3b +/− mice spent less time in the stranger area. Black lines in area (C), representative traces of mouse movement in 10 min of the trial. Center and error bars show mean ± SEM. n = 6. *P < 0.05; **P < 0.01; Student's t‐test.
- E
Novel object recognition test. Note that Kif3b +/− mice exhibited less interest to the novel object compared with the Kif3b +/− mice. Center and error bars show mean ± SEM. n = 8. *P < 0.05; **P < 0.01; Student's t‐test.
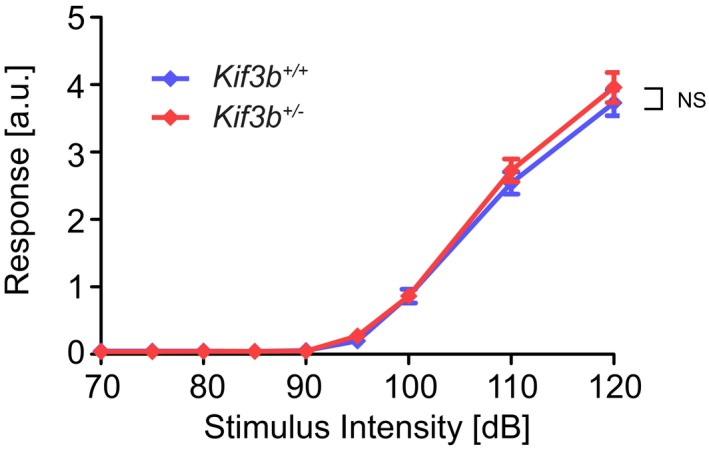
- F
Prepulse inhibition (PPI) test. Note that Kif3b +/− mice exhibited decreased inhibition in the startle response. Pulse intensity was set to 115 dB. n = 28. ***P < 0.001; two‐way ANOVA. See Fig EV3.
- G–J
Barnes maze test showing spatial reference memory (G and H) and reverse Barnes maze test showing learning flexibility (I and J) of both genotypes, with representative traces of the mouse movements (G and I) and statistics for latency to escape and number of primary errors during the training sessions and probe trials (H and J). Note that Kif3b +/− mice required a longer period of time to acquire spatial memory but showed a similar ability to sustain memory compared with Kif3b +/+ mice. Red boxes in H and J, corresponding to the trial traces presented in (G) and (I). Error bars show mean ± SEM. n = 6. *P < 0.05; Student's t‐test.
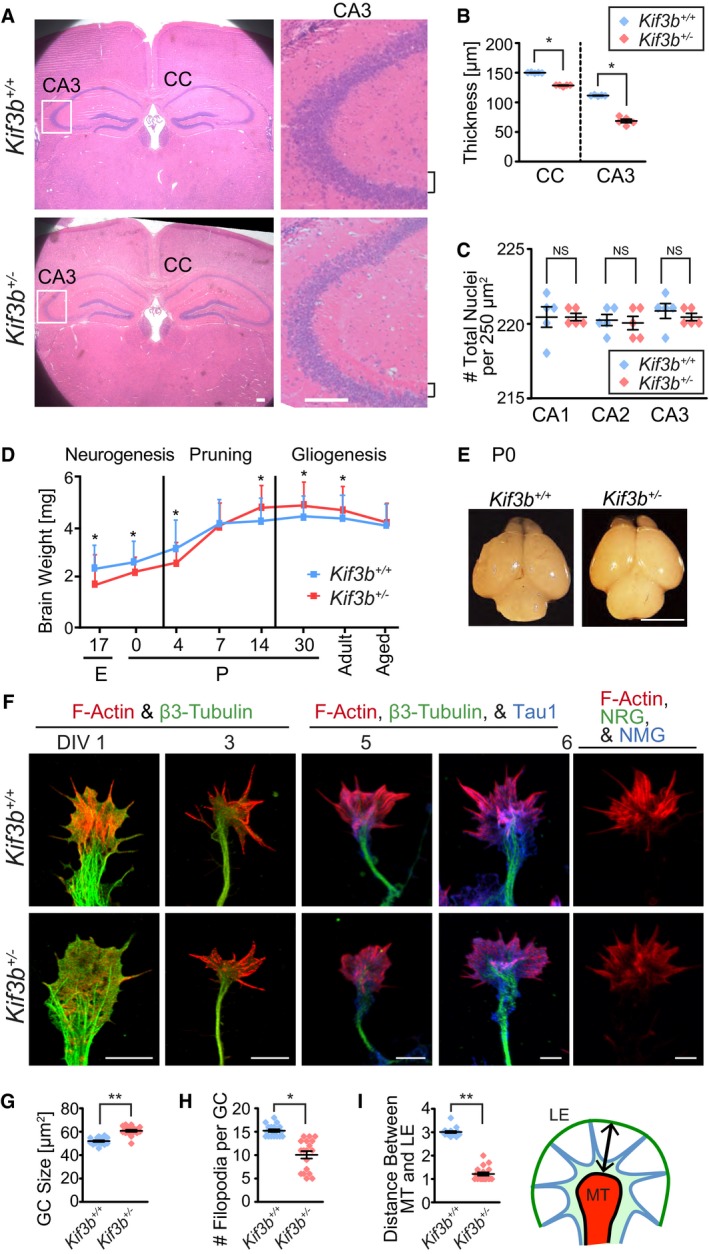
- A–C
Hematoxylin–eosin (HE) staining of adult mouse brain coronal sections and magnified images of hippocampal CA3 area of the indicated genotypes (A), accompanied by statistics (B and C). Squares in the left panels, magnified regions in the right panels; CC, corpus callosum; brackets, stratum radiatum in hippocampal CA3 area. Scale bars, 100 μm. Center and error bars show mean ± SEM. n = 5. NS P ≥ 0.05; *P < 0.05; Student's t‐test.
- D, E
Developmental profile of mouse brain weight throughout the neurogenesis, pruning, and gliogenesis phases, from embryonic day 17 (E17) to aged (D), and representative appearance of the brains at postnatal day 0 (P0; E). Scale bar, 5 mm. Error bars show mean ± SEM. n = 5. *P < 0.05; Student's t‐test.
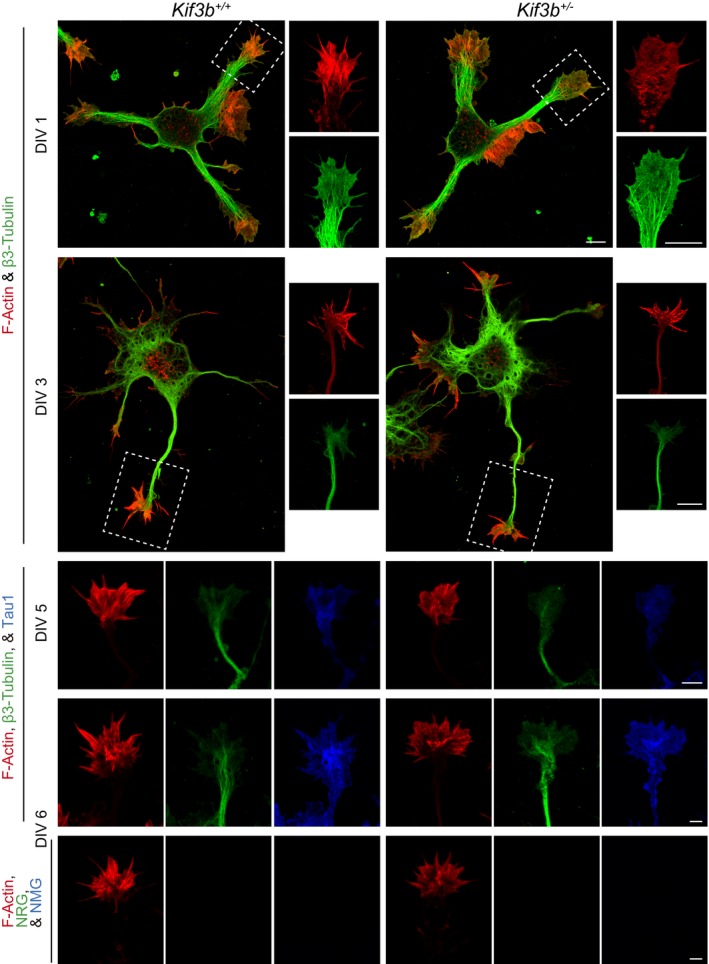
- F–I
Immunofluorescence merged micrographs stained against F‐actin (red) and β3‐tubulin (green), focusing on the morphology and development of the axonal growth cone (GC) from DIV 1, 3, 5, and 6 of the dissociated hippocampal neurons (F), accompanied by statistics (G–I). Arrow in (I), measured distance between MT domain and LE. MT, microtubule; LE, leading edge; NRG, normal rabbit IgG; NMG, normal mouse IgG. Scale bars, 5 μm. Center and error bars show mean ± SEM. n = 18. *P < 0.05; **P < 0.01; Student's t‐test. See Fig EV4 for the individual color images.
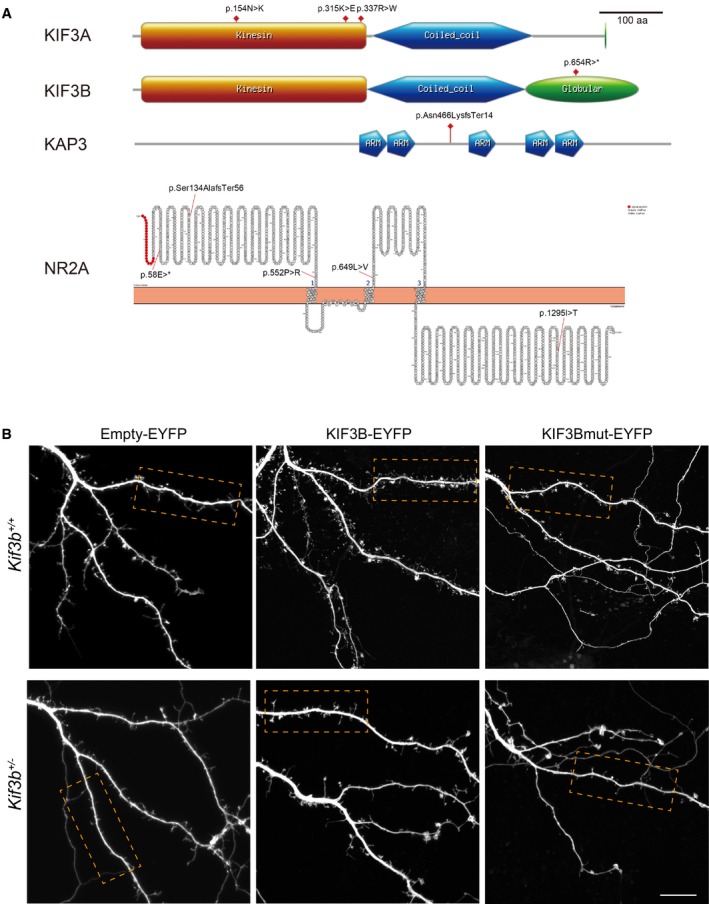
Schematic view of SCZ‐specific mutations in the human exome sequence database. Drawn by PROSITE (
https://prosite.expasy.org/ ) and Protter (http://wlab.ethz.ch/protter/start/ ).Fluorescence micrographs of indicated EYFP vector‐expressing Kif3b +/+ and Kif3b +/− dendrites of dissociated hippocampal neurons at DIV 16–18. Dotted square, magnified dendrites in Fig 7A. Scale bars, 10 μm. n = 5–15. See Fig 7A and B.
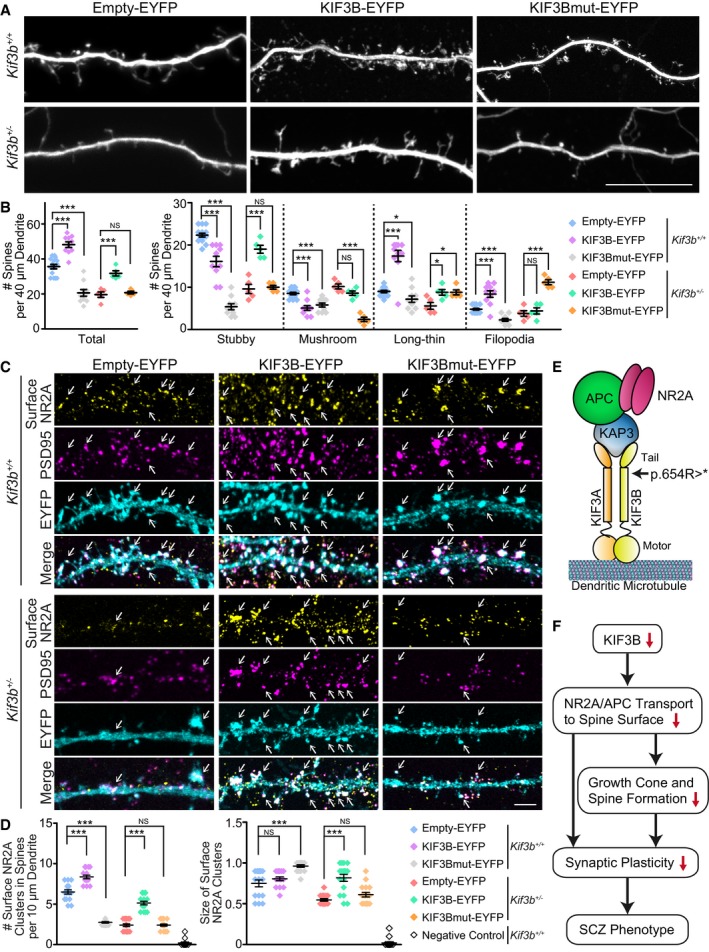
- A, B
Fluorescence micrographs of Empty‐EYFP, KIF3B‐EYFP, or KIF3Bmut‐EYFP vector‐expressing Kif3b +/+ and Kif3b +/− dendrites in dissociated hippocampal neurons at DIV 16–18 (A), accompanied by statistics for the total and classified spine number per 40 μm dendrite (B). Scale bars, 10 μm. Center and error bars show mean ± SEM. n = 98–535 spines of 5–15 neurons from three mice. NS P ≥ 0.05; *P < 0.05; ***P < 0.001; Student's t‐test. See Fig EV5.
- C, D
Immunofluorescence micrographs showing surface NR2A along Kif3b +/+ and Kif3b +/− dendrites of the dissociated hippocampal neurons at DIV 16–18, transfected with Empty‐EYFP, KIF3B‐EYFP, or KIF3Bmut‐EYFP vector. Arrows, signals at PSD95‐positive spines. Scale bar, 5 μm. Center and error bars show mean ± SEM. n = 16–17. NS P ≥ 0.05; ***P < 0.001; Student's t‐test. See Fig EV1.
- E, F
Schematic view of the SCZ‐related human KIF3B mutation in KIF3/KAP3/APC/NR2A complex (E) and the working hypothesis of SCZ pathogenesis related with KIF3B dysfunction (F). See Fig EV5 and Table EV1.
References
-
- Akashi K, Kakizaki T, Kamiya H, Fukaya M, Yamasaki M, Abe M, Natsume R, Watanabe M, Sakimura K (2009) NMDA receptor GluN2B (GluR epsilon 2/NR2B) subunit is crucial for channel function, postsynaptic macromolecular organization, and actin cytoskeleton at hippocampal CA3 synapses. J Neurosci 29: 10869–10882 - PMC - PubMed
-
- Asaka Y, Jugloff DG, Zhang L, Eubanks JH, Fitzsimonds RM (2006) Hippocampal synaptic plasticity is impaired in the Mecp2‐null mouse model of Rett syndrome. Neurobiol Dis 21: 217–227 - PubMed
-
- Bannerman DM, Sprengel R, Sanderson DJ, McHugh SB, Rawlins JN, Monyer H, Seeburg PH (2014) Hippocampal synaptic plasticity, spatial memory and anxiety. Nat Rev Neurosci 15: 181–192 - PubMed
Publication types
MeSH terms
Substances
Grants and funding
- JP23000013/MEXT | Japan Society for the Promotion of Science (JSPS)/International
- JP16H06372/MEXT | Japan Society for the Promotion of Science (JSPS)/International
- JP18dm0207047/Japan Agency for Medical Research and Development (AMED)/International
- JP18dm0107084h0002/Japan Agency for Medical Research and Development (AMED)/International
- Princess Al-Jawhara Center of Excellence in Research of Hereditary Disorders (PACER.HD)/International
LinkOut - more resources
Full Text Sources
Other Literature Sources
Medical
Molecular Biology Databases
