

Predicting in situ nanoparticle behavior using multiple particle tracking and artificial neural networks
- PMID: 31746912
- PMCID: PMC7202937
- DOI: 10.1039/c9nr06327g
Predicting in situ nanoparticle behavior using multiple particle tracking and artificial neural networks
Abstract
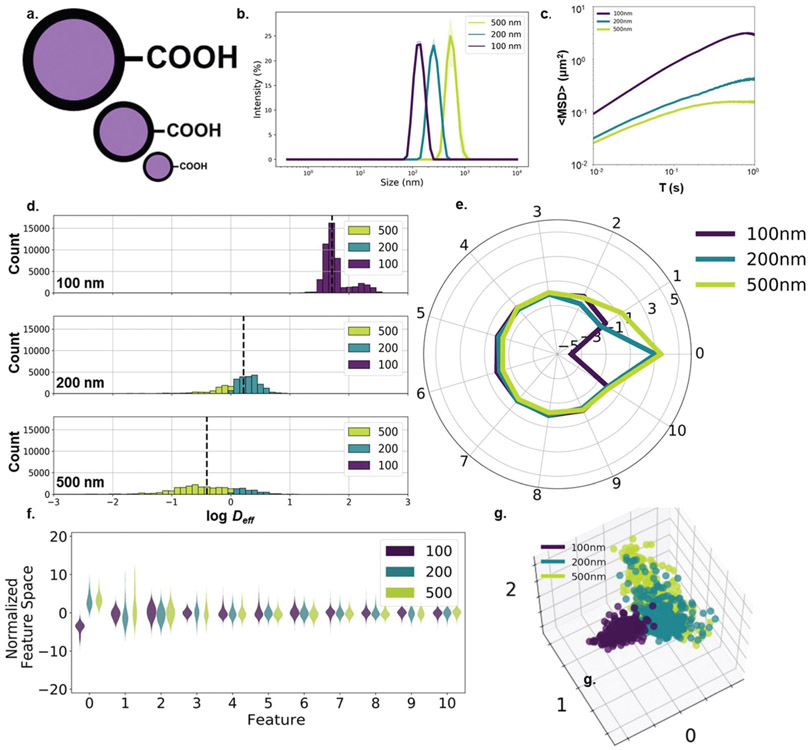
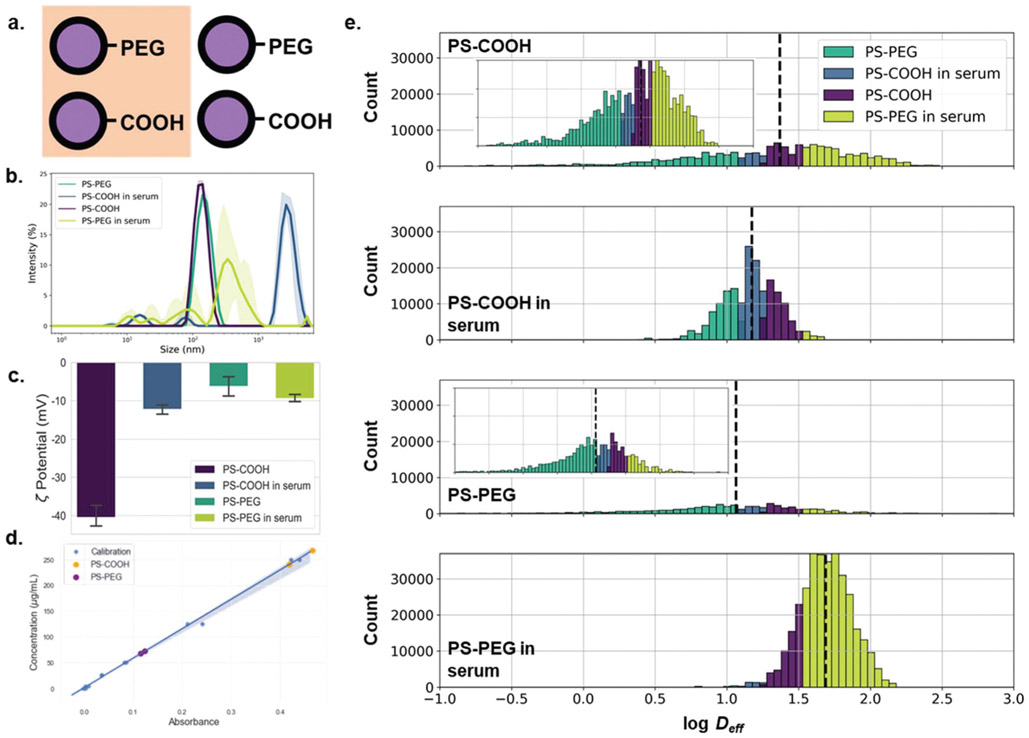
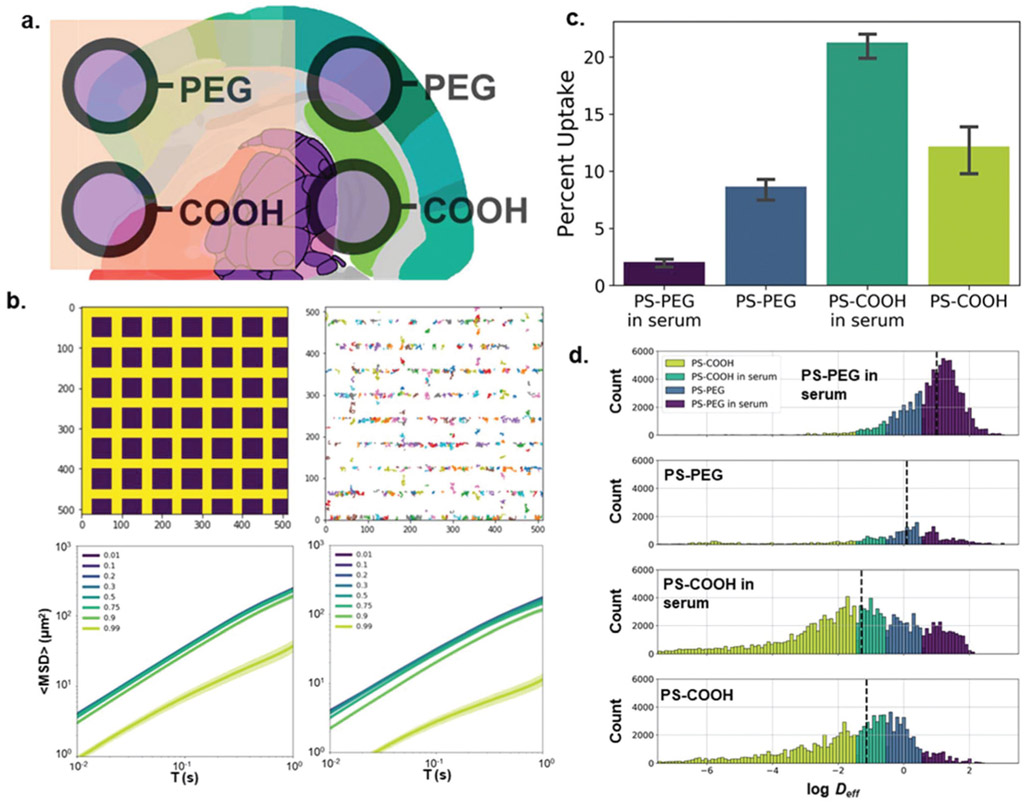
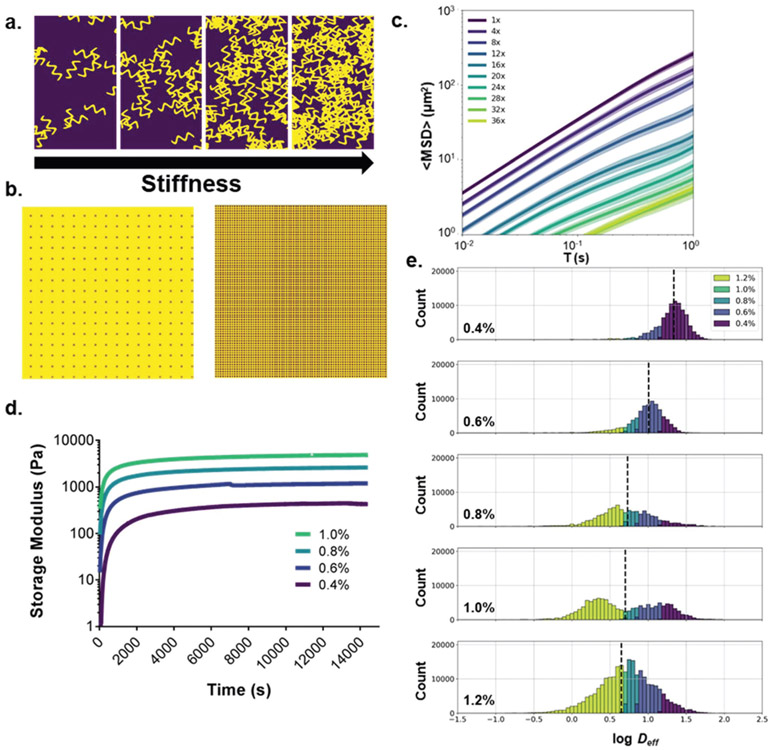
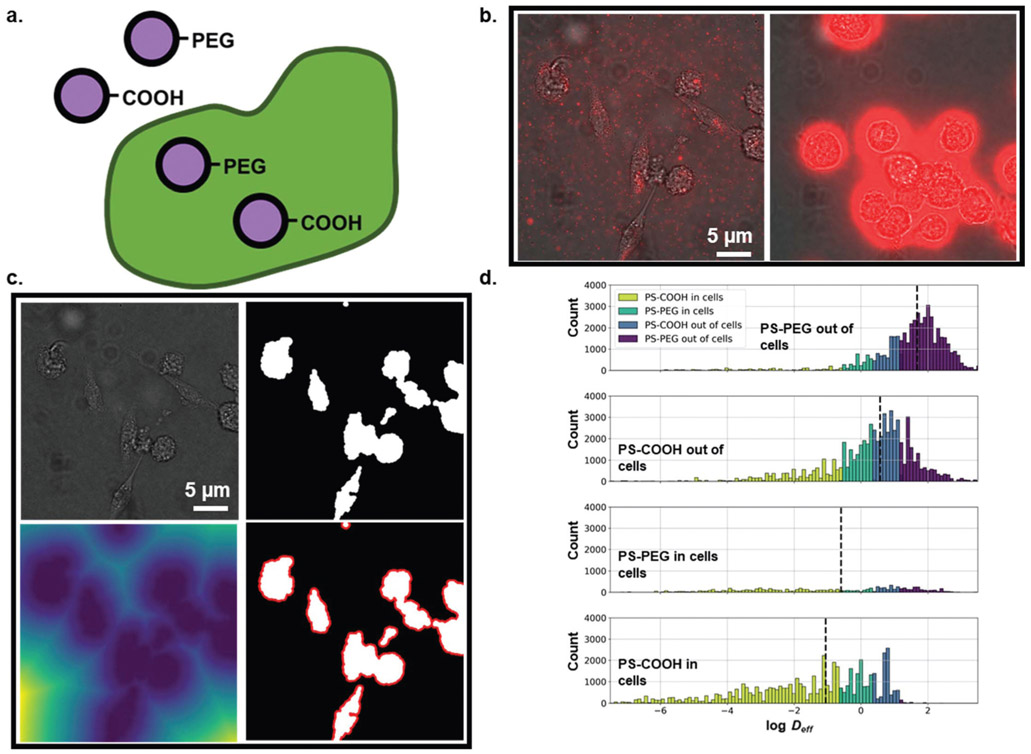
Predictive models of nanoparticle transport can drive design of nanotherapeutic platforms to overcome biological barriers and achieve localized delivery. In this paper, we demonstrate the ability of artificial neural networks to predict both nanoparticle properties, such as size and protein adsorption, and aspects of the brain microenvironment, such as cell internalization, viscosity, and brain region by using large (>100 000) trajectory datasets collected via multiple particle tracking in in vitro gel models of the brain and cultured organotypic brain slices. Our neural network achieved a 0.75 recall score when predicting gel viscosity based on trajectory datasets, compared to 0.49 using an obstruction scaling model. When predicting in situ nanoparticle size based on trajectory datasets, neural networks achieved a 0.90 recall score compared to 0.83 using an optimized Stokes-Einstein predictor. To distinguish between nanoparticles of different sizes in more complex nanoparticle mixtures, our neural network achieved up to a recall score of 0.85. Even in cases of more nuanced output variables where mathematical models are not available, such as protein adhesion, neural networks retained the ability to distinguish between particle populations (recall score of 0.89). These findings demonstrate how trajectory datasets in combination with machine learning techniques can be used to characterize the particle-microenvironment interaction space.
Conflict of interest statement
Conflicts of interest
There are no conflicts to declare.
Figures
Similar articles
-
Organotypic whole hemisphere brain slice models to study the effects of donor age and oxygen-glucose-deprivation on the extracellular properties of cortical and striatal tissue.J Biol Eng. 2022 Jun 13;16(1):14. doi: 10.1186/s13036-022-00293-w. J Biol Eng. 2022. PMID: 35698088 Free PMC article.
-
Artificial neural network based particle size prediction of polymeric nanoparticles.Eur J Pharm Biopharm. 2017 Oct;119:333-342. doi: 10.1016/j.ejpb.2017.06.030. Epub 2017 Jul 8. Eur J Pharm Biopharm. 2017. PMID: 28694160
-
Multiple Particle Tracking Detects Changes in Brain Extracellular Matrix and Predicts Neurodevelopmental Age.ACS Nano. 2021 May 25;15(5):8559-8573. doi: 10.1021/acsnano.1c00394. Epub 2021 May 10. ACS Nano. 2021. PMID: 33969999 Free PMC article.
-
Technological strategies to estimate and control diffusive passage times through the mucus barrier in mucosal drug delivery.Adv Drug Deliv Rev. 2018 Jan 15;124:64-81. doi: 10.1016/j.addr.2017.12.002. Epub 2017 Dec 12. Adv Drug Deliv Rev. 2018. PMID: 29246855 Free PMC article. Review.
-
Machine learning and deep learning methods that use omics data for metastasis prediction.Comput Struct Biotechnol J. 2021 Sep 4;19:5008-5018. doi: 10.1016/j.csbj.2021.09.001. eCollection 2021. Comput Struct Biotechnol J. 2021. PMID: 34589181 Free PMC article. Review.
Cited by
-
High-fidelity predictions of diffusion in the brain microenvironment.Biophys J. 2024 Nov 19;123(22):3935-3950. doi: 10.1016/j.bpj.2024.10.005. Epub 2024 Oct 10. Biophys J. 2024. PMID: 39390745
-
Organotypic whole hemisphere brain slice models to study the effects of donor age and oxygen-glucose-deprivation on the extracellular properties of cortical and striatal tissue.J Biol Eng. 2022 Jun 13;16(1):14. doi: 10.1186/s13036-022-00293-w. J Biol Eng. 2022. PMID: 35698088 Free PMC article.
-
Merging data curation and machine learning to improve nanomedicines.Adv Drug Deliv Rev. 2022 Apr;183:114172. doi: 10.1016/j.addr.2022.114172. Epub 2022 Feb 18. Adv Drug Deliv Rev. 2022. PMID: 35189266 Free PMC article. Review.
-
Passive and Active Microrheology for Biomedical Systems.Front Bioeng Biotechnol. 2022 Jul 5;10:916354. doi: 10.3389/fbioe.2022.916354. eCollection 2022. Front Bioeng Biotechnol. 2022. PMID: 35866030 Free PMC article. Review.
-
Engineering the pH-Sensitivity of the Graphene and Carbon Nanotube Based Nanomedicines in Smart Cancer Therapy by Grafting Trimetyl Chitosan.Pharm Res. 2020 Aug 3;37(8):160. doi: 10.1007/s11095-020-02881-1. Pharm Res. 2020. PMID: 32747991 Free PMC article.
References
Grants and funding
LinkOut - more resources
Full Text Sources