. 2020 Apr 17;21(8):1206-1216.
doi: 10.1002/cbic.201900612. Epub 2020 Jan 28.

The Multifaceted Inhibitory Effects of an Alkylquinolone on the Diatom Phaeodactylum tricornutum

Affiliations

The Multifaceted Inhibitory Effects of an Alkylquinolone on the Diatom Phaeodactylum tricornutum

Lachlan Dow et al. Chembiochem. .

Abstract

The mechanisms underlying interactions between diatoms and bacteria are crucial to understand diatom behaviour and proliferation, and can result in far-reaching ecological consequences. Recently, 2-alkyl-4-quinolones have been isolated from marine bacteria, both of which (the bacterium and isolated chemical) inhibited growth of microalgae, suggesting these compounds could mediate diatom-bacteria interactions. The effects of several quinolones on three diatom species have been investigated. The growth of all three was inhibited, with half-maximal inhibitory concentrations reaching the sub-micromolar range. By using multiple techniques, dual inhibition mechanisms were uncovered for 2-heptyl-4-quinolone (HHQ) in Phaeodactylum tricornutum. Firstly, photosynthetic electron transport was obstructed, primarily through inhibition of the cytochrome b6 f complex. Secondly, respiration was inhibited, leading to repression of ATP supply to plastids from mitochondria through organelle energy coupling. These data clearly show how HHQ could modulate diatom proliferation in marine environments.

Keywords: cytochromes; diatom-bacteria interactions; photosynthesis; quinolones; reaction mechanisms.


Conflict of interest statement

The authors declare no conflict of interest.

Figures

Figure 1
Figure 1
Structures of 2‐alkyl‐4‐quinolones discussed herein.
Figure 2
Figure 2
Growth curves of C. closterium (A–C), A. minutissimum (D–F) and P. tricornutum (G–I) exposed to a range of concentrations of HHQ (1st column), PQS (2nd column) and HQNO (3rd column) over 6 days, with day 0 depicting the day compounds were added to the culture. Tested concentrations varied between diatoms and compounds. Growth was followed by measuring chlorophyll fluorescence, defined as arbitrary relative fluorescence units (RFUs). Each data point represents the mean of three replicates with error bars showing the standard deviation. IC50 values are shown at the top of each graph.
Figure 3
Figure 3
Simultaneously measured fast fluorescence kinetics of PSII (black) and absorbance of P700 (grey, indicative of P700 redox state) of P. tricornutum. Cells were treated with DMSO (control), 40 μm 3‐(3,4‐dichlorophenyl)‐1,1‐dimethylurea (DCMU; positive control) or 5 μm HHQ. The activities of PSI and PSII were measured through Dual‐PAM during a multi‐turnover pulse (800 ms) with dark‐adapted cells (dark, left column) and the same cells adapted to low actinic light (light, right column, 70 μmol photons m−2 s−1). Data from one representative sample of each treatment are shown. Data are plotted on a logarithmic x axis, with dotted lines indicating crucial time points of the fast fluorescence curve at 2, 30 and 200 ms. Graphs of the same treatments share the same y‐axis range, with the left y axis indicating PSII fluorescence and the right y axis indicating P700 absorbance.
Figure 4
Figure 4
Light dependency of the quantum yields of A) PSII (Y(II)) and B) PSI (Y(I)), as well as C) PSI donor site limitation and D) PSI acceptor site limitation under steady‐state illumination in P. tricornutum (I=light irradiance). ▪: control samples (DMSO); : HHQ treated (50 μm). Error bars represent standard deviation (n=3).
Figure 5
Figure 5
Fast fluorescence transients of P. tricornutum after treatment with DMSO (negative control, black), 0.9 μm DCMU (positive control, blue) and 5 μm HHQ (red). The J and I steps of the curve at 2 and 30 ms are indicated with a dotted line. Data are plotted on a logarithmic x axis.
Figure 6
Figure 6
A) Linear ECS, B) c‐type cytochrome oxidation states and C) quadratic ECS calculated from absorption changes at λ=520, 554 and 564 nm (see the Experimental Section), following a saturating laser flash, given at t=0. ▪: control samples (DMSO); : HHQ treated (50 μm). Error bars represent standard deviation (n=5).
Figure 7
Figure 7
A)–C) Kinetics of linear (blue) and quadratic (red) ECS changes and c‐type cytochrome redox state (black) obtained after deconvolution from the kinetics of absorption changes (ΔI/I) at λ=520, 554 and 566 nm, during a 10 ms pulse of saturating red light (before time 0, 4500 μmol photons m−2 s−1) and the subsequent dark relaxation (after time 0; see the Experimental Section). A) DMSO control, B) treatment with HHQ (50 μm) and C) treatment with membrane potential uncoupler CCCP (15 μm). D) Relationship between quadratic (y axis) and linear ECS (x axis) in the control (□) and in cells treated with uncoupler (15 μm CCCP, ), and with HHQ (50 μm, ). Data in (D) are obtained from those in (A)–(C). Black squares: control samples (DMSO); red circles: HHQ treated (50 μm). Error bars represent standard deviation (n=5).
Figure 8
Figure 8
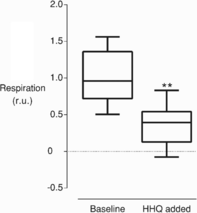
HHQ inhibits respiration in P. tricornutum. Oxygen concentration of a diatom culture was tracked over time in a Clark electrode in the dark, and the rate of oxygen consumption was derived from oxygen concentrations 1 min before and after the addition of 50 μm HHQ. Data were normalised to the average untreated respiration rate (r.u.=relative units). Box plots display the median (bar) and 95 % confidence interval. Whiskers indicate maximum and minimum. Asterisks indicate the outcome of the paired t‐test (P<0.005, n=8).
Figure 9
Figure 9
Schematic overview of the electron‐transport chain in chloroplasts and ATPase activity in mitochondria, and their respective functions in dark‐ (A, C) and light‐adapted (B, D) cells. The proposed blockage sites of HHQ are indicated in red (in C and D). Orange circles: plastoquinone; purple circles: cytochrome c 6; Cyt b6f: cytochrome b 6 f complex. Green arrows indicate electron transport and dotted arrows highlight transport of either protons or ATP. The repression of ATP/ADP transformations is indicated with grey arrows. Made in ©BioRender (https://biorender.com).

References

    1. Nelson D. M., Tréguer P., Brzezinski M. A., Leynaert A., Quéguiner B., Global Biogeochem. Cycles 1995, 9, 359–372.
    1. None
    1. Amin S. A., Parker M. S., Armbrust E. V., Microbiol. Mol. Biol. Rev. 2012, 76, 667–684; - PMC - PubMed
    1. Grossart H. P., Levold F., Allgaier M., Simon M., Brinkhoff T., Environ. Microbiol. 2005, 7, 860–873. - PubMed
    1. Dubern J.-F., Diggle S. P., Mol. BioSyst. 2008, 4, 882–888. - PubMed

Publication types

MeSH terms

LinkOut - more resources