. 2020 Jan 1;123(1):243-258.
doi: 10.1152/jn.00882.2018. Epub 2019 Nov 20.

Binocular 3D otolith-ocular reflexes: responses of normal chinchillas to tilt and translation

Affiliations

Binocular 3D otolith-ocular reflexes: responses of normal chinchillas to tilt and translation

Kristin N Hageman et al. J Neurophysiol. .

Abstract

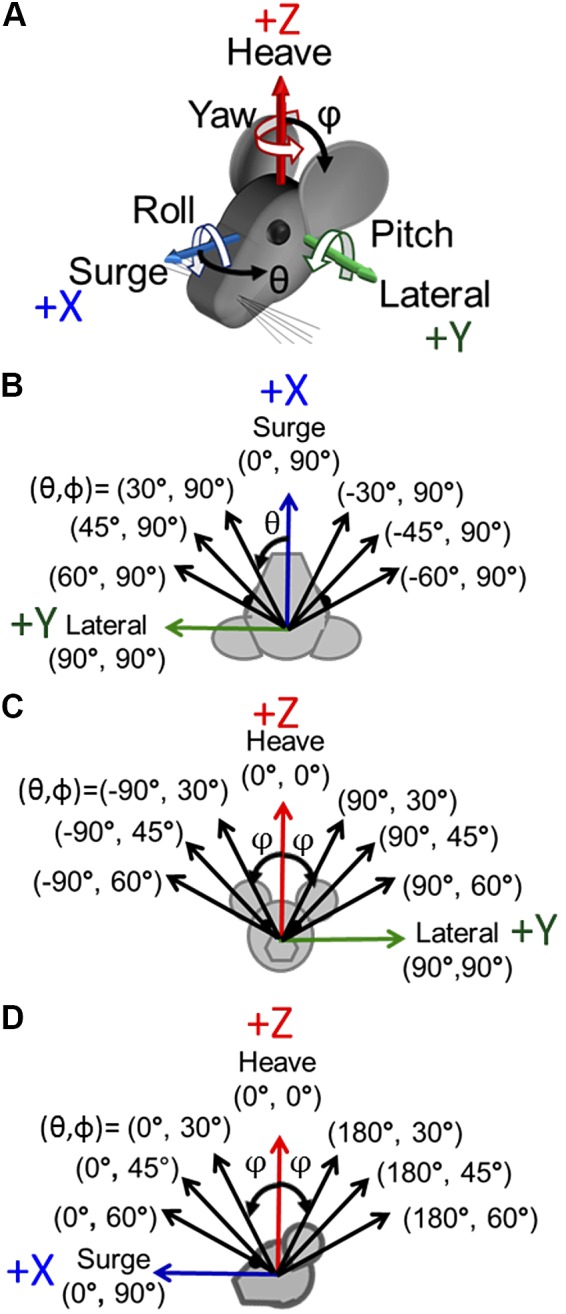
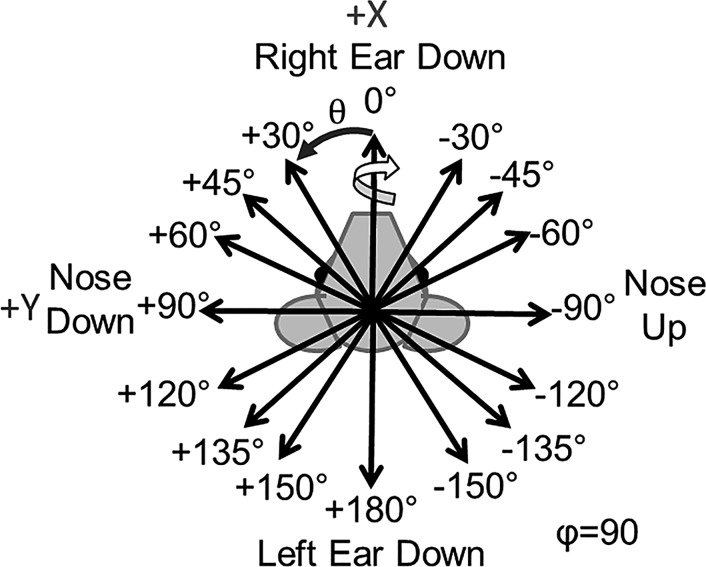
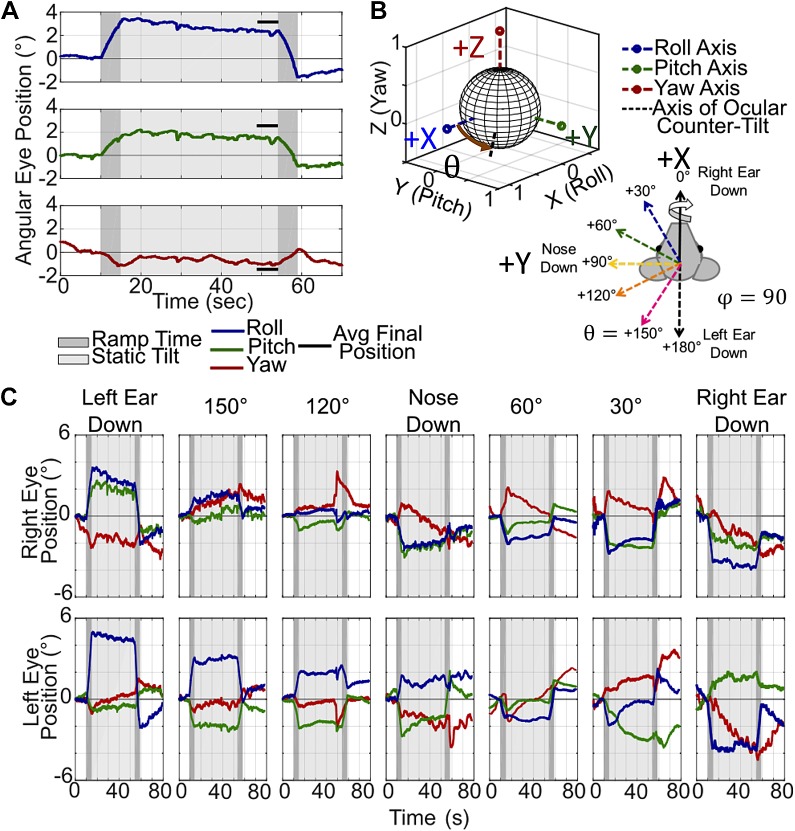
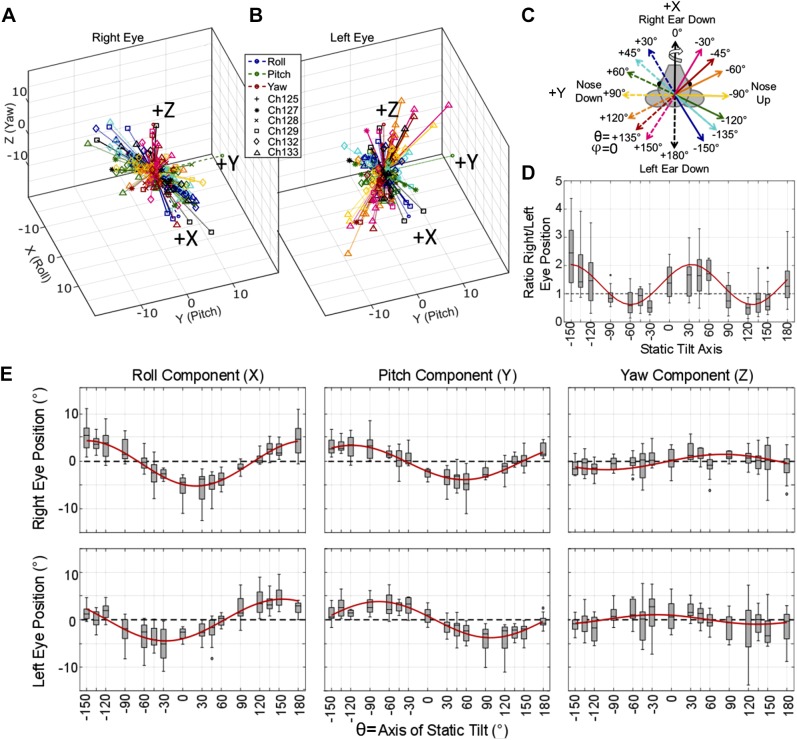
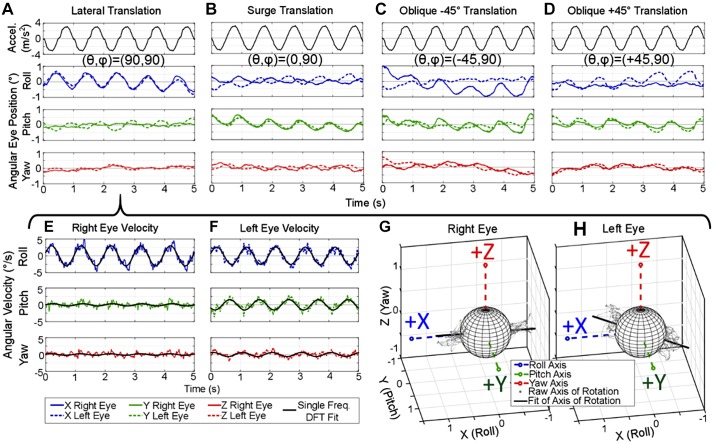
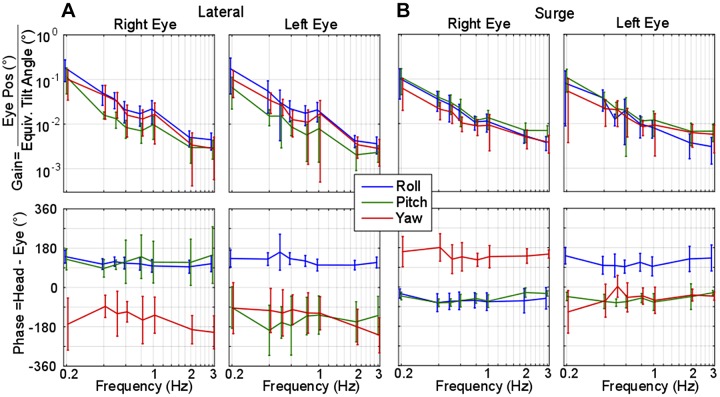
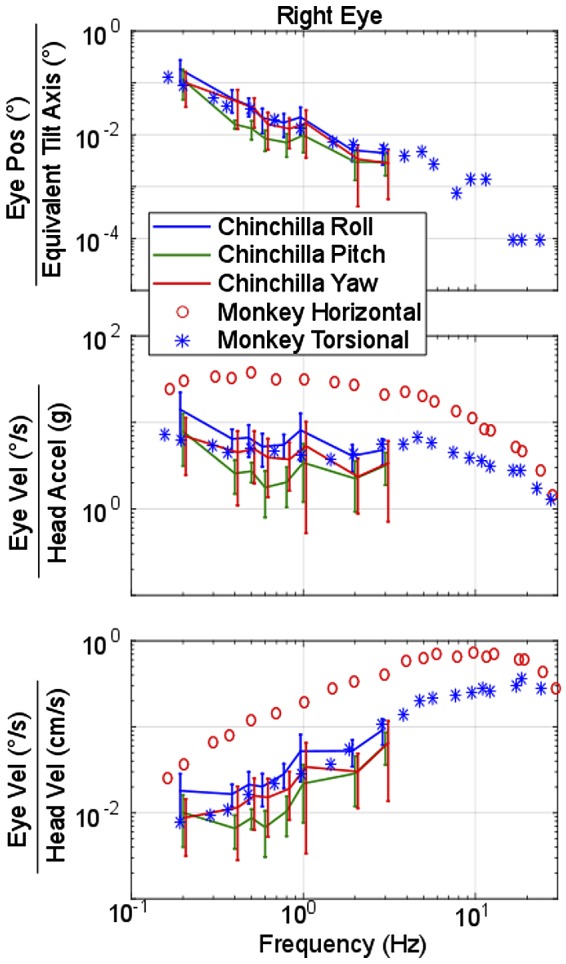
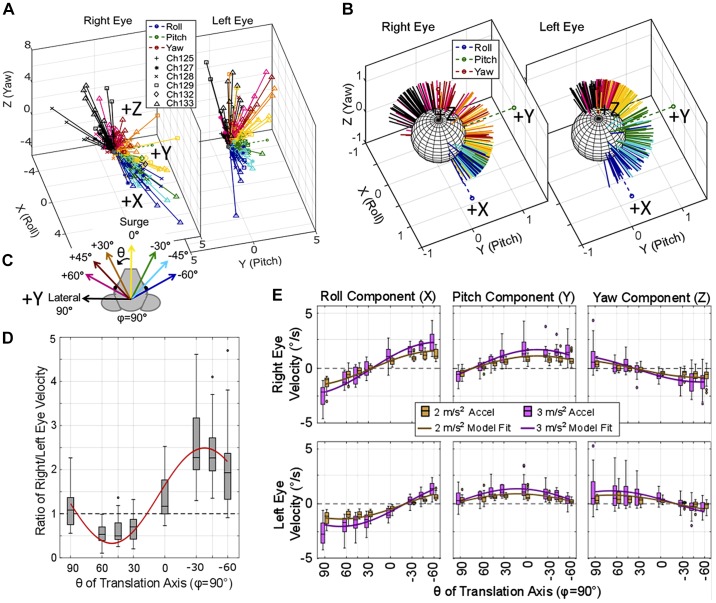
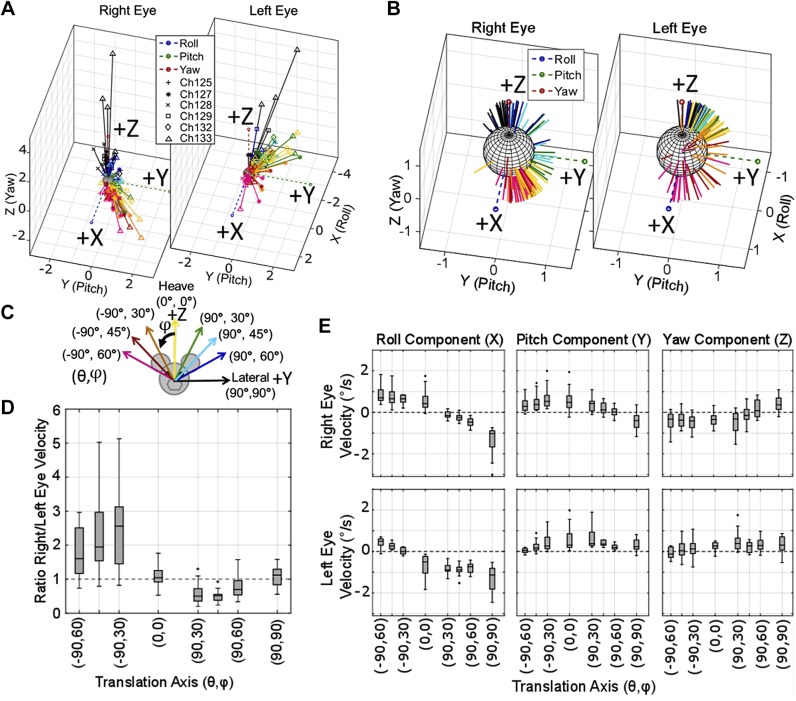
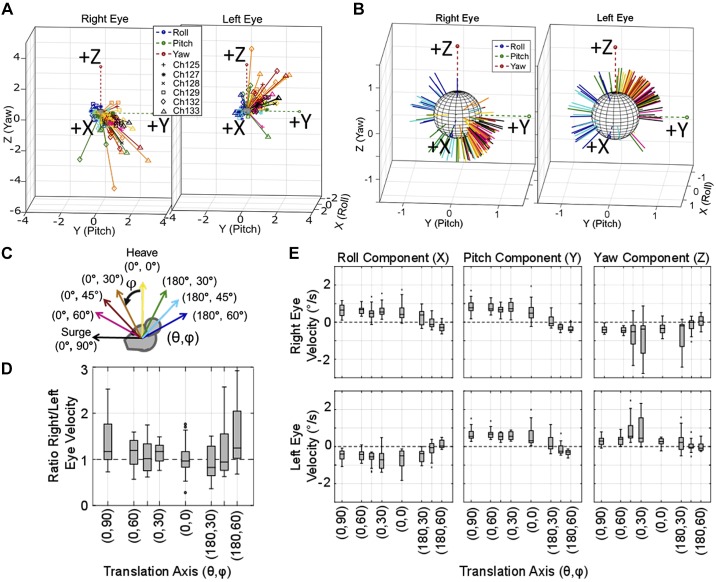
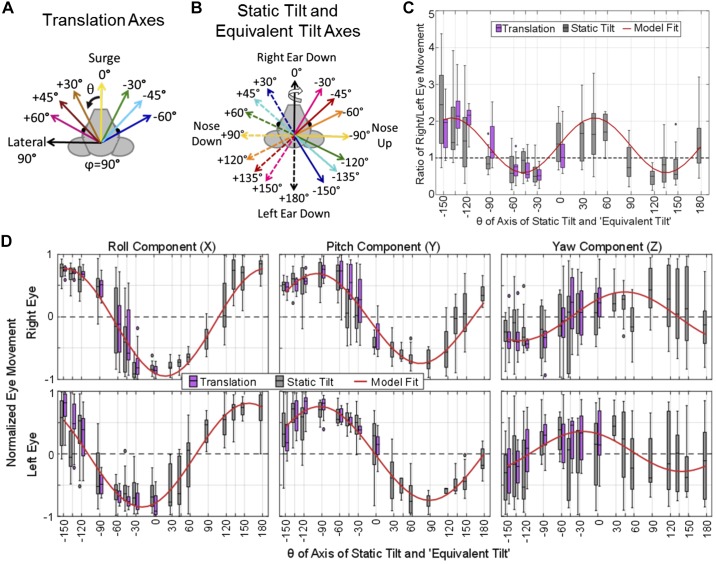
Head rotation, translation, and tilt with respect to a gravitational field elicit reflexive eye movements that partially stabilize images of Earth-fixed objects on the retinas of humans and other vertebrates. Compared with the angular vestibulo-ocular reflex, responses to translation and tilt, collectively called the otolith-ocular reflex (OOR), are less completely characterized, typically smaller, generally disconjugate (different for the 2 eyes) and more complicated in their relationship to the natural stimuli that elicit them. We measured binocular 3-dimensional OOR responses of 6 alert normal chinchillas in darkness during whole body tilts around 16 Earth-horizontal axes and translations along 21 axes in horizontal, coronal, and sagittal planes. Ocular countertilt responses to 40-s whole body tilts about Earth-horizontal axes grew linearly with head tilt amplitude, but responses were disconjugate, with each eye's response greatest for whole body tilts about axes near the other eye's resting line of sight. OOR response magnitude during 1-Hz sinusoidal whole body translations along Earth-horizontal axes also grew with stimulus amplitude. Translational OOR responses were similarly disconjugate, with each eye's response greatest for whole body translations along its resting line of sight. Responses to Earth-horizontal translation were similar to those that would be expected for tilts that would cause a similar peak deviation of the gravitoinertial acceleration (GIA) vector with respect to the head, consistent with the "perceived tilt" model of the OOR. However, that model poorly fit responses to translations along non-Earth-horizontal axes and was insufficient to explain why responses are larger for the eye toward which the GIA vector deviates.NEW & NOTEWORTHY As the first in a pair of papers on Binocular 3D Otolith-Ocular Reflexes, this paper characterizes binocular 3D eye movements in normal chinchillas during tilts and translations. The eye movement responses were used to create a data set to fully define the normal otolith-ocular reflexes in chinchillas. This data set provides the foundation to use otolith-ocular reflexes to back-project direction and magnitude of eye movement to predict tilt axis as discussed in the companion paper.

Keywords: otolith-ocular reflex; saccule; utricle; vestibular; vestibulo-ocular reflex.


Conflict of interest statement

C. C. Della Santina holds an equity interest in Labyrinth Devices, LLC, which is working to develop a vestibular implant for clinical use through a collaboration with Johns Hopkins School of Medicine and Med-El, GmbH. The terms of that arrangement are managed in accordance with John Hopkins University policies on conflicts of interest and interaction with industry.

Figures

Fig. 1.
Fig. 1.
Axes of sinusoidal translations for characterization of the 3-dimensional translational vestibulo-ocular reflex. A: the chinchilla was oriented ~50° nose-down to put the horizontal canals approximately in the Earth-horizontal plane (Hullar and Williams 2006). The +X, +Y, and +Z axes of the coordinate system shown correspond, respectively, to (θ, φ) = (0°, 90°), (90°, 90°), and (0°, 0°). For translation along an axis, those 3 cardinal axes represent surge (fore-aft, positive anterior), lateral (interaural, positive leftward), and heave (up-down, positive up). For rotations about an axis, the same 3 axes represent roll, pitch, and yaw, respectively, with positive rotations defined by a right-hand rule (curved white arrows). BD: sinusoidal translation stimuli at 1 Hz were delivered along each of 8 axes in the Earth-horizontal plane (B), 8 axes in the coronal plane (C), and 8 axes in the sagittal plane (D). Note that in spherical coordinates, θ is the azimuth referenced to +X, φ is the always-positive polar angle referenced to +Z, and (90 – φ) is the elevation from the XY plane.
Fig. 2.
Fig. 2.
Axes of whole body static tilts, viewed from above. Whole body static tilt reorientations were completed about these 16 Earth-horizontal axes (via right-hand-rule rotations). All tilts were 20° from horizontal held for 40 s before a return to the starting orientation. The rotation to get to and return from the tilt orientation was 4°/s for a 5-s duration.
Fig. 3.
Fig. 3.
Example ocular countertilt responses recorded during 20° from horizontal tilts. A: example left eye position during a left ear down tilt. The time during the ~4°/s rotation to reach the static orientation is shaded in dark gray, and the time during the static tilt in light gray. The final ocular countertilt position is calculated by averaging each component over the last 5 s in the tilted orientation, indicated by solid black lines near the eye movement traces. B: the final ocular countertilt position can be plotted in 3 dimensions, shown with the black dashed line. C: example ocular countertilt responses during static tilts about 7 of the 16 different axes. The magnitude of each component of the ocular countertilt data changes as the tilted orientation of the animal changes from left ear down to right ear down.
Fig. 4.
Fig. 4.
Ocular countertilt responses recorded from 6 chinchillas during static tilts. AC: summary (A and B) of all ocular countertilt responses during the last 5 s of a 40-s whole body tilt, measured for all 6 chinchillas during 20° static whole body tilts about the 16 axes indicated in C. A and B: right eye and left eye responses, respectively, for all 6 animals, with vector direction describing the axis of eye tilt response rotation and vector length describing the angle, in degrees, of that tilt rotation response. Each animal is denoted uniquely by a marker defined in B. Each response vector is color coded to represent the stimulus tilt axis as shown in the legend in B. The direction of eye movement response is described using the right-hand rule, as shown by the curved arrow around the solid black “Right Ear Down 0°” vector in C. The data summarized across all 6 animals in A and B are shown individually for each animal in Supplemental Fig. S1 (https://doi.org/10.6084/m9.figshare.10275386). An asymmetry is seen between the magnitude of the change in angular eye position of the right and left eye during tilts with a larger change in angular eye position during tilts about axes aligned with the contralateral eye. Tilts about the naso-occipital and interaural axes elicit ocular countertilts in the left and right eye of similar magnitude. D: to further illustrate this asymmetry, a boxplot of the ratio of right/left eye ocular countertilt position is shown. E: component-wise results from all static tilts in the 6 animals is shown. Outliers larger than 3 times the interquartile range were removed for both D and E (<11 of 184 samples were removed for each plot). Nonlinear mixed-effect models were created to predict each component of eye movement and the ratio of right eye/left eye magnitude based on the tilt axis, with a fixed effect of tilt axis and a random effect of chinchilla ID number, meaning that the fit is conditional on individual animals, (Bolker et al. 2009). The fits are shown in red, with root mean square error ≤2.53 for all fits. All fit parameters are detailed in Table 2. Each axis of static tilt has sample number n ≥ 11.
Fig. 5.
Fig. 5.
Example binocular translational vestibulo-ocular reflex (tVOR) position and velocity traces during translations along Earth-horizontal axes. AD: eye position traces from 1 chinchilla recorded during translations alonglateral/interaural axis (θ, φ) = (90°, 90°) (A); surge/fore-aft (0°, 90°) (B); anterior-right (−45°, 90°), which is approximately along the right eye’s resting line of sight (C); and anterior-left (+45°, 90°) (D), which is approximately along the left eye’s resting line of sight. Right and left eye responses (solid and dashed lines, respectively) are shown with no postprocessing filtering, illustrating the capability of the system to record the small tVOR eye movements. E and F: the eye position for the lateral translation in A can be converted to angular velocity, as shown: each component of angular velocity is fit with a single frequency discrete Fourier transform (DFT) at the frequency of the sinusoidal translation, 1 Hz in this case. G and H: the X (roll), Y (pitch), and Z (yaw) components of the eye velocity plotted in 3 dimensions over time are shown as a cloud of gray points. These points represent the axis of angular eye velocity at each point in time throughout the trial. This cloud of points can be summarized to show the axis of angular eye velocity with the DFT fit, shown as the black line in G and H.
Fig. 6.
Fig. 6.
Gain and phase of the chinchilla translational vestibulo-ocular reflex (tVOR) during lateral and surge translations. A and B: frequency sweep results during lateral (A) and surge translations (B) at 0.2–3 Hz recorded from 5 normal chinchillas. Gain is reported as the position of angular eye position in degrees divided by the equivalent tilt of the gravitation vector due to the linear acceleration [equivalent tilt = arctan(acceleration/gravity)] and plotted on a log-log scale. Steady state sinusoidal phase was calculated as the difference between peak head position and peak eye position. Negative phase indicates eye position lags head acceleration. Error bars depict one standard deviation from the mean values of either gain or phase. Lateral translations elicit a primary roll component of tVOR with a gain around 0.2; all gains decrease as frequency increases. The roll component leads head acceleration by 90° while yaw lags the head by −90 to −180°. The pitch components between both eyes are disconjugate, as expected from the equivalent head tilt theory of interpretation for tVOR. Surge translations elicit approximately equal roll and pitch gain at low frequencies, showing a decline of all gains as frequency increased. Phase values indicate disconjugate yaw and roll components while pitch was conjugate throughout all frequencies.
Fig. 7.
Fig. 7.
Comparison of monkey and chinchilla translational vestibulo-ocular reflex (tVOR) frequency response during lateral translation. Gain or sensitivity calculated in 3 different ways for right eye lateral translations. Top: angular eye position (°) divided by equivalent tilt angle [arctan(head acceleration/gravity)]. Middle: eye velocity (°/s) divided by head acceleration (g = 981 cm/s2). Bottom: eye velocity (°/s) divided by head velocity (cm/s). Data collected from Fig. 5 in Angelaki (1998) show the equivalent data recorded in monkeys, where the monkey horizontal (red circles) is equivalent to our chinchilla yaw (red lines) and monkey torsional (blue *) is equivalent to our chinchilla roll (blue lines). Note the similarity the roll/torsional components between species. However, the monkey horizontal response is much more robust than the chinchilla, a common difference seen between frontal and lateral-eyed animals. Error bars depict 1 SD from the mean values of either gain or phase.
Fig. 8.
Fig. 8.
Translational vestibulo-ocular reflex (VOR) elicited during translations along axes in the horizontal plane. A and B: 3-dimensional axis of right and left eye velocity recorded from 6 chinchillas during translations along eight axes in the horizontal plane is illustrated (A), with the normalized vectors (B). Each vector represents the single frequency discrete Fourier transform fit of the eye velocities elicited during the positive peak of acceleration of a 1-Hz sinusoidal translation in the horizontal plane (φ = 90°) with peak 2 or 3 m/s2. C: the color of the vector indicates the theta of the translation axis and the peak positive acceleration is in the direction of the arrows, as illustrated. Data for each animal are represented with the markers described in the legend in B. Translations along axes approximately aligned with the right eye’s resting line of sight (θ = −30°, −45°, −60°) produce a larger magnitude eye movement in the right eye than the left. Conversely, translations along axes approximately aligned with the left eye (θ = +60, +45, +30) elicit larger eye velocities from the left eye. D: this is further emphasized where the ratio of right/left eye velocity is shown. E: boxplots show component-wise responses grouped by θ for the eye movements elicited by both 2 m/s2 (brown) and 3 m/s2 (purple). Outliers greater than three times the interquartile range were removed for D and E (fewer than 16 of 257 samples were removed for each plot). Nonlinear mixed-effect models were created to predict each component of eye movement and the ratio of right eye/left eye magnitude based on the magnitude of translation and the theta of the translation axis with a random effect of chinchilla ID number. The fits for each component of eye movement during 2 and 3 m/s2 translations are shown in brown and purple in E and the fit for the ratio of right/left eye velocity is shown in red in E. All model results had root means square error ≤0.74. All fit parameters are detailed in Table 2. Each axis of translation for each amplitude (i.e., each individual box and whisker plot has n ≥ 11).
Fig. 9.
Fig. 9.
Translational vestibulo-ocular reflex (VOR) elicited during translations along axes in the coronal plane. Binocular 3-dimensional eye velocities recorded from 6 chinchillas, elicited during 1-Hz sinusoidal translations in the coronal plane with a 2 m/s2 peak acceleration. A: the binocular axes of eye velocity; normalized vectors shown in B to better visualize the spatial spread for each translation direction. B: each animal’s data are represented with the markers described in the legend. C: color of each vector indicates the translation direction as illustrated. In A, an asymmetry between the right and left eye velocity magnitude is seen, similar to that seen in Fig. 8A, where each eye’s velocity is greatest during translations along axes approximately aligned with the ipsilateral eye. D: boxplot further emphasizes the point from A, showing the ratio of right eye/left eye velocity. Translations oriented along the quadrant of the right eye (pink, red, and orange in A and B) elicit a larger right eye velocity than left (ratio>1 in D). Translations oriented along the quadrant of the left eye (green, light blue, and dark blue in A and B) elicit a larger left eye velocity than right (ratio <1 in D). E: boxplot shows component-wise eye velocities. During coronal plane translations, the eyes generally show conjugacy in all 3 components, except during heave (0°, 0°) and lateral (90°, 90°) movements. All outliers larger than three times the interquartile range for D and E were removed (fewer than 13 of 131 samples were removed for each plot). Each box for each axis has samples n ≥ 14.
Fig. 10.
Fig. 10.
Translational vestibulo-ocular reflex (tVOR) elicited during translations along axes in the sagittal plane. A: axes of the right and left eyes, which have larger magnitudes for translations toward the front of the animals (black, pink, red, and orange) than toward the back of the animal (green, light blue, dark blue). B: normalized data are shown to visualize the spatial spread of the sagittal plane tVOR; each animal’s data are represented with the markers described in the legend. C: axis of eye velocity recorded from 6 chinchillas during 1-Hz sinusoidal translations along 8 axes in the sagittal plane with peak 2 m/s2 acceleration is shown. D: a boxplot of the ratio of right eye/left eye velocity illustrates that the 2 eyes rotate at approximately the same velocity for translations in all the directions. F: the boxplot shows component-wise eye velocity for each axis of translation, illustrating that the 2 eye remain primarily disconjugate in roll and yaw, and conjugate in pitch. All outliers larger than 3 times the interquartile range for D and E were removed (fewer than 6 of 131 samples were removed for each plot). Each box plot for each axis has samples n ≥ 13.
Fig. 11.
Fig. 11.
Comparison of tilt versus translation eye movement data. A and B: to compare the changes in eye position elicited during static tilts to the axis of eye velocity during translations, the axes of translation (A) can be converted to equivalent tilt axes (B). The color and style of each line in A corresponds to the equivalent tilt axis of the same color and style in B. For example, a surge acceleration toward the front (solid yellow line at 0° in A) is equivalent to a tilt axis about the solid yellow at −90°, nose up in B. C and D: after adjusting the translation axes, we accounted for difference in the magnitude of eye movements between the 2 groups by taking the ratio of right eye/left eye magnitude (C) and by normalizing the data (D). C: similar pattern for tilts and translations with larger magnitude of eye movement elicited in the eye that is contralateral to the axis of the tilt (i.e., tilts about the left eye elicit larger right eye magnitudes of ocular countertilt and vice versa). D: to compare the direction of eye movements elicited from translations versus tilts, the normalized components for each case are shown, where the direction of eye movement is similar for each component between tilts and translations. Outliers larger than 1.5 times the interquartile ranger were removed (fewer than 14 of 441 samples were removed for each plot). A nonlinear mixed-effect model was created to predict each of these components (D) and the ratio of right/left eye movement (C), with fixed effects of tilt direction and type of movement (tilt or translation) and a random effect of chinchilla ID number. Model output is shown in red in C and D; model parameters are detailed in Table 3. An ANOVA of the results of this nonlinear mixed-effect models and a similar one after eliminating type of movement showed no detectable difference when a fixed effect of “type of movement” is included (P values for each model all >0.86), indicating that whether the eye movement was recorded during a tilt or translation did not play a significant role in creation of the model.

Similar articles

Cited by

References

    1. Angelaki DE. Three-dimensional organization of otolith-ocular reflexes in rhesus monkeys. III. Responses to translation. J Neurophysiol 80: 680–695, 1998. doi:10.1152/jn.1998.80.2.680. - DOI - PubMed
    1. Baarsma EA, Collewijn H. Eye movements due to linear accelerations in the rabbit. J Physiol 245: 227–247, 1975. doi:10.1113/jphysiol.1975.sp010842. - DOI - PMC - PubMed
    1. Bolker BM, Brooks ME, Clark CJ, Geange SW, Poulsen JR, Stevens MHH, White JSS. Generalized linear mixed models: a practical guide for ecology and evolution. Trends Ecol Evol 24: 127–135, 2009. doi:10.1016/j.tree.2008.10.008. - DOI - PubMed
    1. Boutros PJ, Schoo DP, Rahman M, Valentin NS, Chow MR, Ayiotis AI, Morris BJ, Hofner A, Rascon AM, Marx A, Deas R, Fridman GY, Davidovics NS, Ward BK, Treviño C, Bowditch SP, Roberts DC, Lane KE, Gimmon Y, Schubert MC, Carey JP, Jaeger A, Della Santina CC. Continuous vestibular implant stimulation partially restores eye-stabilizing reflexes. JCI Insight 4: 128397, 2019. doi:10.1172/jci.insight.128397. - DOI - PMC - PubMed
    1. Carey JP, Della Santina C. Principles of applied vestibular physiology. In: Cummings Otolaryngology: Head & Neck Surgery. Philadelphia, PA: Mosby, 2005, p. 3115–3159.

Publication types

MeSH terms