. 2019 Nov 19;29(8):2164-2174.e5.
doi: 10.1016/j.celrep.2019.10.045.

Non-Genetic Intra-Tumor Heterogeneity Is a Major Predictor of Phenotypic Heterogeneity and Ongoing Evolutionary Dynamics in Lung Tumors

Affiliations

Non-Genetic Intra-Tumor Heterogeneity Is a Major Predictor of Phenotypic Heterogeneity and Ongoing Evolutionary Dynamics in Lung Tumors

Anchal Sharma et al. Cell Rep. .

Abstract

Impacts of genetic and non-genetic intra-tumor heterogeneity (ITH) on tumor phenotypes and evolvability remain debated. We analyze ITH in lung squamous cell carcinoma at the levels of genome, transcriptome, and tumor-immune interactions and histopathological characteristics by multi-region bulk and single-cell sequencing. Genomic heterogeneity alone is a weak indicator of intra-tumor non-genetic heterogeneity at immune and transcriptomic levels that impact multiple cancer-related pathways, including those related to proliferation and inflammation, which in turn contribute to intra-tumor regional differences in histopathology and subtype classification. Tumor subclones have substantial differences in proliferation score, suggestive of non-neutral clonal dynamics. Proliferation and other cancer-related pathways also show intra-tumor regional differences, sometimes even within the same subclones. Neo-epitope burden negatively correlates with immune infiltration, indicating immune-mediated purifying selection on somatic mutations. Taken together, our observations suggest that non-genetic heterogeneity is a major determinant of heterogeneity in histopathological characteristics and impacts evolutionary dynamics in lung cancer.


Conflict of interest statement

DECLARATION OF INTERESTS

The authors declare no competing interests.

Figures

Figure 1.
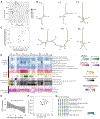
Figure 1.. Assessment of Genetic Heterogeneity in Lung Squamous Cell Cancer
(A) Schematic representation of the study design showing multi-dimensional analysis of intra-tumor heterogeneity based on multi-region profiling of tumor specimens. (B)Heatmap shows regional variation in allele frequency of somatic single nucleotide variants (SNVs) for 8 patient samples. Somatic variants below detection threshold (<2% allele frequency) are marked in gray. Variations are categorized into three categories: ubiquitous, present in all regions (blue); shared, present in multiple regions but not all (yellow); and unique, present in single region (orange). Dendrograms represent genetic similarity (represented by branch length) between different regions within a tumor for each patient sample based on variant allele frequency of somatic SNVs. Numbers on the nodes represents bootstrap values. (C) Regional differences in inferred telomere length in tumor regions, relative to matched normal tissue. (D) Relative abundance of somatic mutation clusters identified in different tumor regions for P6. (E) COSMIC mutational signatures inferred from somatic base changes in tumors corresponding to the mutations that are ubiquitous (U) and non-ubiquitous (NU; i.e., shared and unique). Signature 1, mutational process initiated by spontaneous deamination of 5-methyl cytosine; signature 2, mutational process due to APOBEC activity; signature 3, mutational process due to homologous recombination defect; signature 4, mutational process due to smoking; signature 6, mutational process due to defective DNA mismatch repair; signature 13, mutational process due to APOBEC activity; signature 15, mutational process due to defective DNA mismatch repair; signature 26, mutational process due to defective DNA mismatch repair; and signature 29, mutational process due to tobacco chewing habit.
Figure 2.
Figure 2.. Assessment of Intra-tumor Transcriptomic Heterogeneity in Lung Squamous Cell Cancer
(A) Principal-component analysis (PCA) plot showing the extent of transcriptomic variation within and across tumor and non-malignant tissue regions from the patients. Non-malignant tissues from different patients are shown in black, whereas tumor tissues from different patients are shown in other colors. The proportion of variation explained by the first and second principal components are 46.53% and 16.35%, respectively. (B) Dendrograms represent similarity (represented by branch length) between different regions for each patient sample based on gene expression profiles for all genes. Numbers on the nodes represent bootstrap values. (C) Scatterplot comparing the extent of transcriptomic and genomic divergence for different tumor regions from their respective matched non-malignant tissues. Color codes are same as in (A). (D) Heatmaps showing the extent of pathway disruption activity measured using nJSD, proliferative score, apoptosis score, epithelial-mesenchymal score, TERT expression, hypoxia score, multi-drug-resistant pathway disruption activity, and histological subtype score based on expression of published biomarker genes for different tumor regions. (E) Scatterplot showing inverse association between TERT expression and telomere length estimates. Spearman correlation coefficient and p value are shown at the top. (F) Scatterplot comparing the extent of transcriptomic and genomic intra-tumor heterogeneity for the tumor samples. The color code is same as in (A). (G) Oncoprint plot showing histological subtype (secretory characteristics), proliferative score, apoptotic score, and epithelial versus mesenchymal characteristics score for the tumor samples ranked according to their ratio of transcriptomic ITH over genetic ITH.
Figure 3.
Figure 3.. Assessment of Intra-tumor Immune Heterogeneity in Lung Squamous Cell Cancer
(A) Estimated immune score (top panel), relative proportion of different immune cell types including M2 macrophages, plasma cells, CD4, and CD8 T cells (bottom panel). (B) Dendrograms represent similarity (represented by branch length) between different regions for each patient sample based on estimated immune cell fractions in different regions. (C) Neo-epitope (total) burden, as predicted using mutation and expression data, in different regions of all patient samples (top panel), and anti-PD1 favor score, a measure of responsiveness against anti-PD1 therapy, in different regions of all patient samples (bottom panel). (D) Somatic mutations in the tumor samples and those that are designated as neo-epitopes are grouped as ubiquitous, shared, and unique depending on their regional presentation. An excess of unique epitopes relative to the patterns observed for all somatic variants is indicative of negative selection on the neo-epitopes. (E) Scatterplot comparing the extent of immune and genetic divergence (left panel) and the extent of immune and transcriptomic divergence (right panel) for different tumor regions from their respective matched non-malignant tissues. Color codes are same as Figure 2A.
Figure 4.
Figure 4.. Impact of Multi-level Intra-tumor Heterogeneity
(A) As an example, multi-level intra-tumor heterogeneity in patient P4, a 56-year-old male exsmoker patient with stage IIIA tumor, is presented. Regional variations in histological characteristics and immune cell infiltration correlate with predicted subtype characteristics and immune scores. Furthermore, the tumor shows regional variations in proliferation and apoptosis scores, indicating coherence in multi-level intra-tumor heterogeneity. H&E stained slides for different regions of P4 are shown with scale bars of 50 μm at bottom right corners.
Figure 5.
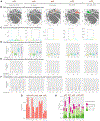
Figure 5.. Intra-tumor Heterogeneity at Single-Cell Resolution
(A) Clinical information of 5 patients for which multi-region single-cell sequencing data was performed by Lambrechts et al. (2018). (B) tSNE plots show the transcriptomic heterogeneity of the tumor cell populations and also non-malignant cell populations for reference. Tumor cells from different regions, namely, core, middle, and edge, of each tumor are colored with red, green, and blue, respectively, whereas all non-malignant cells are shown in gray. (C) Tumor clonal architecture inferred from single cell RNA-seq data-guided copy number variation calls. For each tumor, 4 major subclonal clusters are numbered C1, C2, C3, and C4, marked with different colors. (D) Boxplots showing distribution of proliferation scores of all tumor cells grouped by their subclonal cluster membership. (E) Boxplots showing distribution of proliferation scores of all tumor cells grouped by different geographical regions—core (C), middle (M), and edge (E). (F) Boxplots showing distribution of proliferation scores of all tumor cells grouped by different geographical regions and cluster identifier. Color codes are consistent between (B), (E), and (F) and also between (C) and (D). (G) Proportion of immune cells out of total cells isolated for each patient. (H) Proportion of different tumor relevant immune cell populations out of total immune cells for each tumor.

References

    1. Aghili L, Foo J, DeGregori J, and De S (2014). Patterns of somatically acquired amplifications and deletions in apparently normal tissues of ovarian cancer patients. Cell Rep. 7, 1310–1319. - PMC - PubMed
    1. Alexandrov LB, Nik-Zainal S, Wedge DC, Aparicio SAJR, Behjati S, Biankin AV, Bignell GR, Bolli N, Borg A, Børresen-Dale A-L, et al.; Australian Pancreatic Cancer Genome Initiative; ICGC Breast Cancer Consortium; ICGC MMML-Seq Consortium; ICGC PedBrain (2013). Signatures of mutational processes in human cancer. Nature 500, 415–421. - PMC - PubMed
    1. Alexandrov LB, Ju YS, Haase K, Van Loo P, Martincorena I, Nik-Zainal S, Totoki Y, Fujimoto A, Nakagawa H, Shibata T, et al. (2016). Mutational signatures associated with tobacco smoking in human cancer. Science 354, 618–622. - PMC - PubMed
    1. Andor N, Graham TA, Jansen M, Xia LC, Aktipis CA, Petritsch C, Ji HP, and Maley CC (2016). Pan-cancer analysis of the extent and consequences of intratumor heterogeneity. Nat. Med 22, 105–113. - PMC - PubMed
    1. Ardeshir-Larijani F, Bhateja P, Lipka MB, Sharma N, Fu P, and Dowlati A (2018). KMT2D Mutation Is Associated With Poor Prognosis in Non-Small-Cell Lung Cancer. Clin. Lung Cancer 19, e489–e501. - PubMed

Publication types