

EPS8 Facilitates Uncoating of Influenza A Virus
- PMID: 31747592
- PMCID: PMC6929677
- DOI: 10.1016/j.celrep.2019.10.064
EPS8 Facilitates Uncoating of Influenza A Virus
Abstract
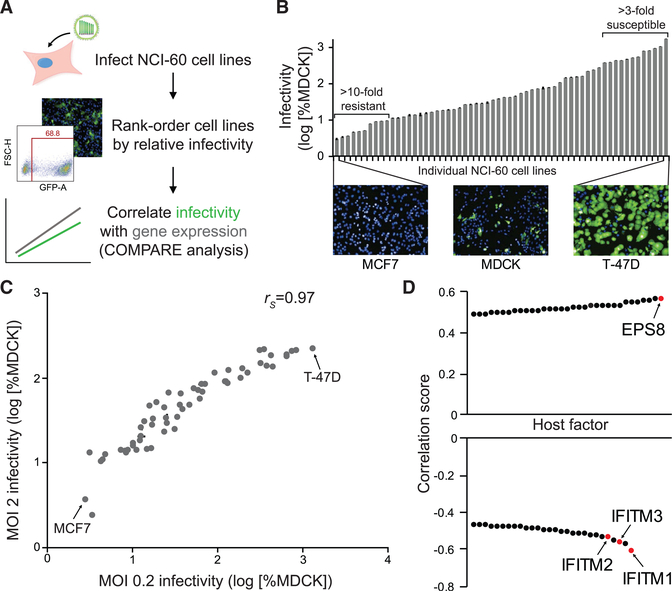
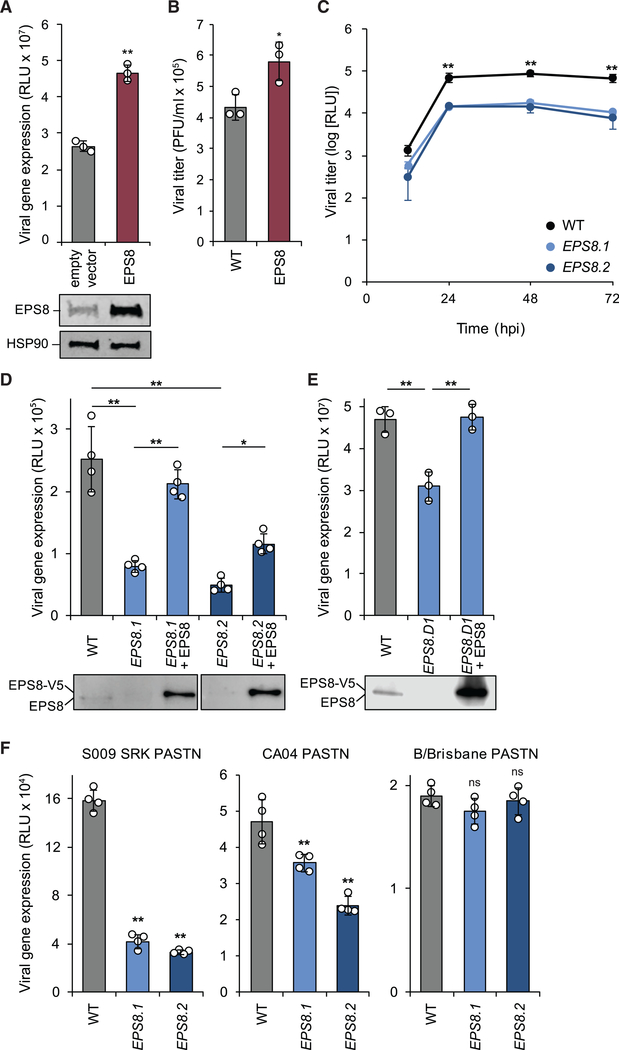
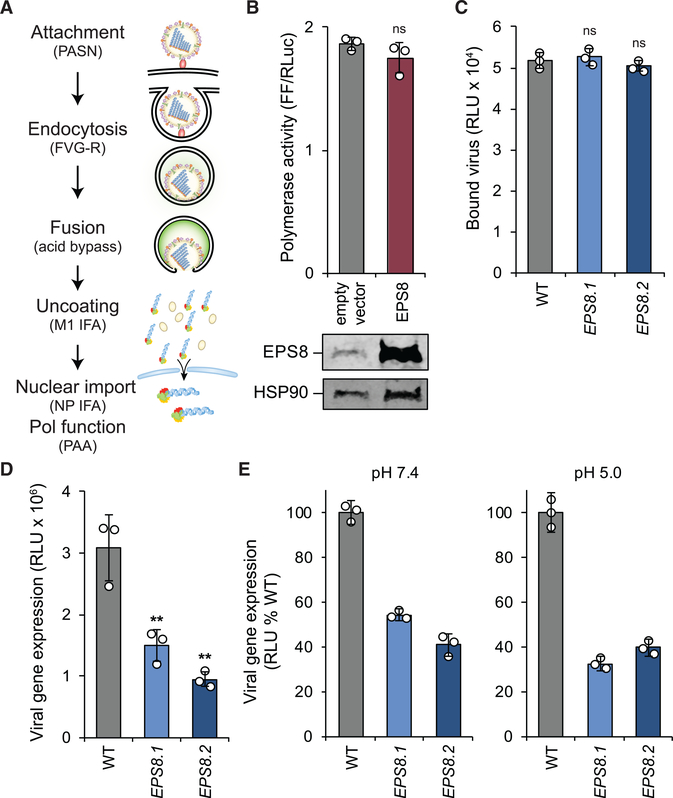
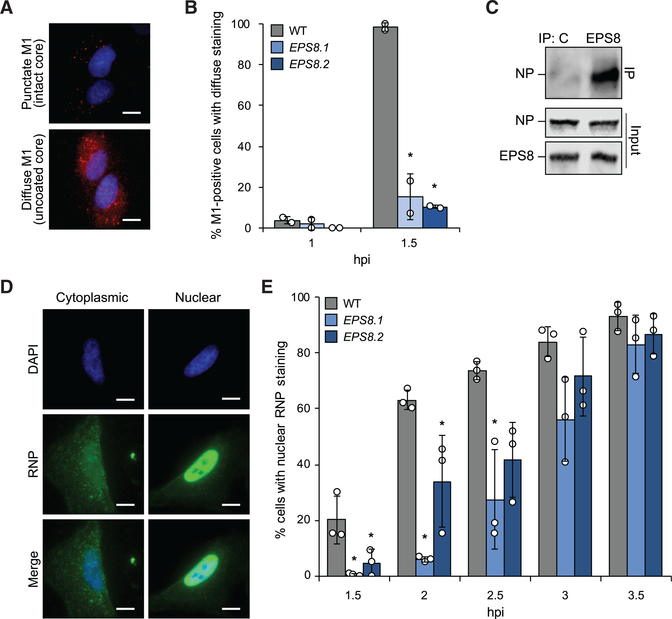
All viruses balance interactions between cellular machinery co-opted to support replication and host factors deployed to halt the infection. We use gene correlation analysis to perform an unbiased screen for host factors involved in influenza A virus (FLUAV) infection. Our screen identifies the cellular factor epidermal growth factor receptor pathway substrate 8 (EPS8) as the highest confidence pro-viral candidate. Knockout and overexpression of EPS8 confirm its importance in enhancing FLUAV infection and titers. Loss of EPS8 does not affect virion attachment, uptake, or fusion. Rather, our data show that EPS8 specifically functions during virion uncoating. EPS8 physically associates with incoming virion components, and subsequent nuclear import of released ribonucleoprotein complexes is significantly delayed in the absence of EPS8. Our study identifies EPS8 as a host factor important for uncoating, a crucial step of FLUAV infection during which the interface between the virus and host is still being discovered.
Keywords: NCI-60; entry; epidermal growth factor receptor pathway substrate 8 (EPS8); gene correlation analysis; influenza virus; uncoating.
Copyright © 2019 The Author(s). Published by Elsevier Inc. All rights reserved.
Conflict of interest statement
DECLARATION OF INTERESTS
The authors declare no competing interests.
Figures
Similar articles
-
How Influenza Virus Uses Host Cell Pathways during Uncoating.Cells. 2021 Jul 8;10(7):1722. doi: 10.3390/cells10071722. Cells. 2021. PMID: 34359892 Free PMC article. Review.
-
Real-time dissection of dynamic uncoating of individual influenza viruses.Proc Natl Acad Sci U S A. 2019 Feb 12;116(7):2577-2582. doi: 10.1073/pnas.1812632116. Epub 2019 Jan 9. Proc Natl Acad Sci U S A. 2019. PMID: 30626642 Free PMC article.
-
The Nucleolar Protein LYAR Facilitates Ribonucleoprotein Assembly of Influenza A Virus.J Virol. 2018 Nov 12;92(23):e01042-18. doi: 10.1128/JVI.01042-18. Print 2018 Dec 1. J Virol. 2018. PMID: 30209172 Free PMC article.
-
Human Papillomavirus 16 Infection Induces VAP-Dependent Endosomal Tubulation.J Virol. 2018 Feb 26;92(6):e01514-17. doi: 10.1128/JVI.01514-17. Print 2018 Mar 15. J Virol. 2018. PMID: 29321327 Free PMC article.
-
[Correlation of Eps8 with proliferation, metastasis and prognosis of malignant tumors].Zhongguo Shi Yan Xue Ye Xue Za Zhi. 2013 Apr;21(2):493-7. doi: 10.7534/j.issn.1009-2137.2013.02.050. Zhongguo Shi Yan Xue Ye Xue Za Zhi. 2013. PMID: 23628062 Review. Chinese.
Cited by
-
ABTB1 facilitates the replication of influenza A virus by counteracting TRIM4-mediated degradation of viral NP protein.Emerg Microbes Infect. 2023 Dec;12(2):2270073. doi: 10.1080/22221751.2023.2270073. Epub 2023 Nov 2. Emerg Microbes Infect. 2023. PMID: 37823597 Free PMC article.
-
Pathogenicity and virulence of influenza.Virulence. 2023 Dec;14(1):2223057. doi: 10.1080/21505594.2023.2223057. Virulence. 2023. PMID: 37339323 Free PMC article. Review.
-
How Influenza Virus Uses Host Cell Pathways during Uncoating.Cells. 2021 Jul 8;10(7):1722. doi: 10.3390/cells10071722. Cells. 2021. PMID: 34359892 Free PMC article. Review.
-
An anti-influenza combined therapy assessed by single cell RNA-sequencing.Commun Biol. 2022 Oct 10;5(1):1075. doi: 10.1038/s42003-022-04013-4. Commun Biol. 2022. PMID: 36216966 Free PMC article.
-
The Development of Methods for the Production of New Molecular Vaccines and Appropriate RNA Fragments to Counteract Unwanted Genes: A Pilot Study.Vaccines (Basel). 2023 Jul 11;11(7):1226. doi: 10.3390/vaccines11071226. Vaccines (Basel). 2023. PMID: 37515042 Free PMC article.
References
-
- Banerjee I, Miyake Y, Nobs SP, Schneider C, Horvath P, Kopf M, Matthias P, Helenius A, and Yamauchi Y (2014). Influenza A virus uses the aggresome processing machinery for host cell entry. Science 346, 473–477. - PubMed
-
- Bukrinskaya AG, Vorkunova NK, Kornilayeva GV, Narmanbetova RA, and Vorkunova GK (1982). Influenza virus uncoating in infected cells and effect of rimantadine. J. Gen. Virol 60, 49–59. - PubMed
-
- Carette JEE, Guimaraes CPP, Varadarajan M, Park ASS, Wuethrich I, Godarova A, Kotecki M, Cochran BHH, Spooner E, Ploegh HLL, et al. (2009). Haploid genetic screens in human cells identify host factors used by pathogens. Science 326, 1231–1235. - PubMed
Publication types
MeSH terms
Substances
Grants and funding
LinkOut - more resources
Full Text Sources
Research Materials
