. 2019 Nov 19;29(8):2371-2383.e5.
doi: 10.1016/j.celrep.2019.10.063.

Cellular Interactome Dynamics during Paclitaxel Treatment

Affiliations

Cellular Interactome Dynamics during Paclitaxel Treatment

Juan D Chavez et al. Cell Rep. .

Abstract

Cell-cycle inhibitors, including paclitaxel, are among the most widely used and effective cancer therapies. However, several challenges limit the success of paclitaxel, including drug resistance and toxic side effects. Paclitaxel is thought to act primarily by stabilizing microtubules, locking cells in a mitotic state. However, the resulting cytotoxicity and tumor shrinkage rates observed cannot be fully explained by this mechanism alone. Here we apply quantitative chemical cross-linking with mass spectrometry analysis to paclitaxel-treated cells. Our results provide large-scale measurements of relative protein levels and, perhaps more importantly, changes to protein conformations and interactions that occur upon paclitaxel treatment. Drug concentration-dependent changes are revealed in known drug targets including tubulins, as well as many other proteins and protein complexes involved in apoptotic signaling and cellular homeostasis. As such, this study provides insight into systems-level changes to protein structures and interactions that occur with paclitaxel treatment.

Keywords: ATP synthase; chemical cross-linking; interactome; mass spectrometry; microtubules; mitochondria; mitotic inhibitor; paclitaxel; quantitative analysis; stable isotope labeling.


Conflict of interest statement

DECLARATION OF INTERESTS

The authors declare no competing interests.

Figures
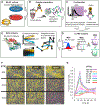
Figure 1.
Figure 1.. Experimental Overview
(A) Cells are cultured in SILAC media; the isotopically light or heavy cells are treated with the mitotic inhibitors PTX (5, 10, 20, 50, 100, and 500 nM), NOC (3 μM), CA4 (5 nM), and STLC (5 μM); and the corresponding isotope pair is treated with 0.1% (v/v) DMSO vehicle control. (B) Cells are cross-linked with 10 mM BDP-NHP, followed by lysis and protein extraction with 8 M urea and tryptic digestion. (C) Peptide samples are fractionated by strong cation exchange (SCX) chromatography, with early eluting fractions (1–5) containing non-cross-linked peptides used for global proteome quantification and later fractions(6–14) subjected to avidin affinity chromatography and used for cross-linked peptide pair identification and quantification. (D) LC-MS analysis consists of MS1 measurement of light and heavy SILAC isotope precursor ions followed by MS2 analysis of fragment ions. For cross-linked peptide pairs, detection of a protein interaction reporter (PIR) mass relationship triggers MS3 of the released peptides for sequence determination. (E) Data analysis consists of integrating protein-level and cross-link-level quantitative information. Drug concentration-dependent trends in cross-linked peptide pairs are identified by statistical filtering and longitudinal k-means clustering. Cross-link data are analyzed in terms of protein structural information. (F) A collection of nine representative images of HeLa cells treated with PTX. PTX concentration increases (0, 20, and 50 nM) while scanning the images from the top to bottom, and treatment time increases(0, 3, and 18 h) from left to right. The cells are colored yellow by a software-applied mask, while rounded cells that are locked in mitosis are colored magenta. Scale bar of 1000 μm indicated on lower right image. (G) Line graph plotting the fraction of mitotic cells on the y axis and PTX treatment time on the x axis (biological replicates, n = 3).
Figure 2.
Figure 2.. Quantitative Cross-Linking Reveals PTX Stabilized MTs
(A) MT structure (PDB: 3EDL) displayed as a molecular surface with a ribbon structure inset, illustrating the α-tubulin (maroon) and β-tubulin (gold) subunits. Cross-linked Lys residues are shown as green space-filled residues, with cross-links displayed as colored bars connecting them (TBA1A K60-K370, orange; TBA4A K60-K370, purple; TBB5/TBB4B K216-TBA1A K326, blue; TBB4B K58-TBA1A K370, green; TBB5 K58-TBA1A K370, magenta). The non-exchangeable GTP binding site (N-site) is indicated by a yellow-highlighted region on α-tubulin. The exchangeable GTP binding site (E-site) is indicated by a cyan-colored region on β-tubulin. The PTX binding site on β-tubulin is red. (B) Protein and cross-link levels measured by SILAC for four tubulin isoforms (TBA1A, dark red dashed line; TBA4A, red dashed line; TBB4B, gray dashed line; TBB5, black dashed line). Cross-links are colored the same as in (A). (C) Quantified levels of TBB5/TBB4B K216-TBA1A K326 and TBA1A K60-K370 with PTX (50, 100, and 500 nM), CA4 (5 nM), and STLC (5 μM). Error bars represent 95% confidence intervals for n = 6 replicate injections of 2 biological samples.
Figure 3.
Figure 3.. PTX Induced Effects on MFs
(A) Quantitation of cross-linked peptide pairs involving K328 of ACTB. Although the primary sequences for these peptide pairs were the same (IK330IIAPPER-MQK317EITALAPSTMK), one form contained only the cross-link modification on K328 and K317 (red line), while two other forms contained oxidation of methionine at M325 (yellow line) or M313 (green line). The ACTA protein level is shown as a black dashed line. Error bars represent 95% confidence intervals. (B) MF structure (PDB: 6FHL) displayed as a molecular surface with five actin monomers and ribbon structures for two of the actin subunits. Cross-linked sites are displayed as green space-filled residues with the Cα-Cα distance displayed. The link between K328 and K315 is compatible with formation within a single actin subunit. The link between K328 and K61 exceeds the expected maximum cross-linkable distance (42 Å) when mapped within a single actin subunit but is compatible between neighboring actin subunits (20.4 Å). The homodimeric link at K328 is not compatible with forming between actin subunits existing with the structure of a single MF (54.9 Å) and therefore likely represents a different conformation. The K330 homodimer link could potentially form between actin subunits in neighboring MFs, where they come into close proximity, such as when they are packed into MF bundles. (C) Bar chart illustrated quantified cross-linked peptide pair levels in actin with PTX (50, 100, and 500 nM), NOC (3 μM), CA4 (5 nM), and STLC (5 μM). Error bars represent 95% confidence intervals for n = 6 replicate injections of 2 biological samples.
Figure 4.
Figure 4.. PTX Induced Effects on Keratin IFs
(A) Quantified protein abundances for three keratin isoforms (K1C18, green; K2C8, orange; K2C7, red). Error bars represent 95% confidence intervals from n = 6 replicate injections of 2 biological samples. (B) Interaction network illustrating cross-linked Lys residues as nodes and cross-links as edges between and within K2C7 (red), K1C18 (green), and K2C8 (orange). Edges are colored according to KML cluster (Figure S2). (C) Heatmap of 22 cross-links involving K2C8, K1C18, and K2C7 quantified with PTX concentrations ranging from 5–500 nM, NOC (3 μM), CA4 (5 nM), and STLC (5 μM). Values are mean log2 ratios from n = 6 replicate injections of 2 biological samples.
Figure 5.
Figure 5.. PTX Induced Conformational Change in CV
(A) Line graph illustrating relative cross-linked peptide pair and global protein abundance levels displayed as log2(PTX/DMSO) values on the y axis and PTX concentration on the x axis for CV subunits. Plotted cross-links are as follows: ATPA K427-ATPB K522 (light blue), ATPB K485-ATPA K506 (green), ATPB K485-K225 (orange), ATPB K124-ATPO K192 (yellow), ATPO K192-ATPB K124 (* indicates missed tryptic cleavage on the ATPB peptide GQKVLDSGAPIK124IPVGPETLGR, dark blue), ATPA protein levels (green dashed line), ATPB protein levels (dark blue dashed line), and ATPO protein levels (brown dashed line). (B) Ribbon structure of CV (PDB: 5ARA) illustrating the F1 region, which extends into the mitochondrial matrix, and the F0 region, embedded in the inner-mitochondrial membrane. The zoomed inset illustrates ATPA (dark blue), ATPB (gold), and ATPO (magenta), with cross-linked Lys shown as red space-filled residues. (C) Summary of mitochondrial oxygen consumption rate (OCR) measurements of HeLa cells treated with PTX (0, 5, 10, 20, and 500 nM) for 18 h. Data are represented as mean ± SEM with n = 9 (3 wells each for 3 replicate plates). See Figure S7F.
Figure 6.
Figure 6.. PTX Induced Changes to PHB Complex
(A) Interaction network of PHB (green) and PHB2 (orange) cross-links. Edges are colored according to KML cluster (Figure S2). (B) Quantified protein and cross-link levels for PHBs: PHB (green dashed line), PHB2 (orange dashed line), PHB K202 (* indicates missed tryptic cleavage site on PHB peptide FVVEK202AEQQKK homodimeric link, light blue), PHB K202 homodimeric link (black), PHB2 K216-PHB K202 (orange), PHB K216-PHB K202* (gray), PHB K202-PHB K262 (yellow), PHB K202-PHB2 K262 * (dark blue), and PHB2 K89-PHB K177 (green). (C) Heatmap displaying quantified levels of 9 cross-links involving PHB and PHB2 from cells treated with PTX (5–500 nM), CA4 (5 nM), and STLC (5 μM). Values are mean log2 ratios from n = 6 replicate injections of 2 biological samples.
Figure 7.
Figure 7.. PTX Induced Changes to Hsp90
(A) Interaction network for HS90A (green) and HS90B (orange) cross-links. Edges are colored according to KML cluster (Figure S2). (B) Quantified protein abundances of HS90A (green), HS90B (orange), and Hsp71-α (HS71A, gray) versus PTX concentration (x axis). Error bars represent 95% confidence intervals from n = 6 replicate injections of 2 biological samples. (C) Heatmap of cross-links quantified from cells treated with 17-AAG, PTX, NOC, CA4, and STLC. The concentration of each drug increases from left to right. Values are mean log2 ratios from n = 6 replicate injections of 2 biological samples.

References

    1. Adamska A, Domenichini A, and Falasca M (2017). Pancreatic Ductal Adenocarcinoma: Current and Evolving Therapies. Int. J. Mol. Sci 18, E1338. - PMC - PubMed
    1. Afghani N, Mehta T, Wang J, Tang N, Skalli O, and Quick QA (2017). Microtubule actin cross-linking factor 1, a novel target in glioblastoma. Int. J. Oncol 50, 310–316. - PMC - PubMed
    1. Albrethsen J, Angeletti RH, Horwitz SB, and Yang CP (2014). Proteomics ofcancercell lines resistant to microtubule-stabilizing agents. Mol. Can-cerTher 13, 260–269. - PMC - PubMed
    1. Alushin GM, Lander GC, Kellogg EH, Zhang R, Baker D, and Nogales E (2014). High-resolution microtubule structures reveal the structural transitions in αβ-tubulin upon GTP hydrolysis. Cell 157, 1117–1129. - PMC - PubMed
    1. Ande SR, Xu YXZ, and Mishra S (2017). Prohibitin: a potential therapeutic target in tyrosine kinase signaling. Signal Transduct. Target. Ther 2, 17059. - PMC - PubMed

Publication types

Substances