

Intrinsic Functional Connectivity of the Brain in Adults with a Single Cerebral Hemisphere
- PMID: 31747608
- PMCID: PMC6914265
- DOI: 10.1016/j.celrep.2019.10.067
Intrinsic Functional Connectivity of the Brain in Adults with a Single Cerebral Hemisphere
Abstract
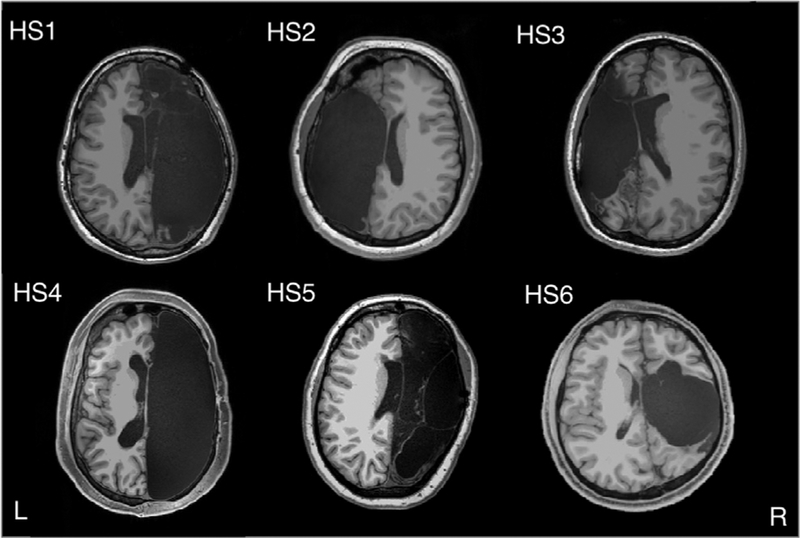
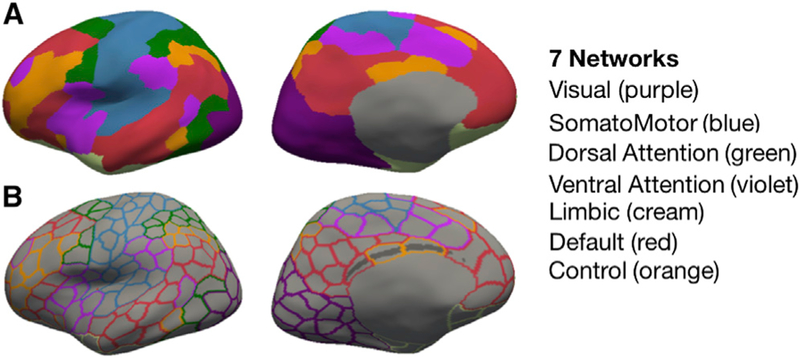
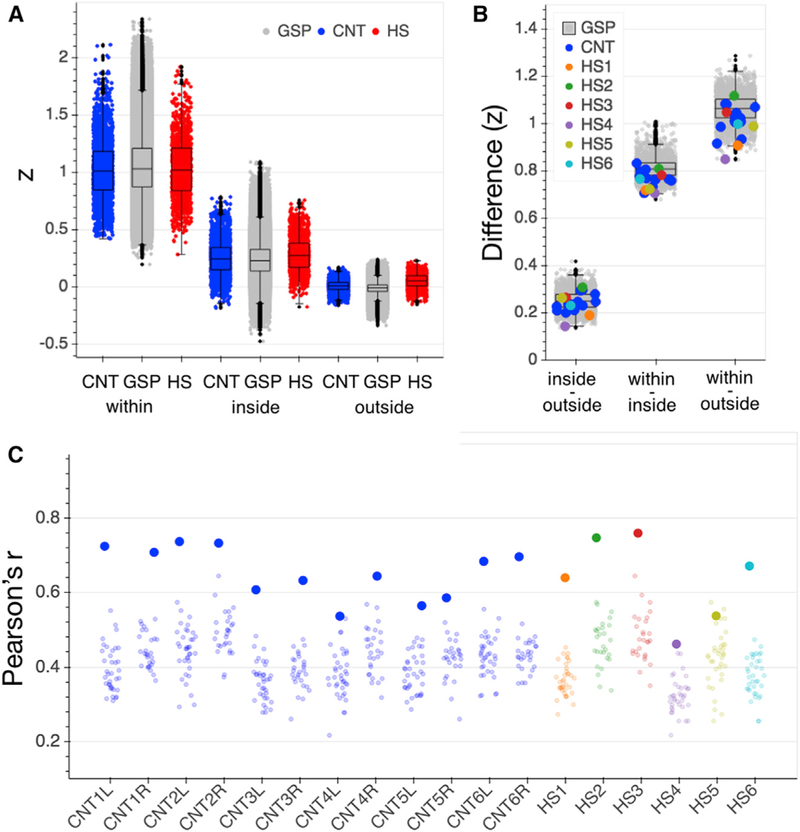
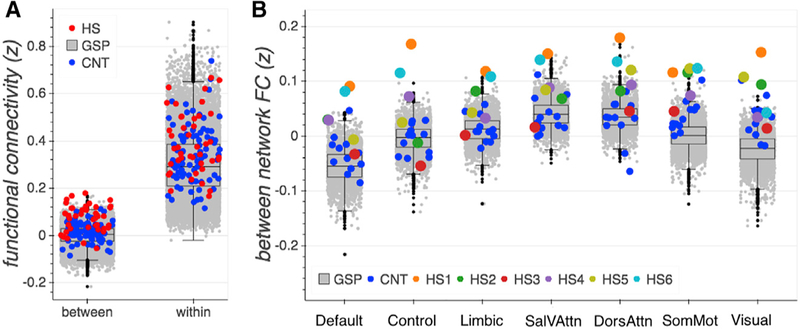
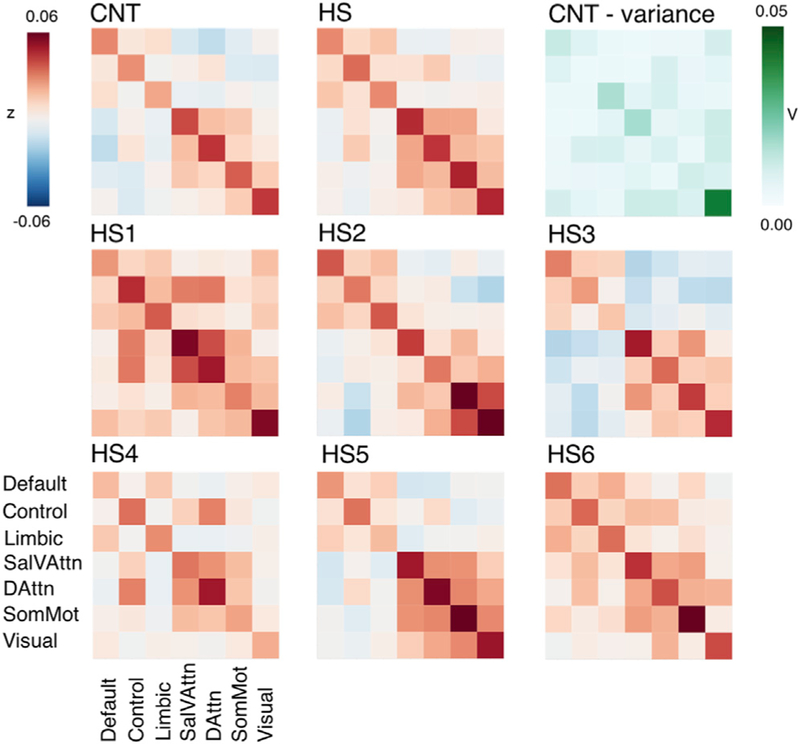
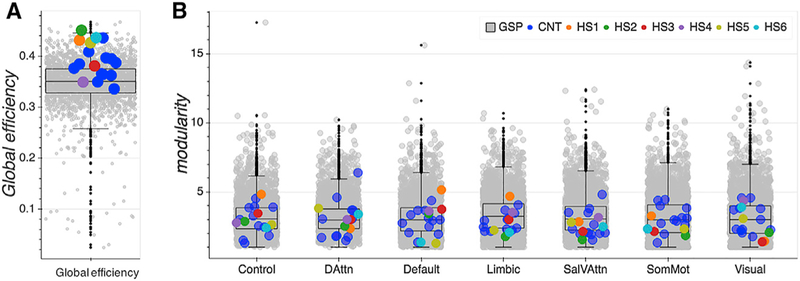
A reliable set of functional brain networks is found in healthy people and thought to underlie our cognition, emotion, and behavior. Here, we investigated these networks by quantifying intrinsic functional connectivity in six individuals who had undergone surgical removal of one hemisphere. Hemispherectomy subjects and healthy controls were scanned with identical parameters on the same scanner and compared to a large normative sample (n = 1,482). Surprisingly, hemispherectomy subjects and controls all showed strong and equivalent intrahemispheric connectivity between brain regions typically assigned to the same functional network. Connectivity between parts of different networks, however, was markedly increased for almost all hemispherectomy participants and across all networks. These results support the hypothesis of a shared set of functional networks that underlie cognition and suggest that between-network interactions may characterize functional reorganization in hemispherectomy.
Keywords: brain networks; fMRI; functional connectivity; hemispherectomy; plasticity.
Copyright © 2019 The Authors. Published by Elsevier Inc. All rights reserved.
Conflict of interest statement
DECLARATION OF INTERESTS
B.F. has a financial interest in CorticoMetrics, a company whose medical pursuits focus on brain imaging and measurement technologies. B.F.’s interests were reviewed and are managed by Massachusetts General Hospital and Partners HealthCare in accordance with their conflict of interest policies. All other authors declare no competing interests.
Figures
Comment in
-
Letter: Elucidating the Principles of Brain Network Organization Through Neurosurgery.Neurosurgery. 2020 Jul 1;87(1):E80-E81. doi: 10.1093/neuros/nyaa094. Neurosurgery. 2020. PMID: 32315411 No abstract available.
-
Functional connectivity after hemispherectomy.Quant Imaging Med Surg. 2020 May;10(5):1174-1178. doi: 10.21037/qims.2020.03.17. Quant Imaging Med Surg. 2020. PMID: 32489942 Free PMC article. No abstract available.
-
Stability and plasticity of functional brain networks after hemispherectomy: implications for consciousness research.Quant Imaging Med Surg. 2020 Jun;10(6):1408-1412. doi: 10.21037/qims-20-554. Quant Imaging Med Surg. 2020. PMID: 32550146 Free PMC article. No abstract available.
References
-
- Andersson JL, Skare S, and Ashburner J (2003). How to correct susceptibility distortions in spin-echo echo-planar images: application to diffusion tensor imaging. Neuroimage 20, 870–888. - PubMed
-
- Arslan S, Ktena SI, Makropoulos A, Robinson EC, Rueckert D, and Parisot S (2018). Human brain mapping: A systematic comparison of parcellation methods for the human cerebral cortex. Neuroimage 170, 5–30. - PubMed
-
- Bernasconi A, Bernasconi N, Lassonde M, Toussaint PJ, Meyer E, Reutens DC, Gotman J, Andermann F, and Villemure JG (2000). Sensorimotor organization in patients who have undergone hemispherectomy: a study with (15)O-water PET and somatosensory evoked potentials. Neurore-port 11, 3085–3090. - PubMed
-
- Biswal B, Yetkin FZ, Haughton VM, and Hyde JS (1995). Functional connectivity in the motor cortex of resting human brain using echo-planar MRI. Magn. Reson. Med 34, 537–541. - PubMed
-
- Bittar RG, Ptito A, and Reutens DC (2000). Somatosensory representation in patients who have undergone hemispherectomy: a functional magnetic resonance imaging study. J. Neurosurg 92, 45–51. - PubMed
Publication types
MeSH terms
Grants and funding
- P50 MH094258/MH/NIMH NIH HHS/United States
- R21 EB018907/EB/NIBIB NIH HHS/United States
- R01 AG016495/AG/NIA NIH HHS/United States
- S10 RR019307/RR/NCRR NIH HHS/United States
- R01 NS052585/NS/NINDS NIH HHS/United States
- R01 NS105820/NS/NINDS NIH HHS/United States
- R01 EB023281/EB/NIBIB NIH HHS/United States
- R01 AG008122/AG/NIA NIH HHS/United States
- R01 EB019956/EB/NIBIB NIH HHS/United States
- P30 AG066546/AG/NIA NIH HHS/United States
- R56 AG064027/AG/NIA NIH HHS/United States
- S10 RR023043/RR/NCRR NIH HHS/United States
- R01 EB006758/EB/NIBIB NIH HHS/United States
- R01 NS070963/NS/NINDS NIH HHS/United States
- U01 NS086625/NS/NINDS NIH HHS/United States
- U01 MH117023/MH/NIMH NIH HHS/United States
- R21 NS072652/NS/NINDS NIH HHS/United States
- P41 EB015896/EB/NIBIB NIH HHS/United States
- R01 NS083534/NS/NINDS NIH HHS/United States
- S10 RR023401/RR/NCRR NIH HHS/United States
LinkOut - more resources
Full Text Sources
Other Literature Sources
