. 2019 Dec;576(7787):459-464.
doi: 10.1038/s41586-019-1791-1. Epub 2019 Nov 20.

A new antibiotic selectively kills Gram-negative pathogens

Affiliations

A new antibiotic selectively kills Gram-negative pathogens

Yu Imai et al. Nature. 2019 Dec.

Erratum in

  • Author Correction: A new antibiotic selectively kills Gram-negative pathogens.
    Imai Y, Meyer KJ, Iinishi A, Favre-Godal Q, Green R, Manuse S, Caboni M, Mori M, Niles S, Ghiglieri M, Honrao C, Ma X, Guo JJ, Makriyannis A, Linares-Otoya L, Böhringer N, Wuisan ZG, Kaur H, Wu R, Mateus A, Typas A, Savitski MM, Espinoza JL, O'Rourke A, Nelson KE, Hiller S, Noinaj N, Schäberle TF, D'Onofrio A, Lewis K. Imai Y, et al. Nature. 2020 Apr;580(7802):E3. doi: 10.1038/s41586-020-2063-9. Nature. 2020. PMID: 32269338

Abstract

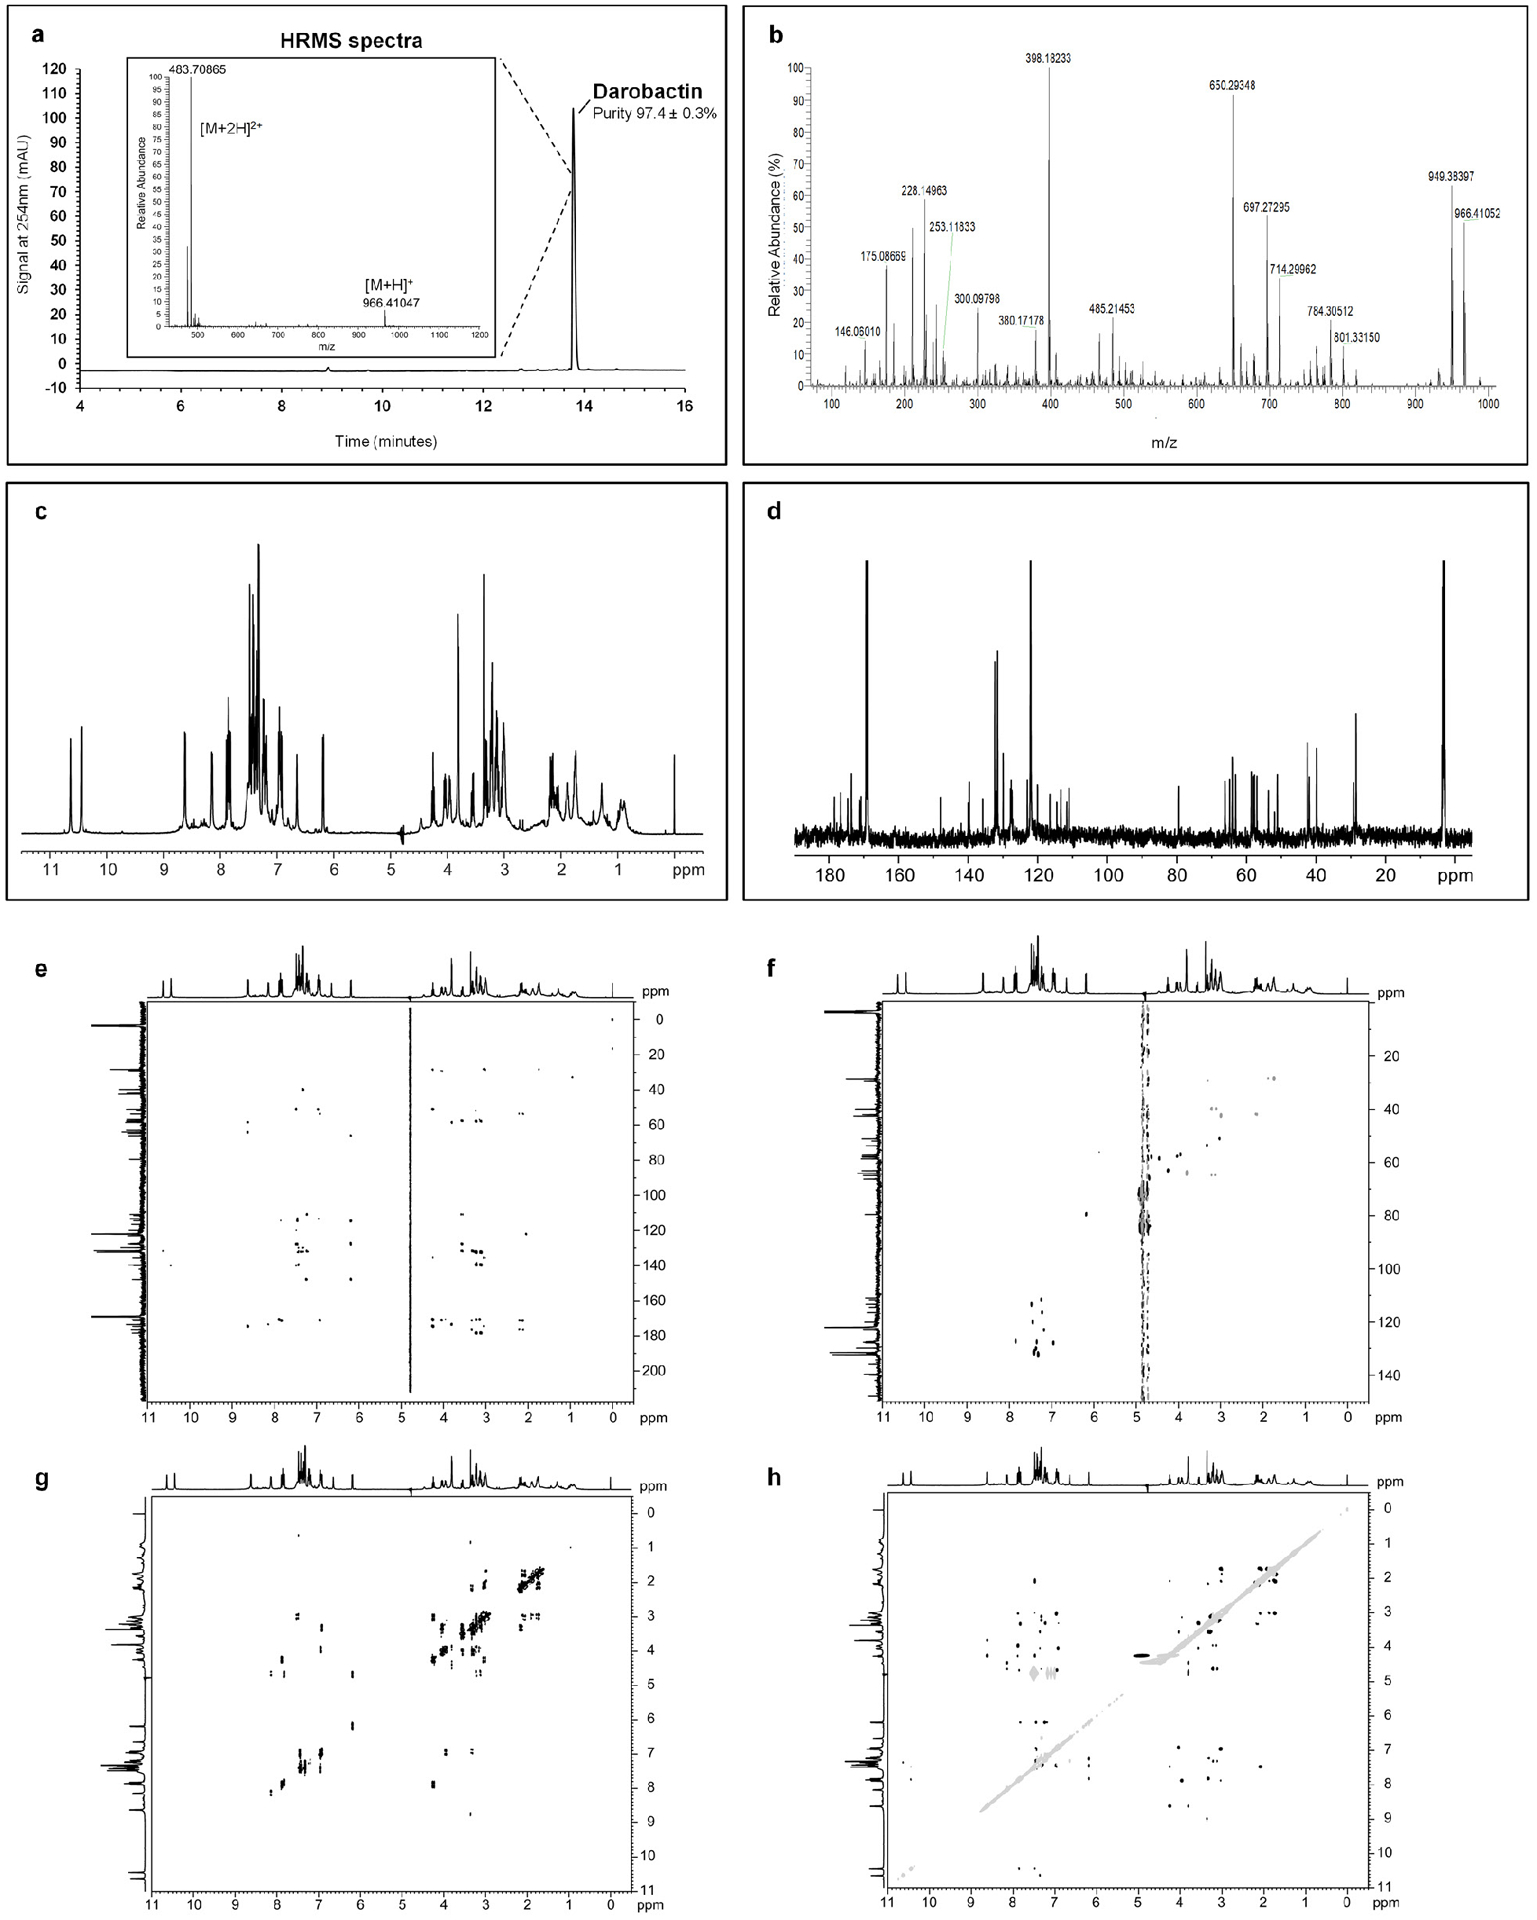
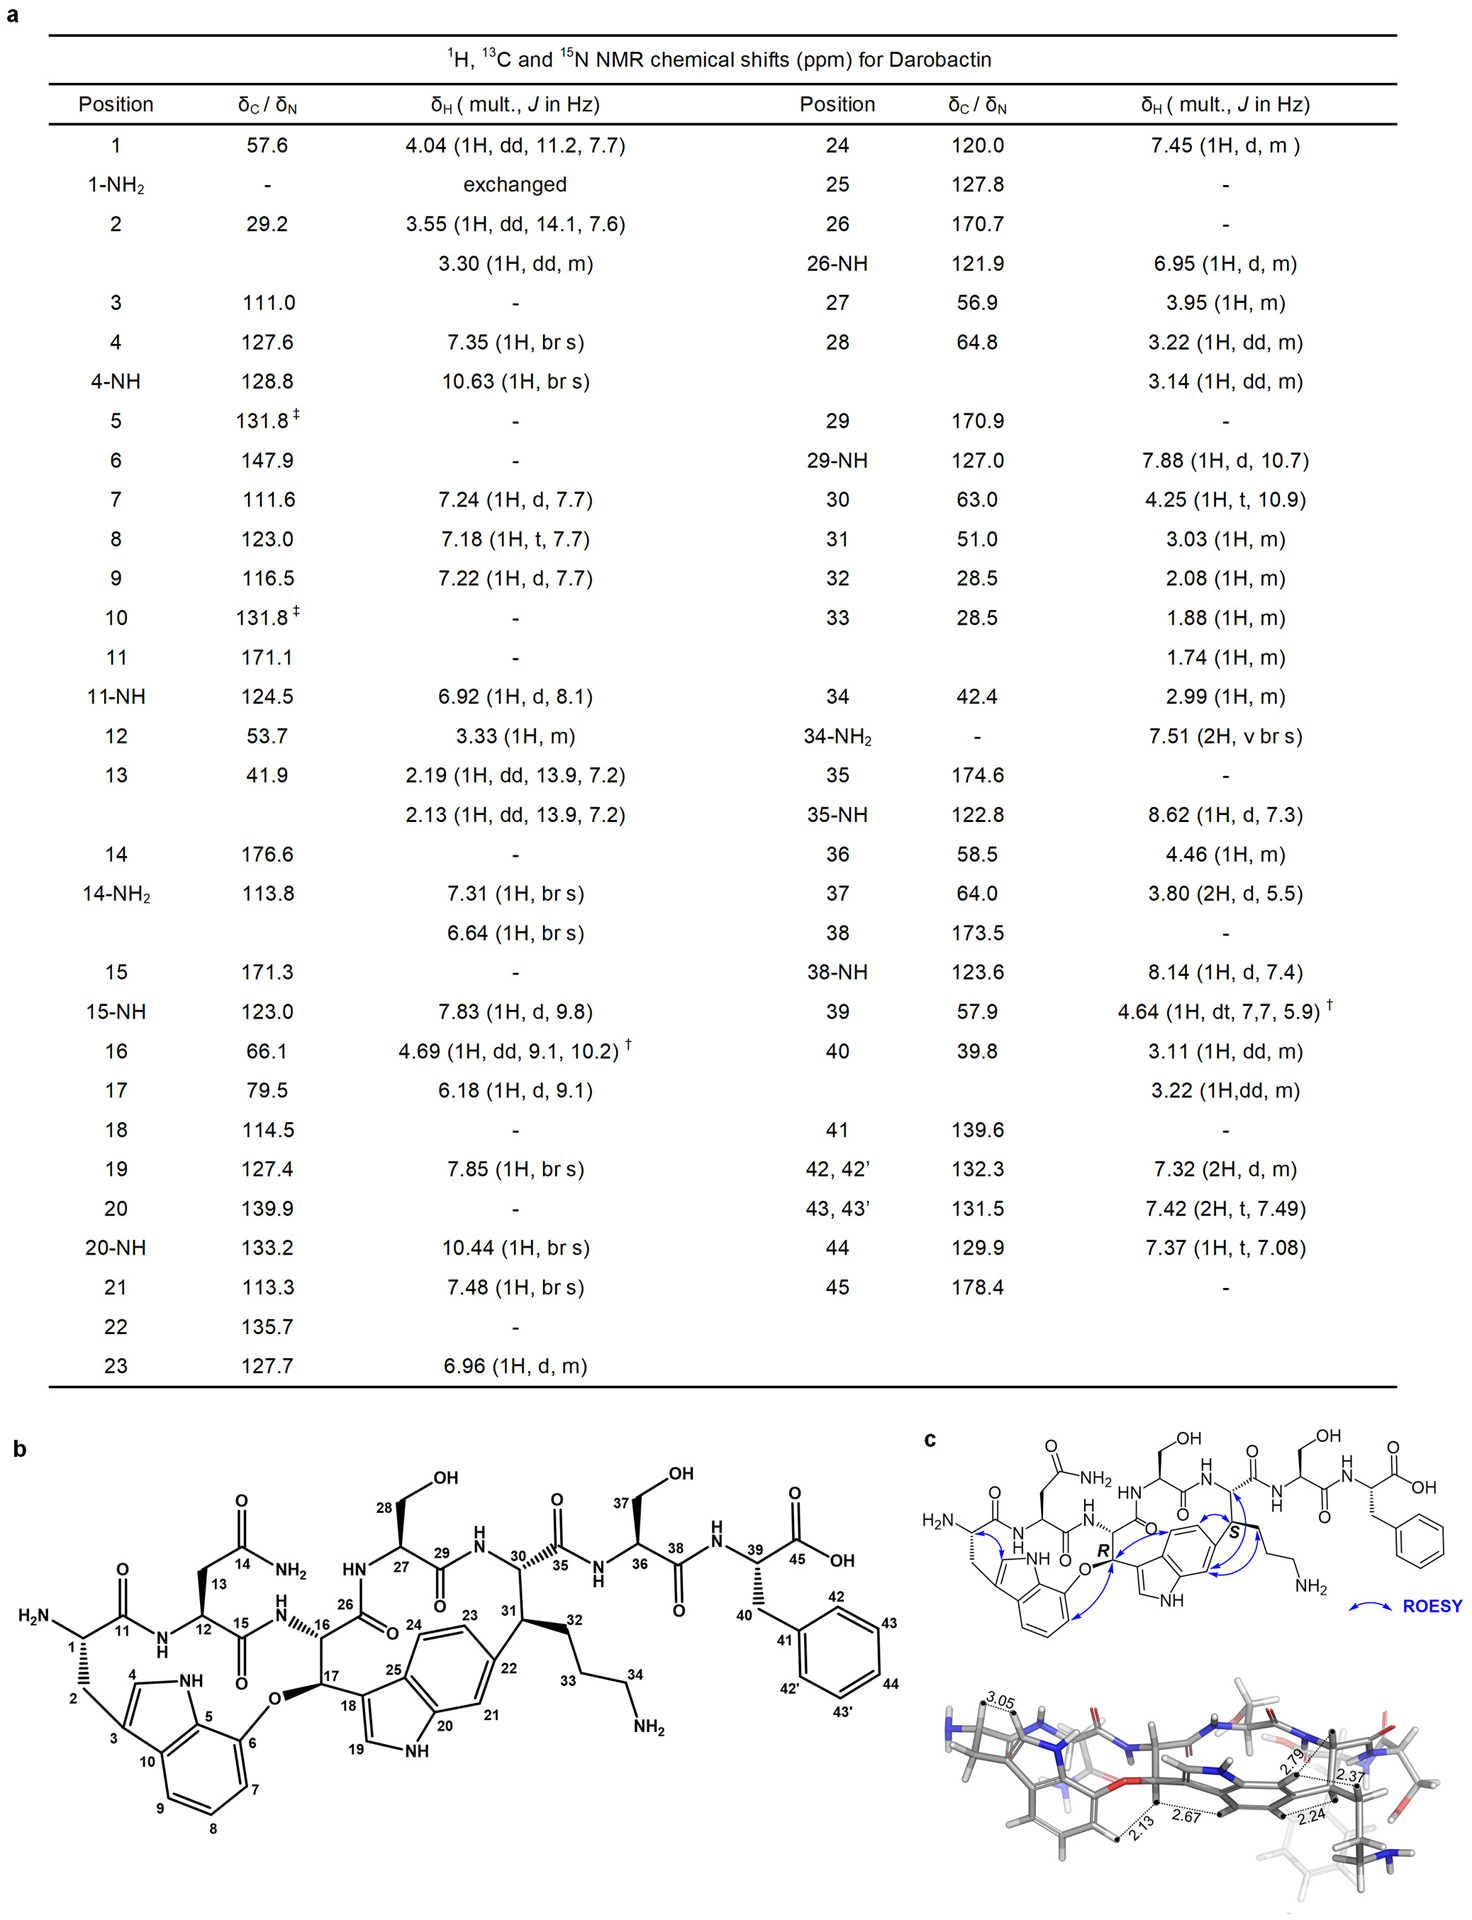
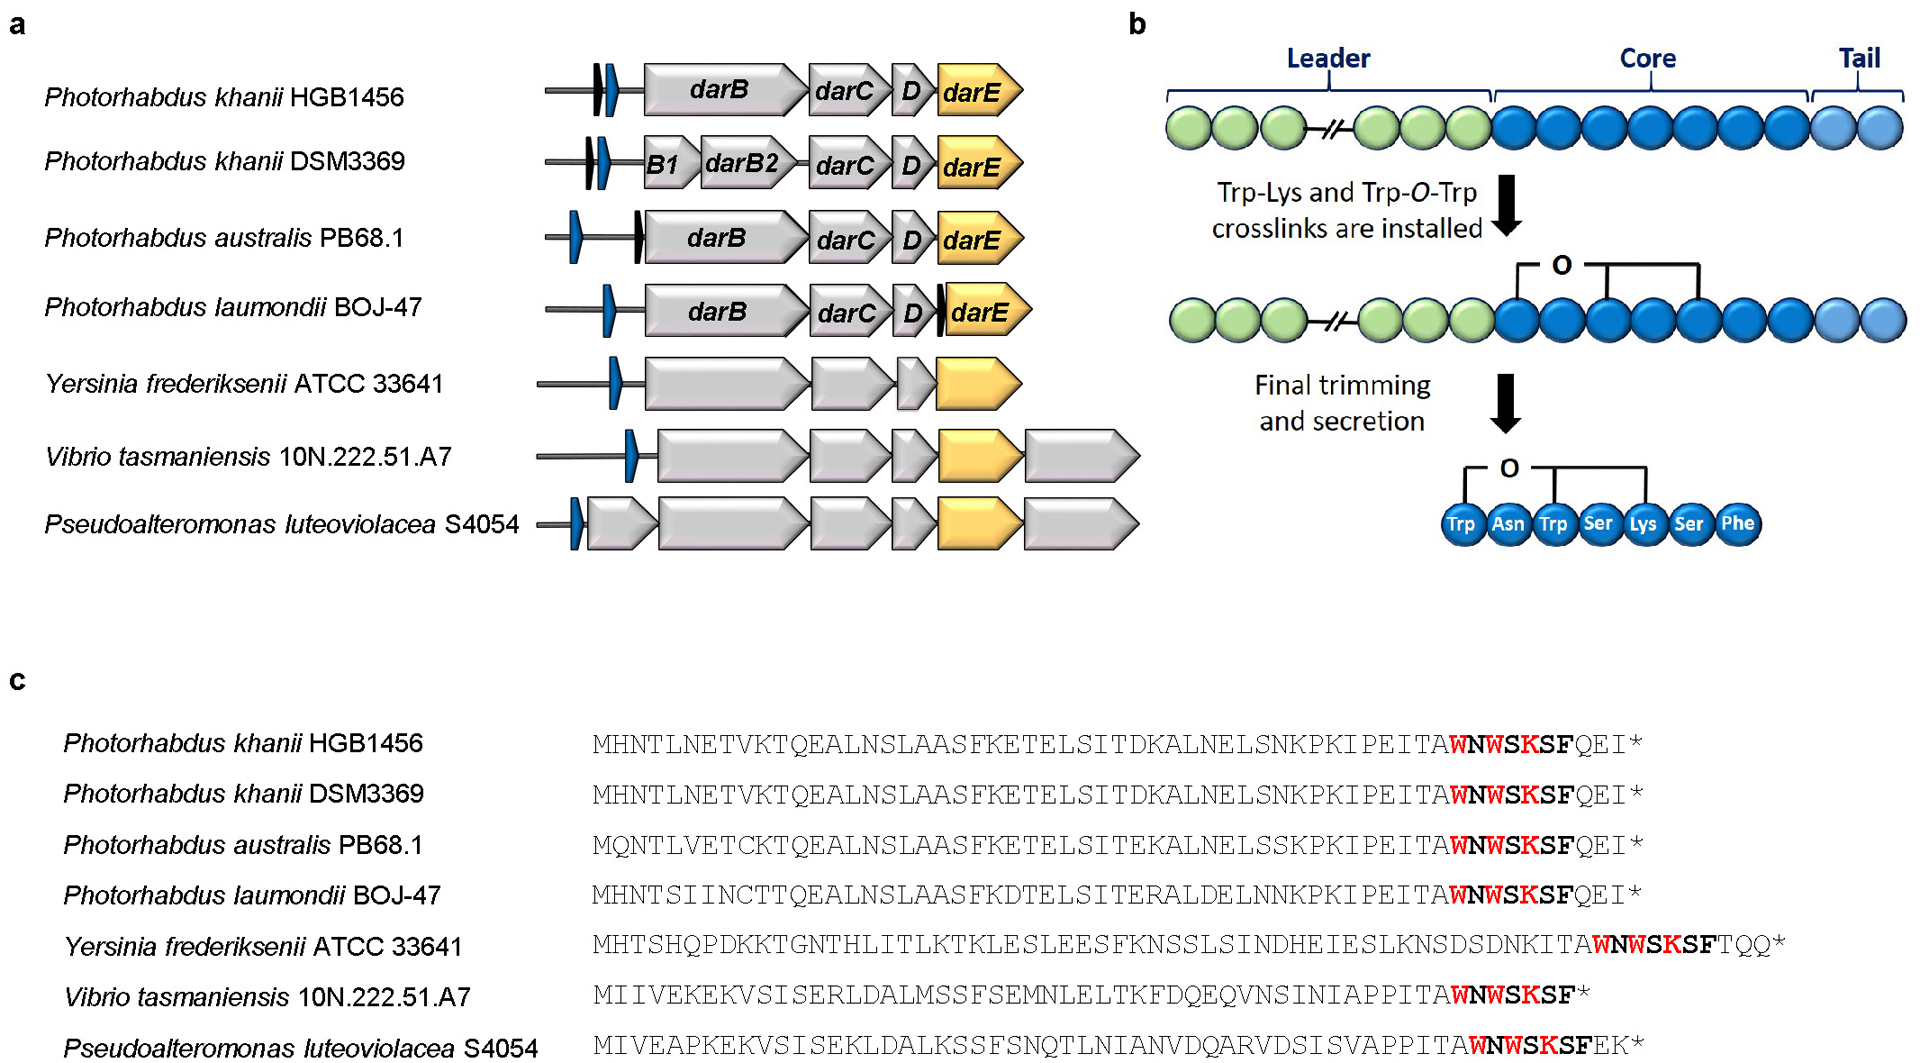
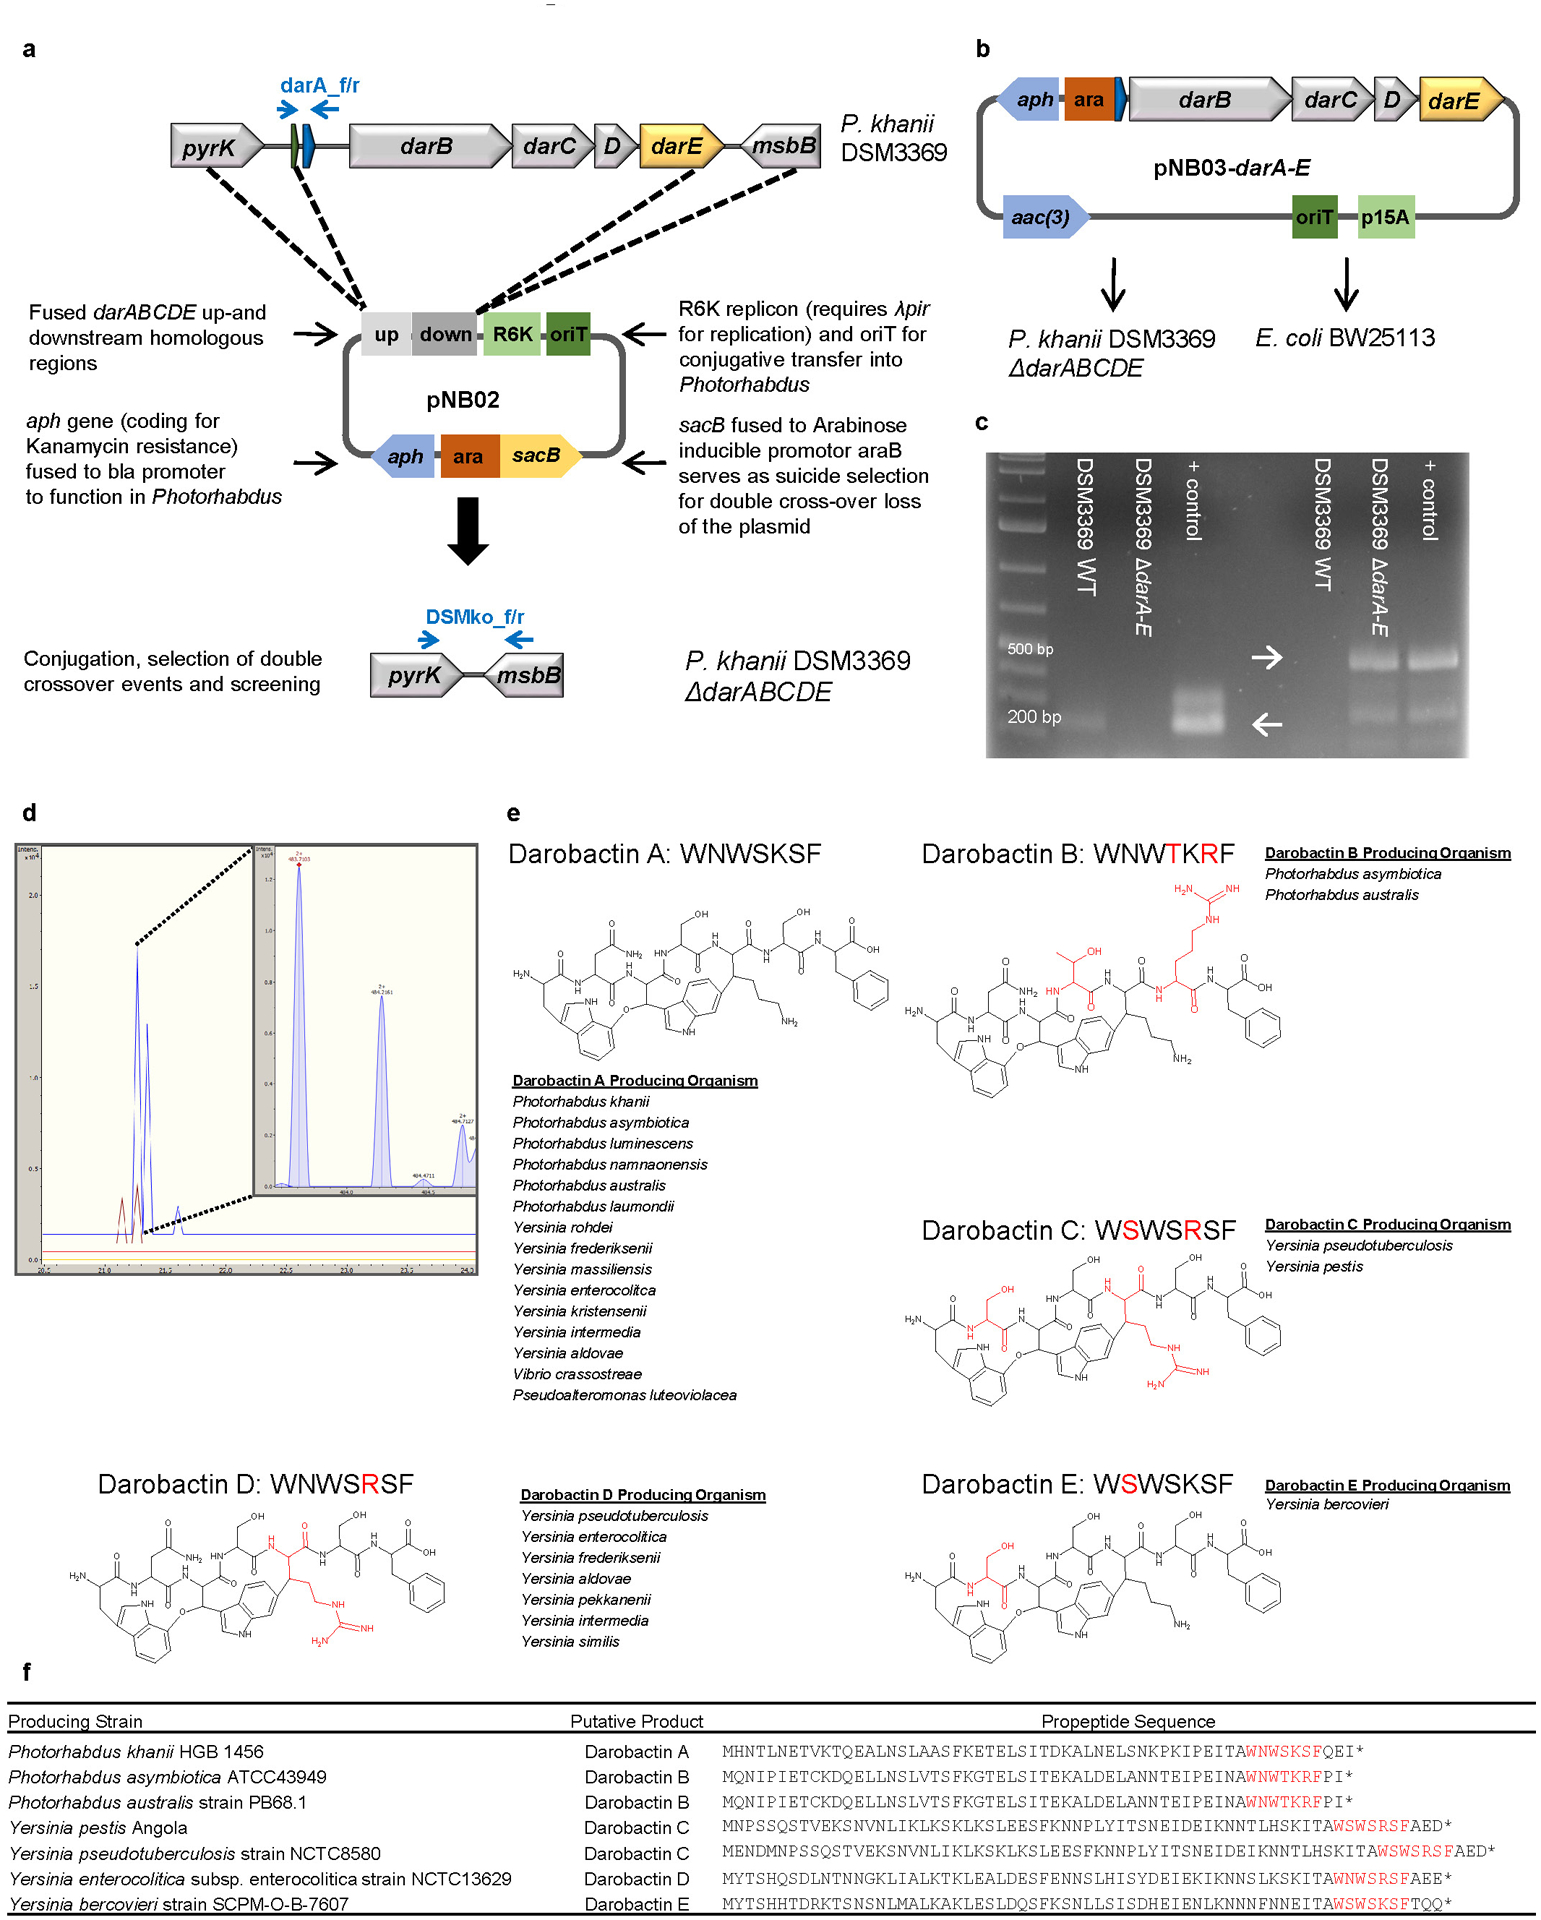
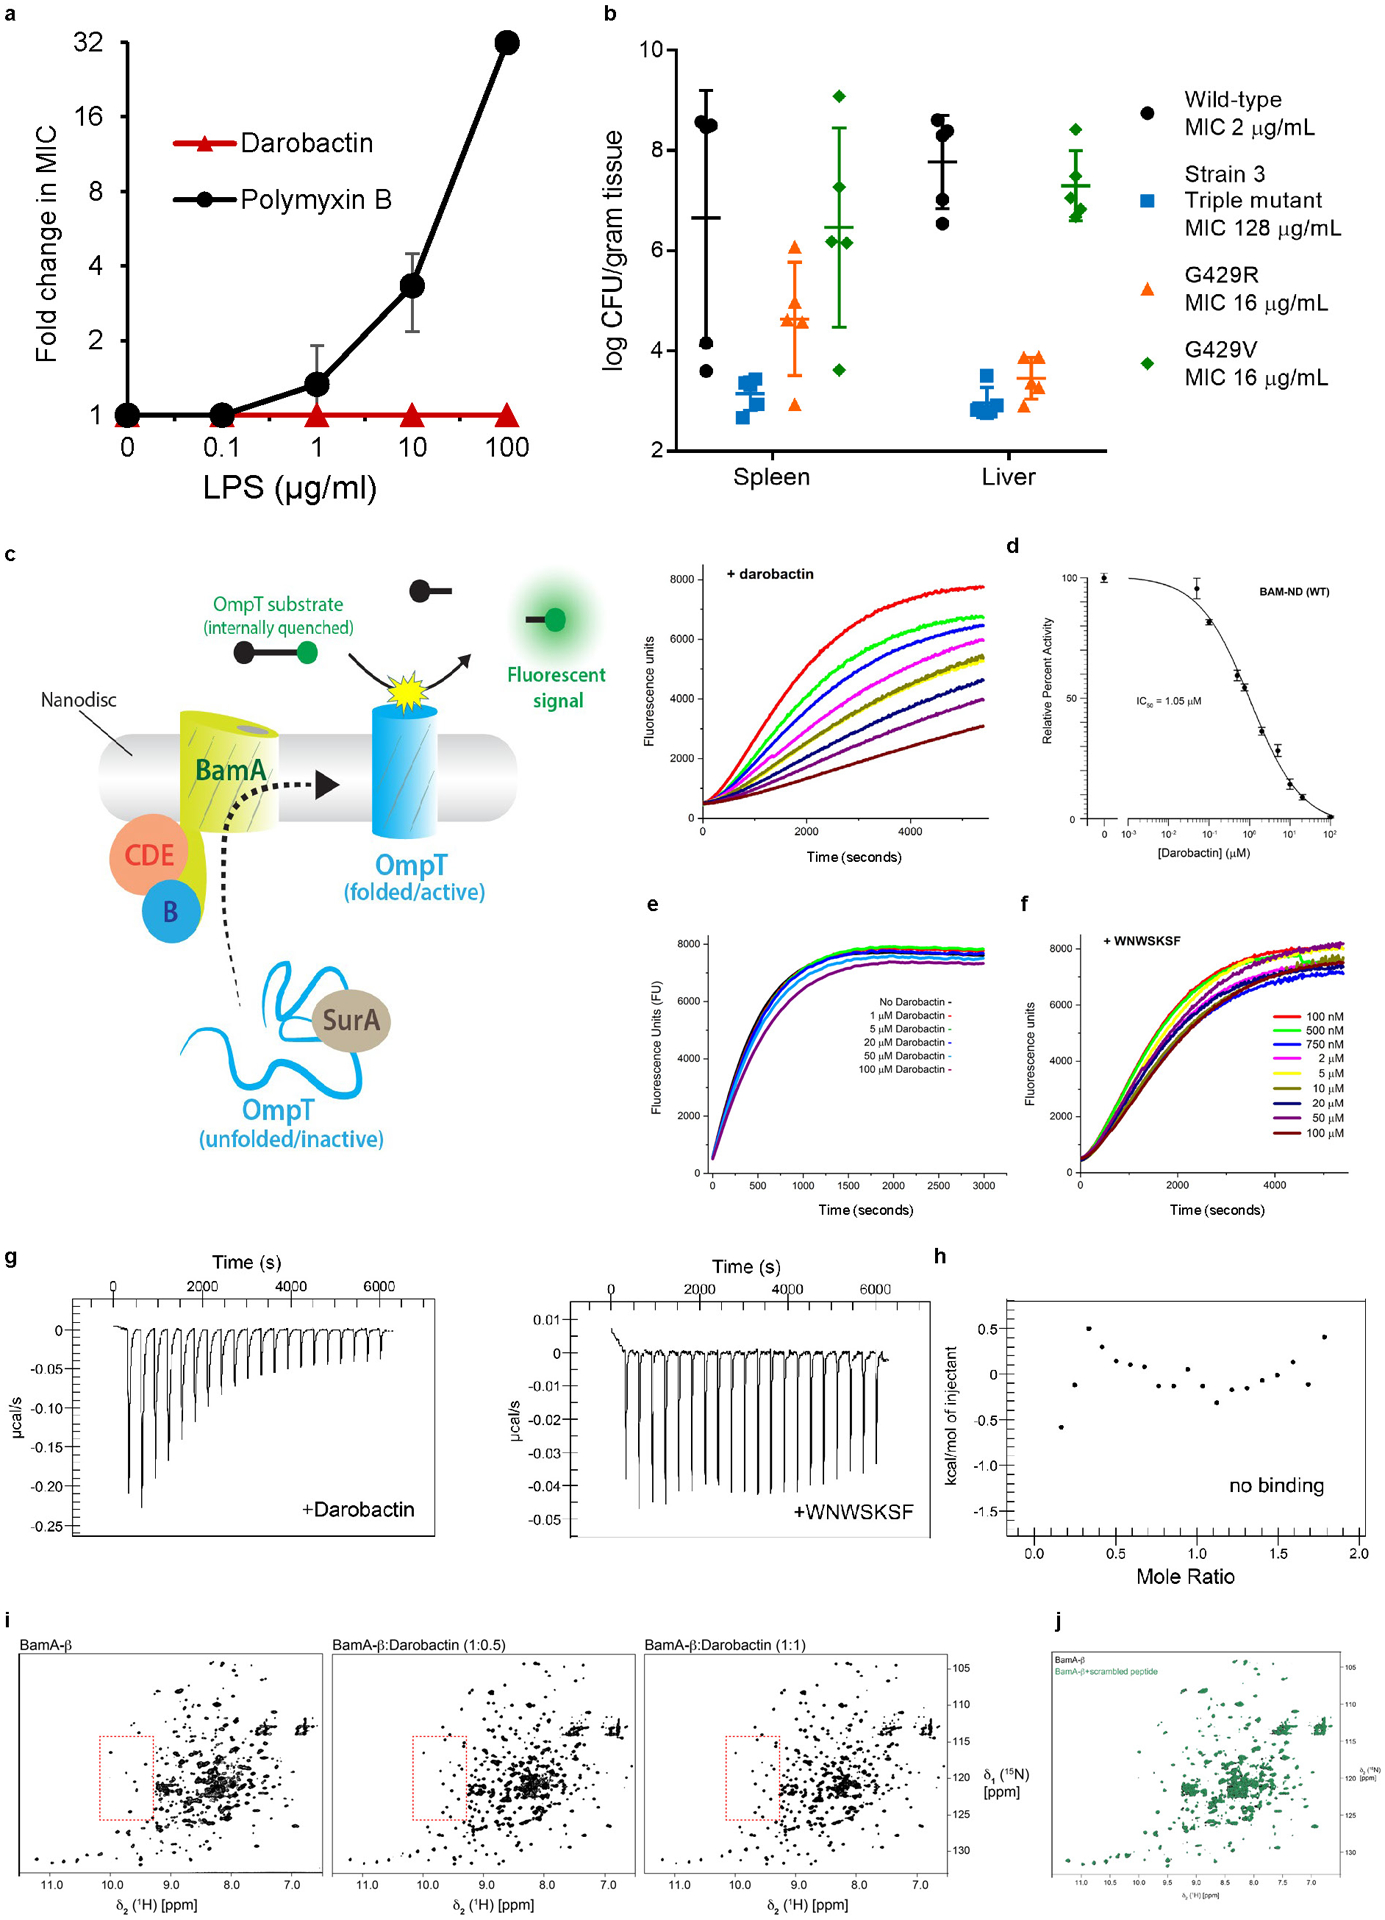
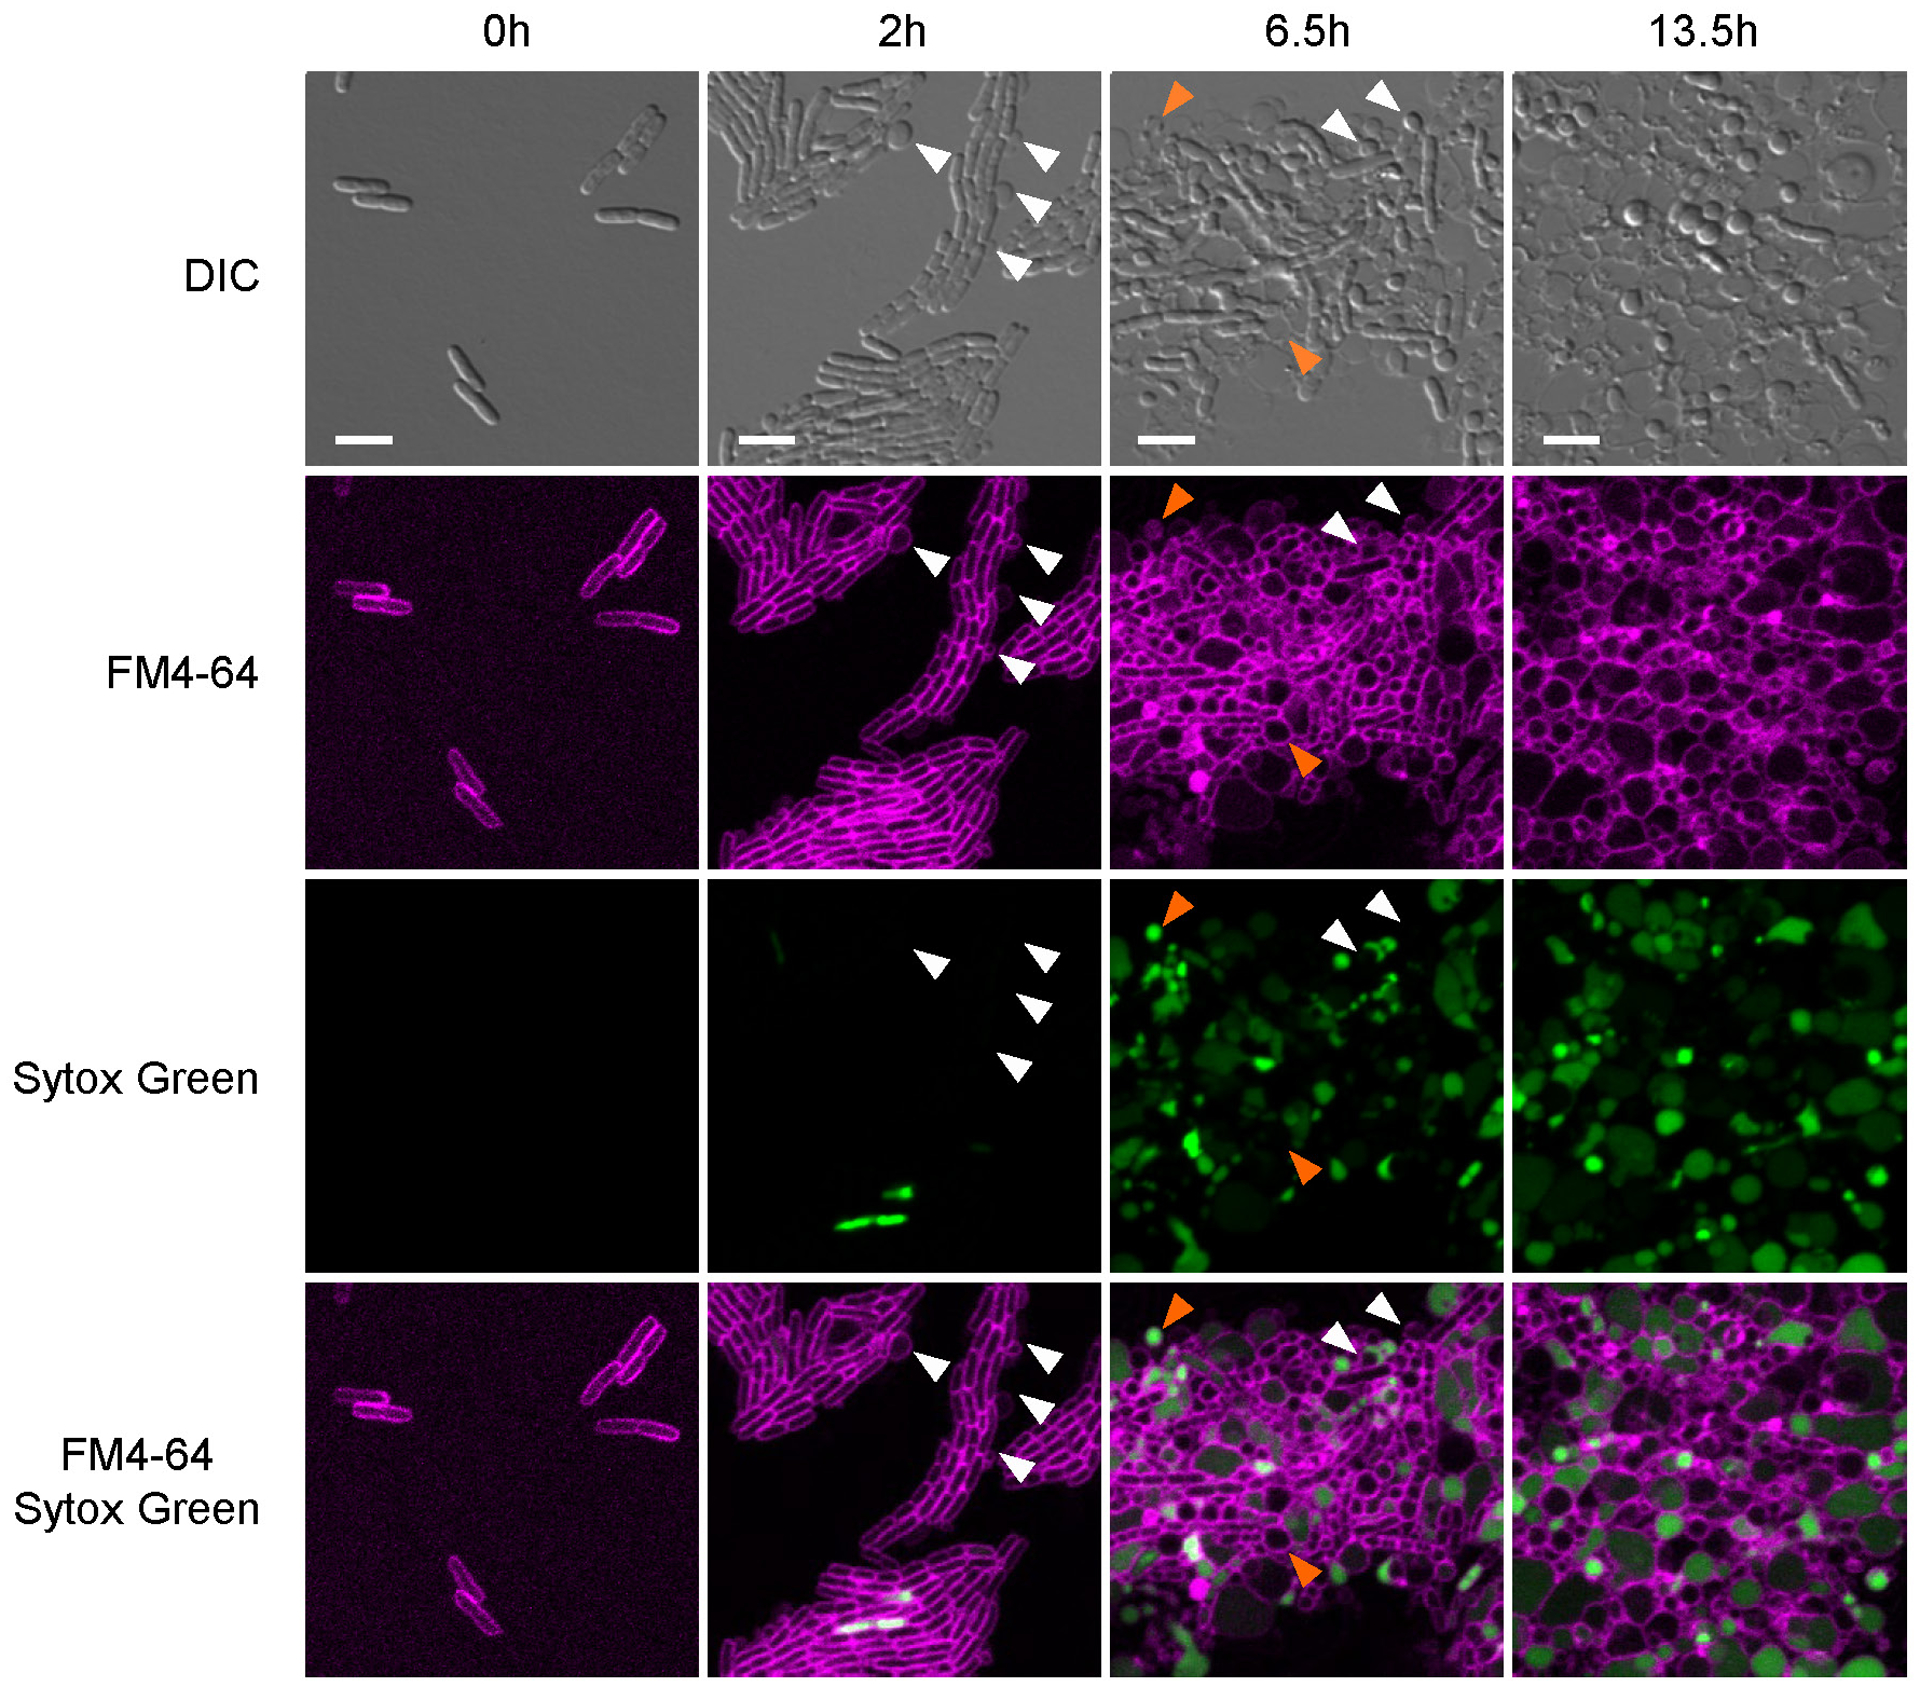
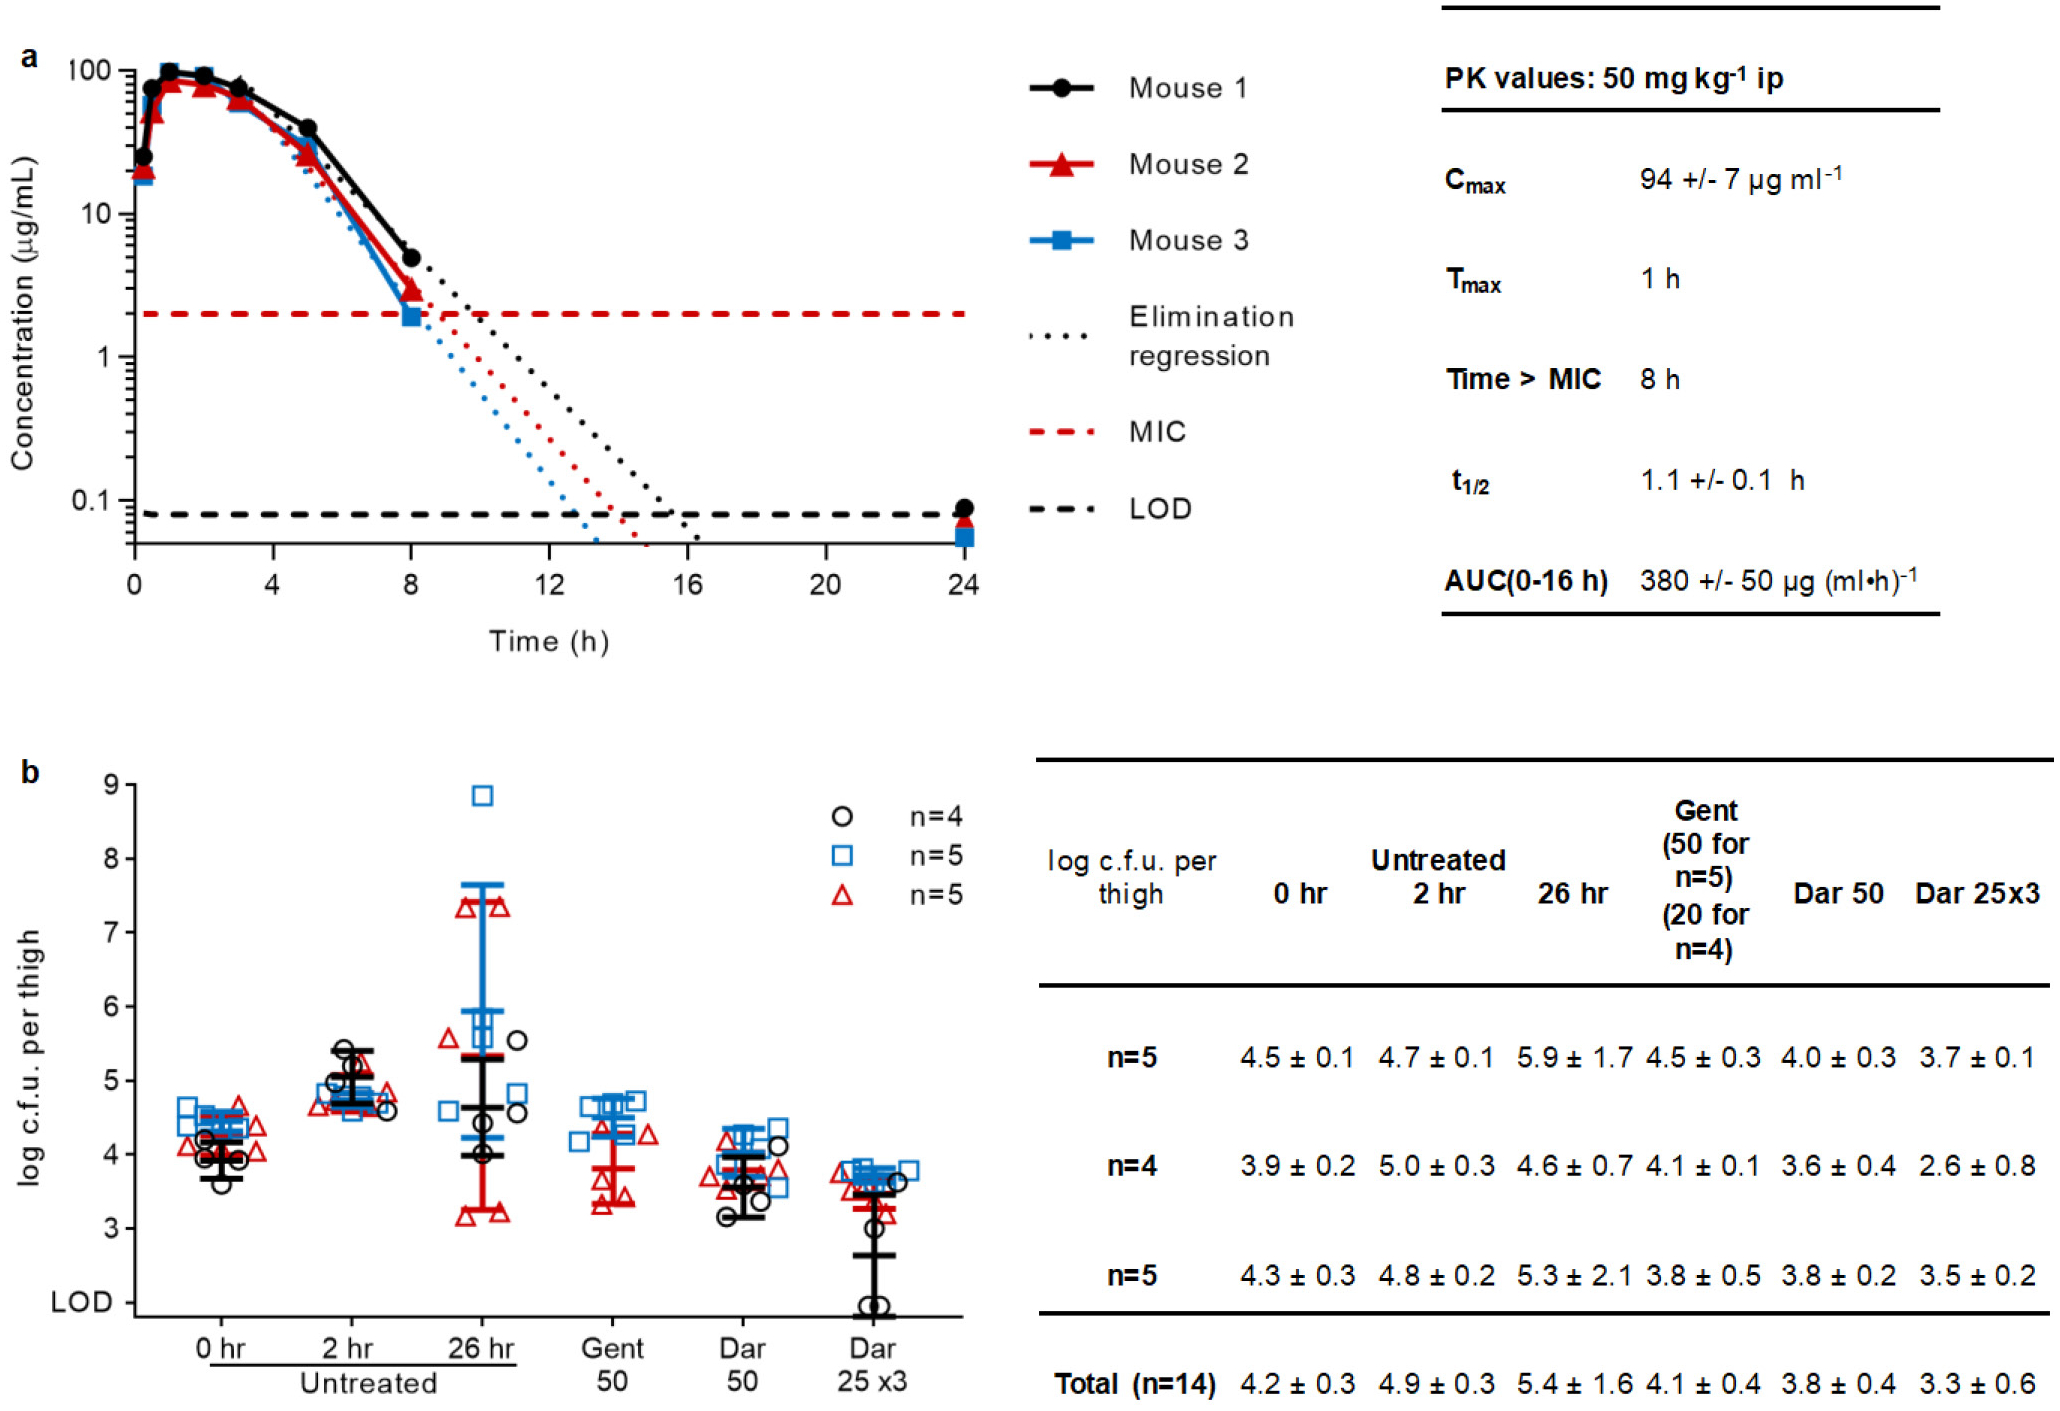
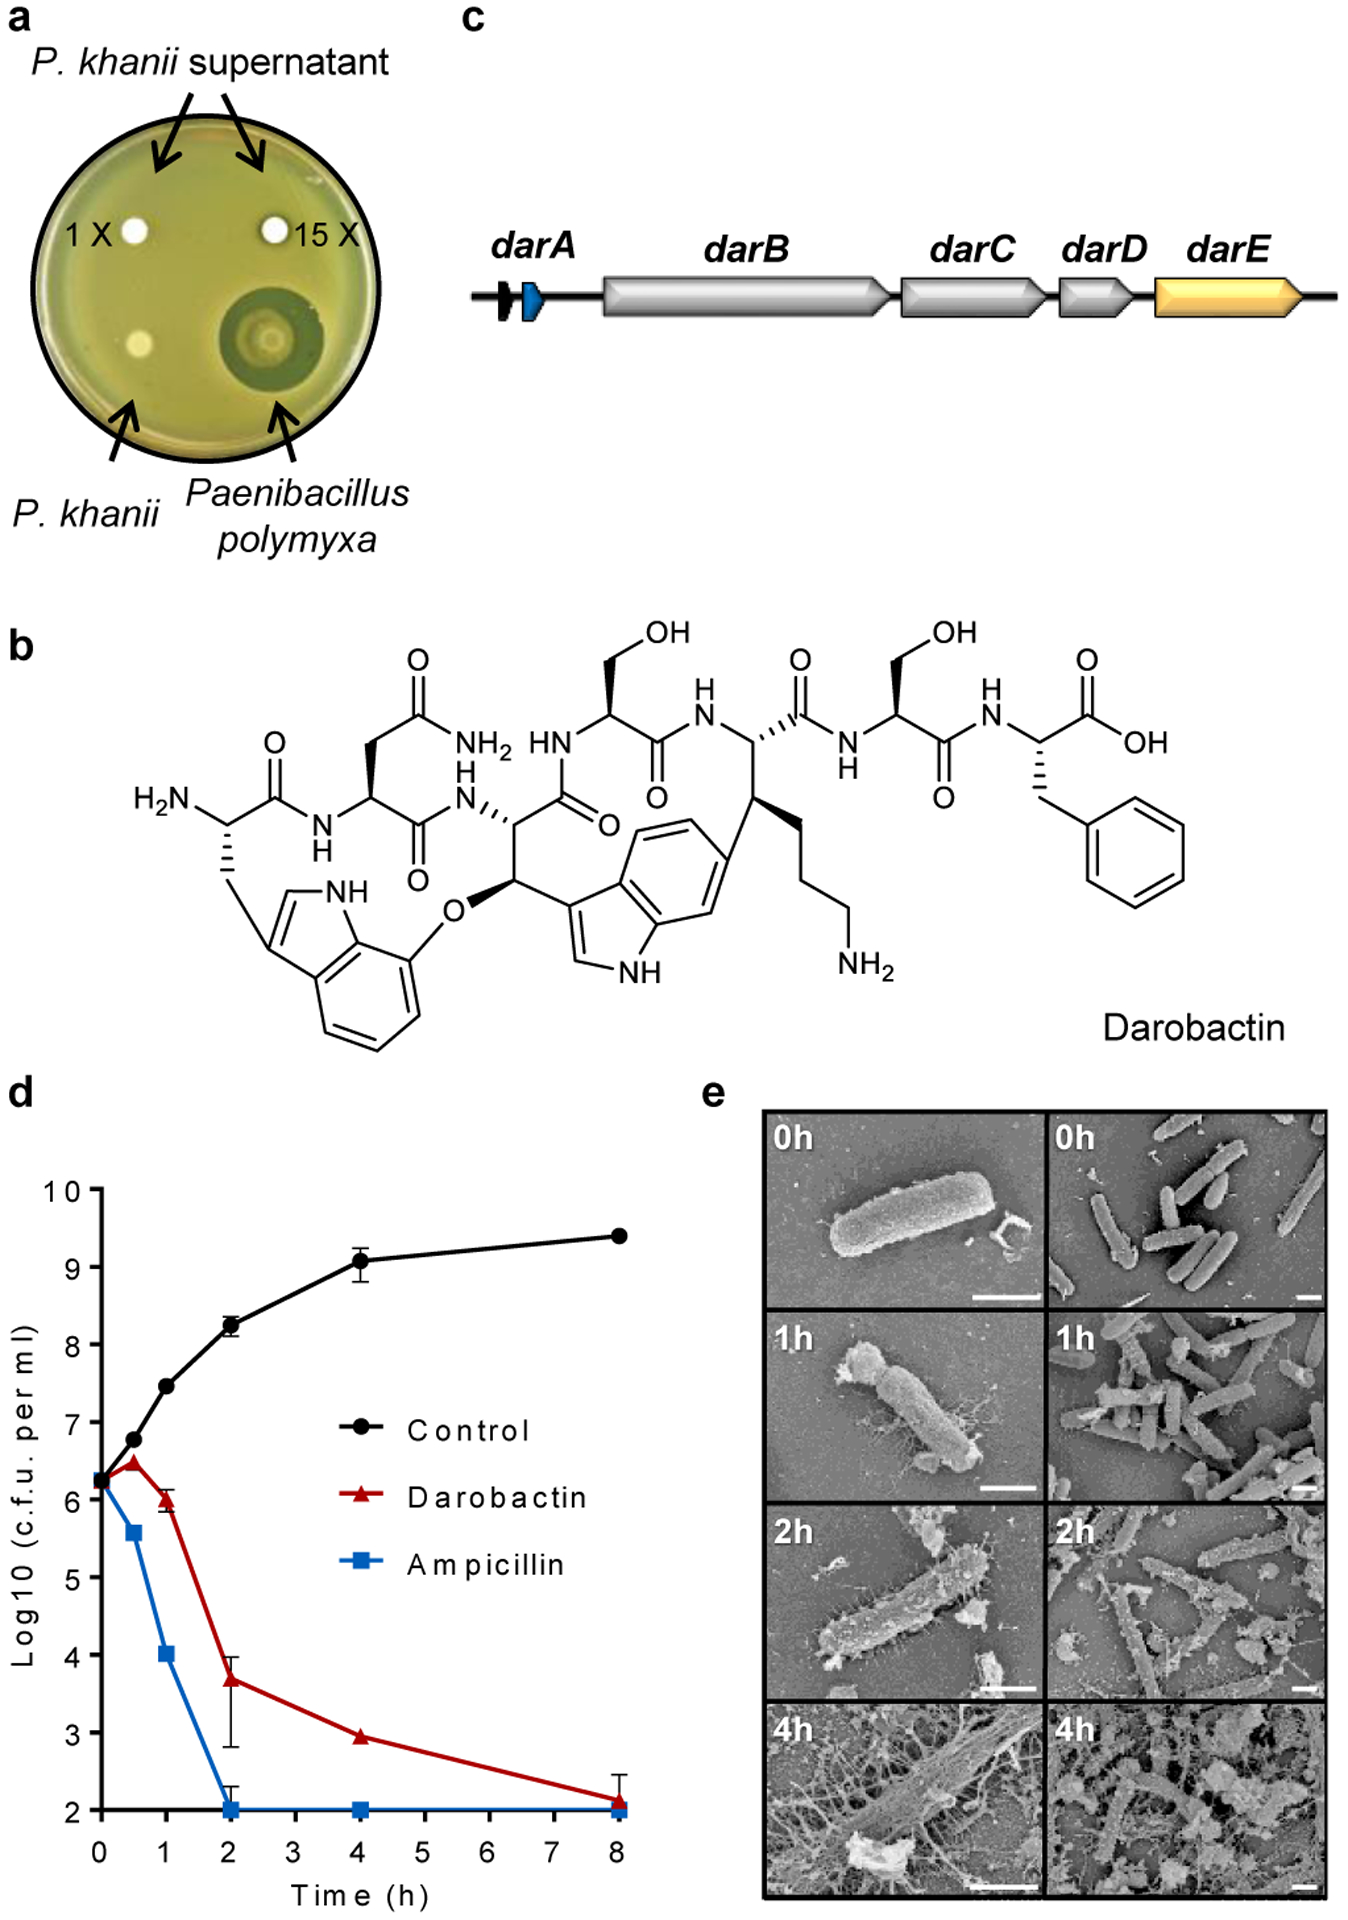
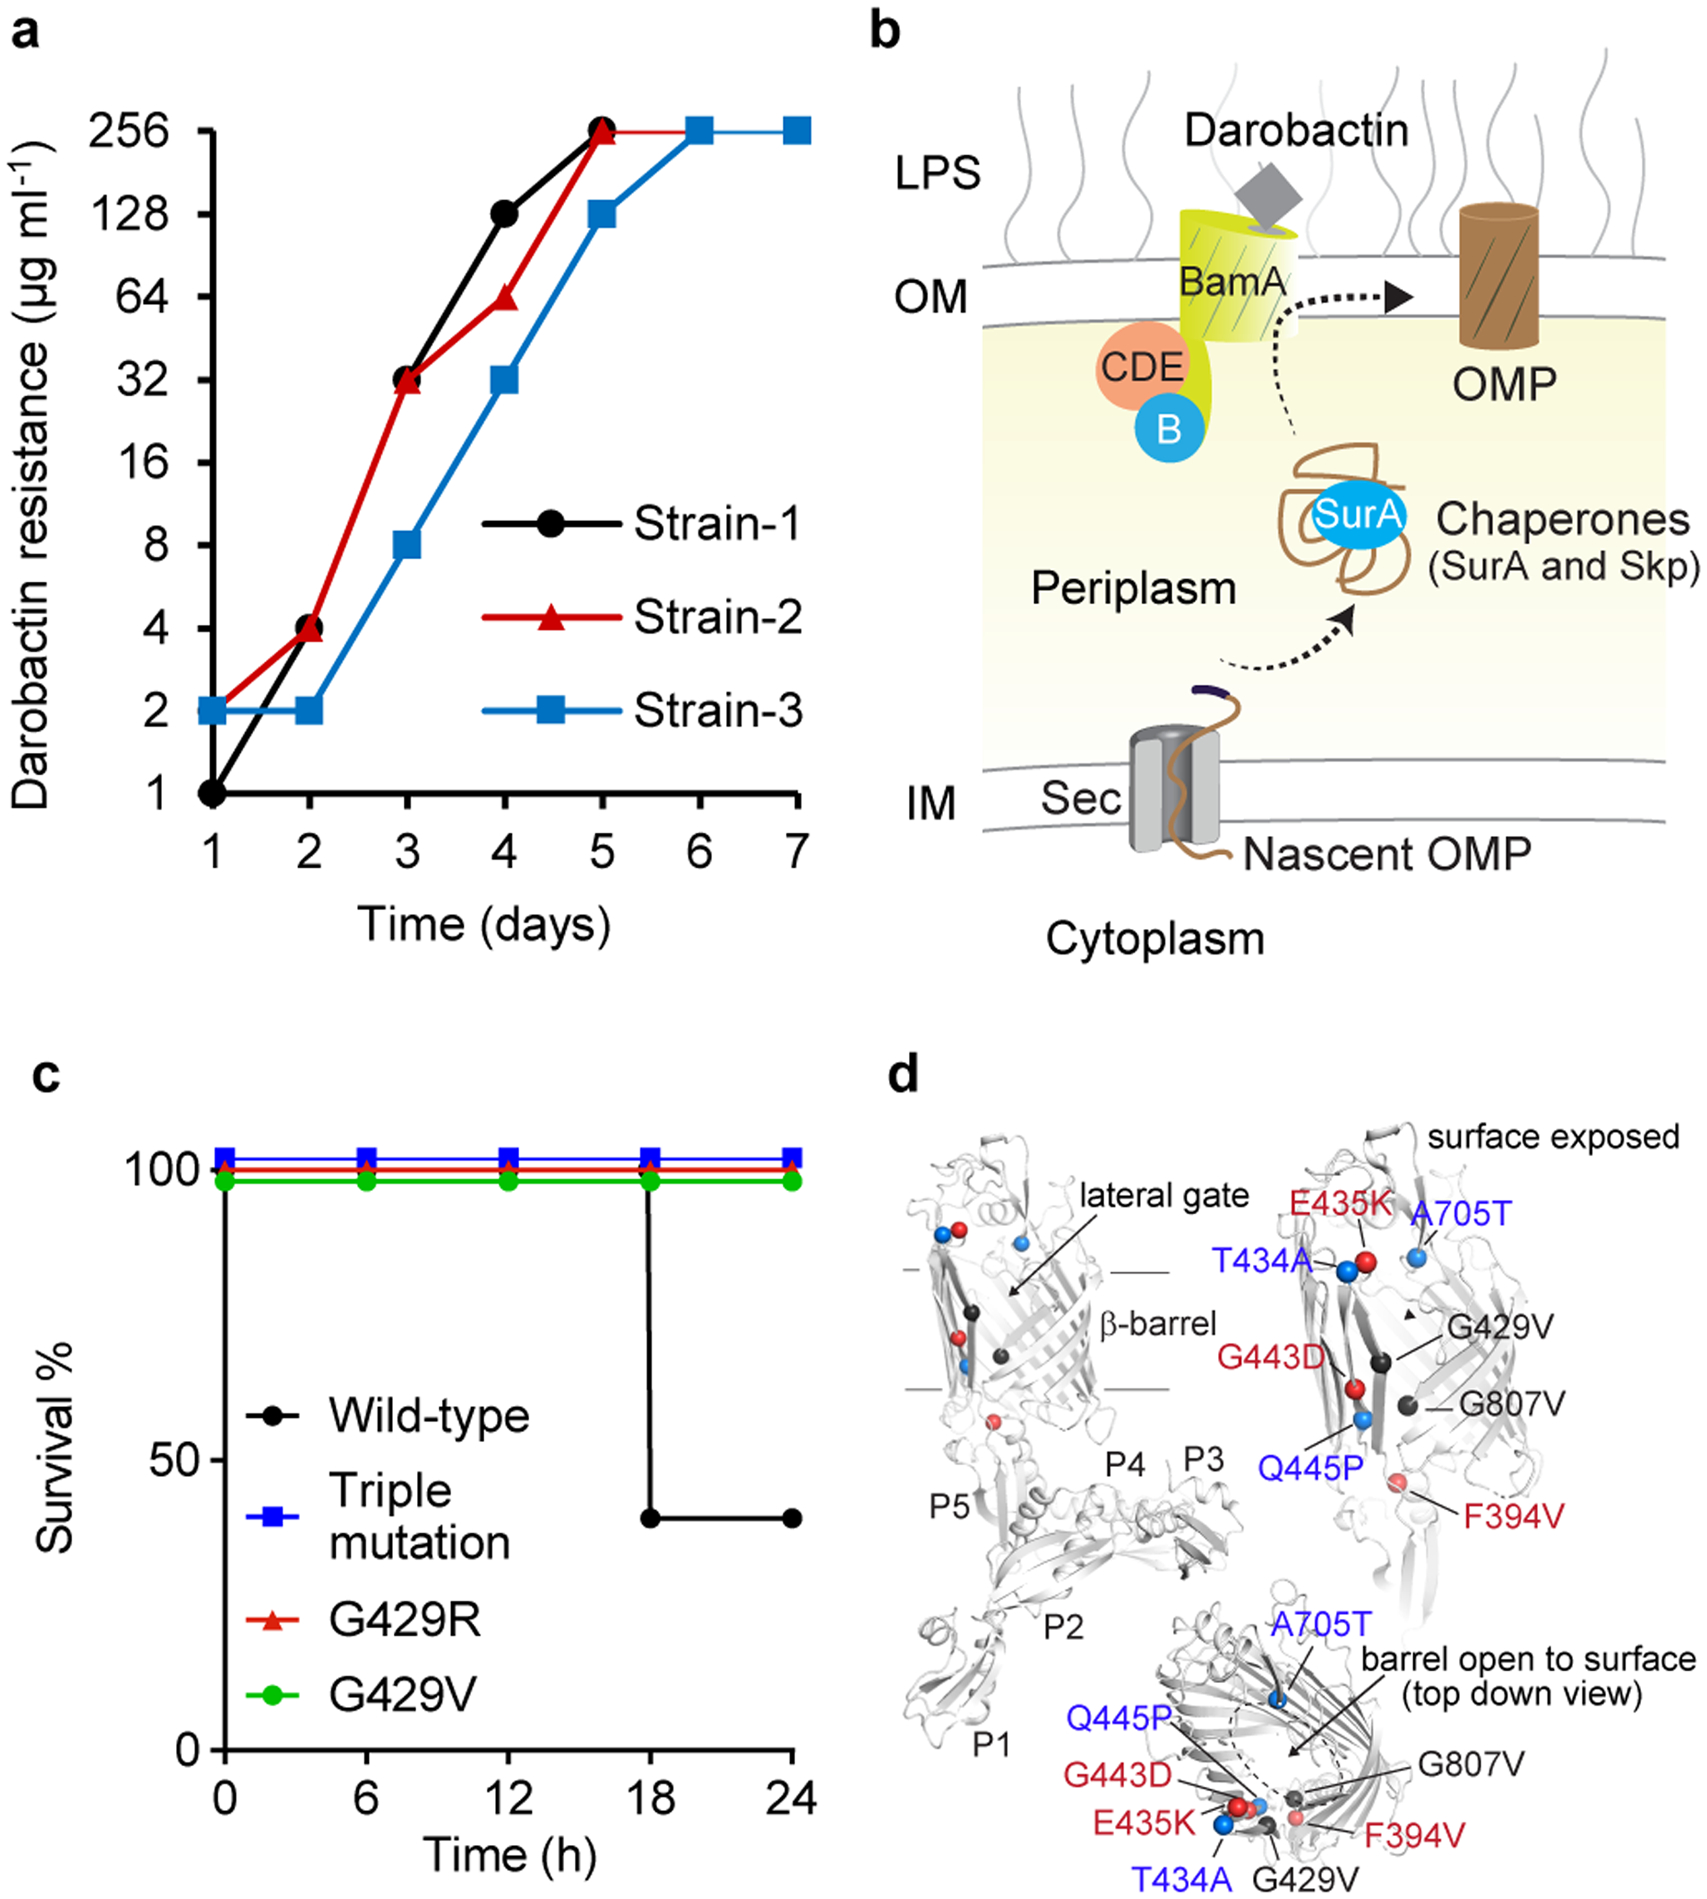
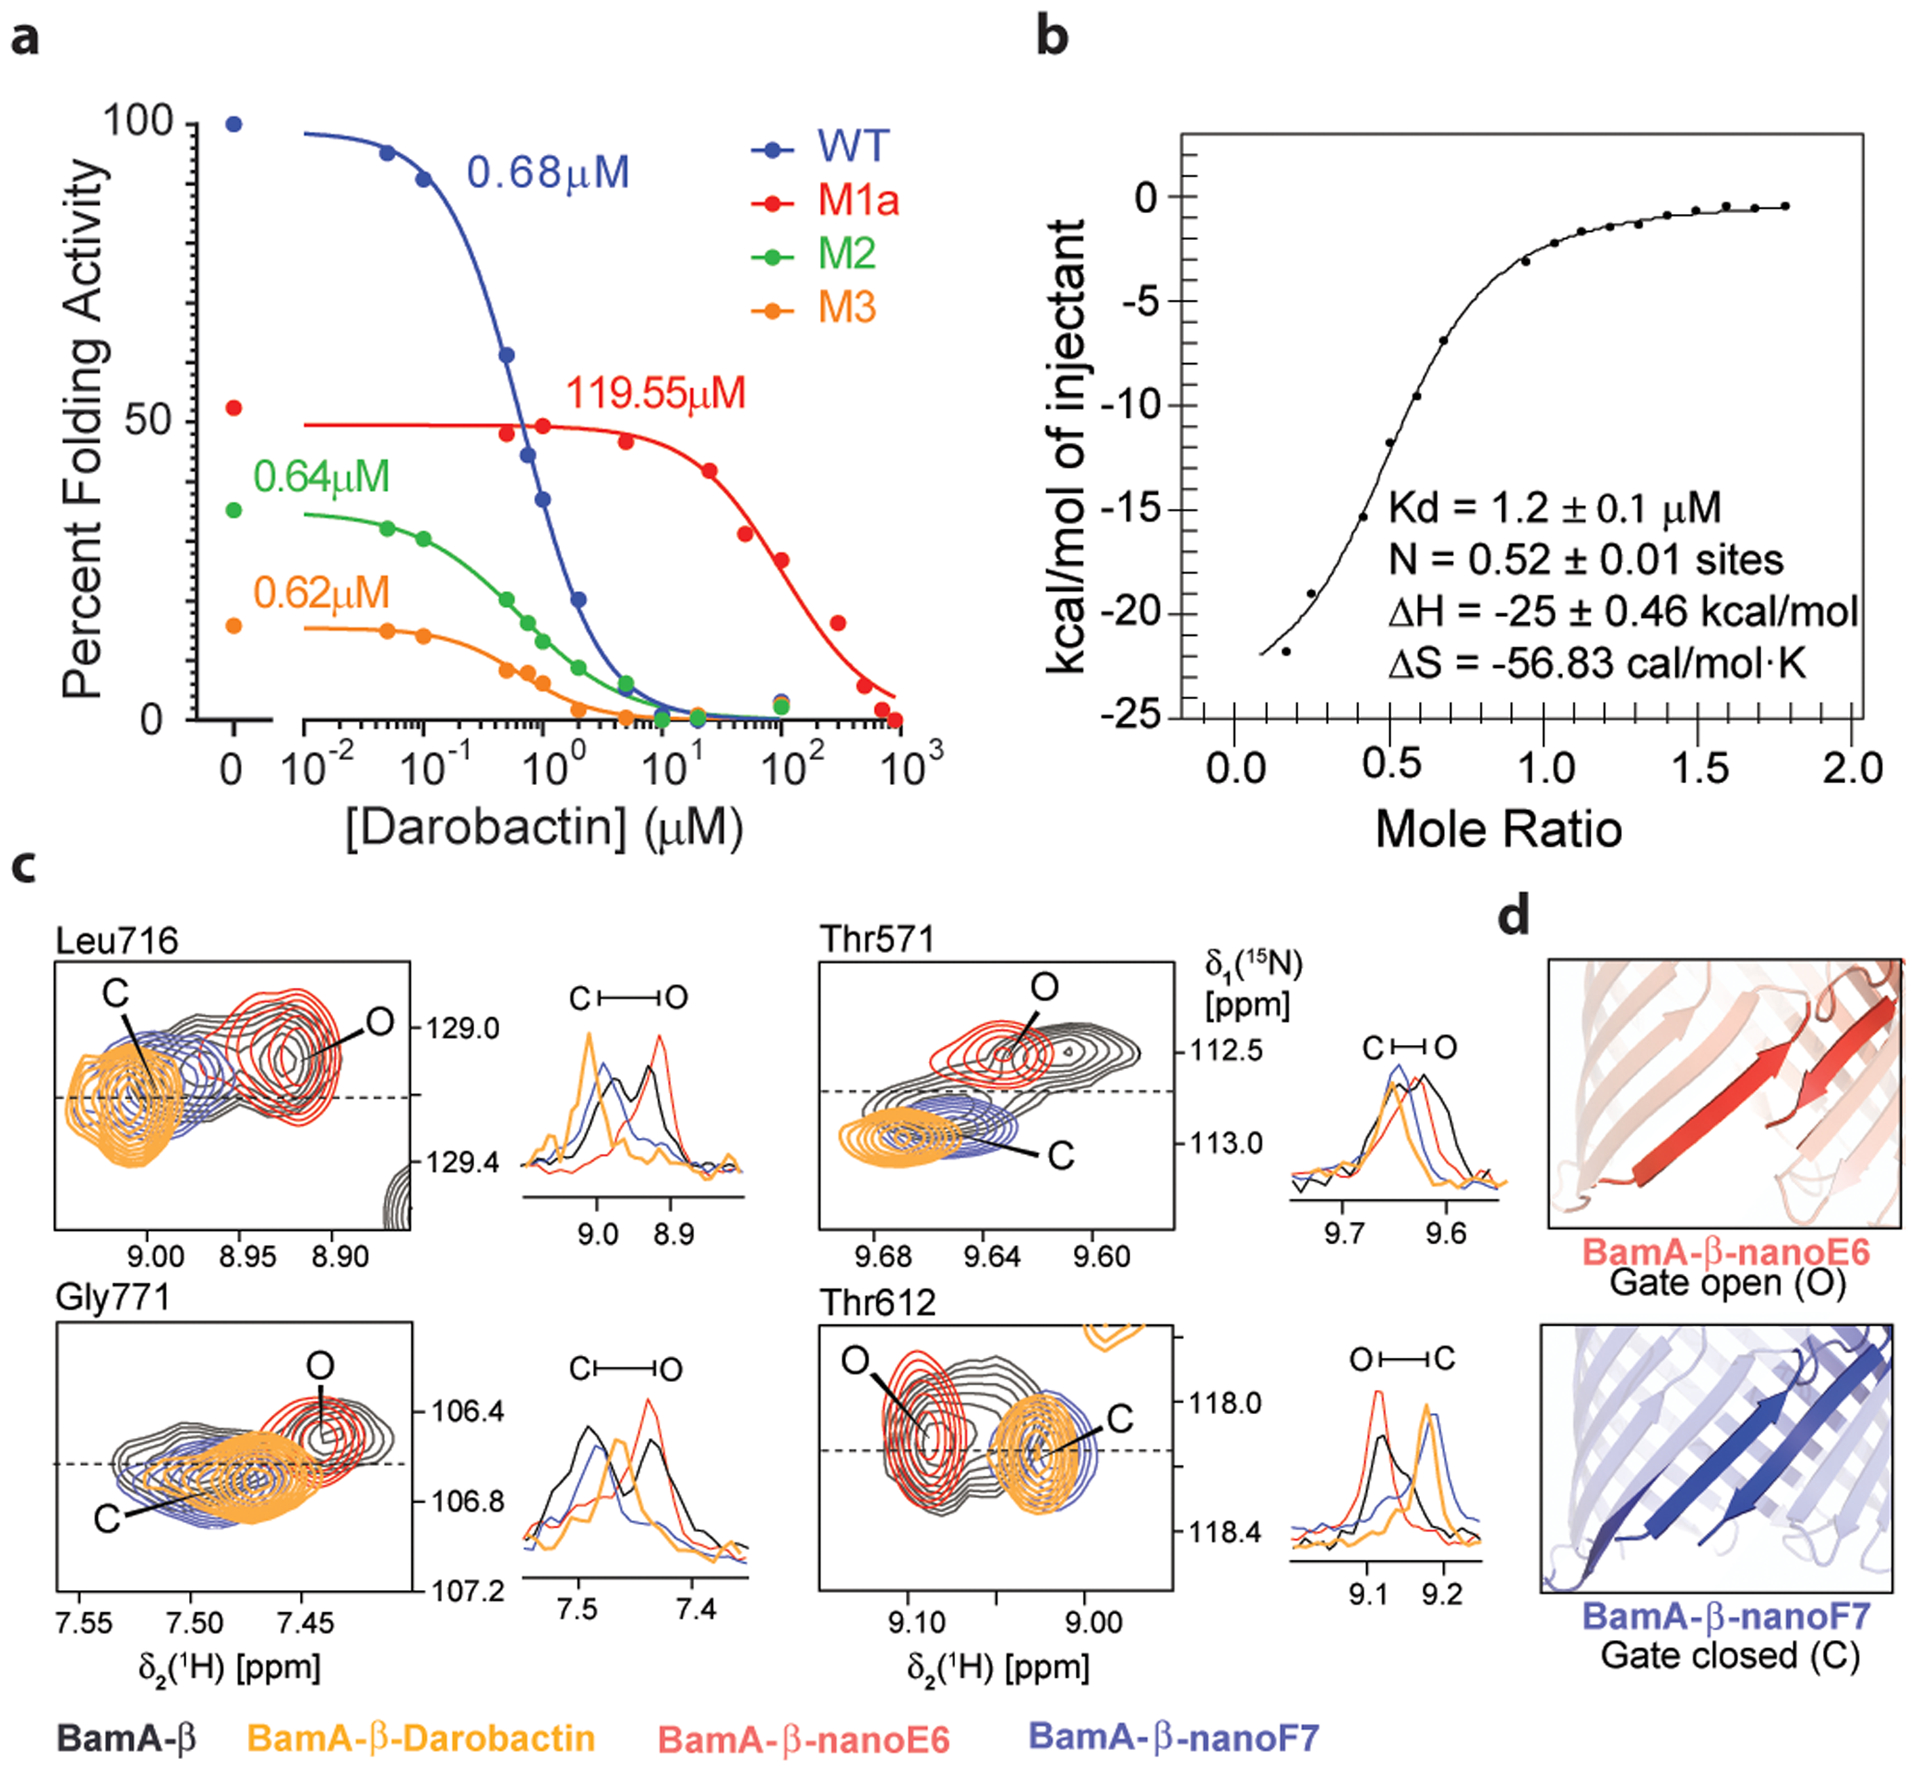
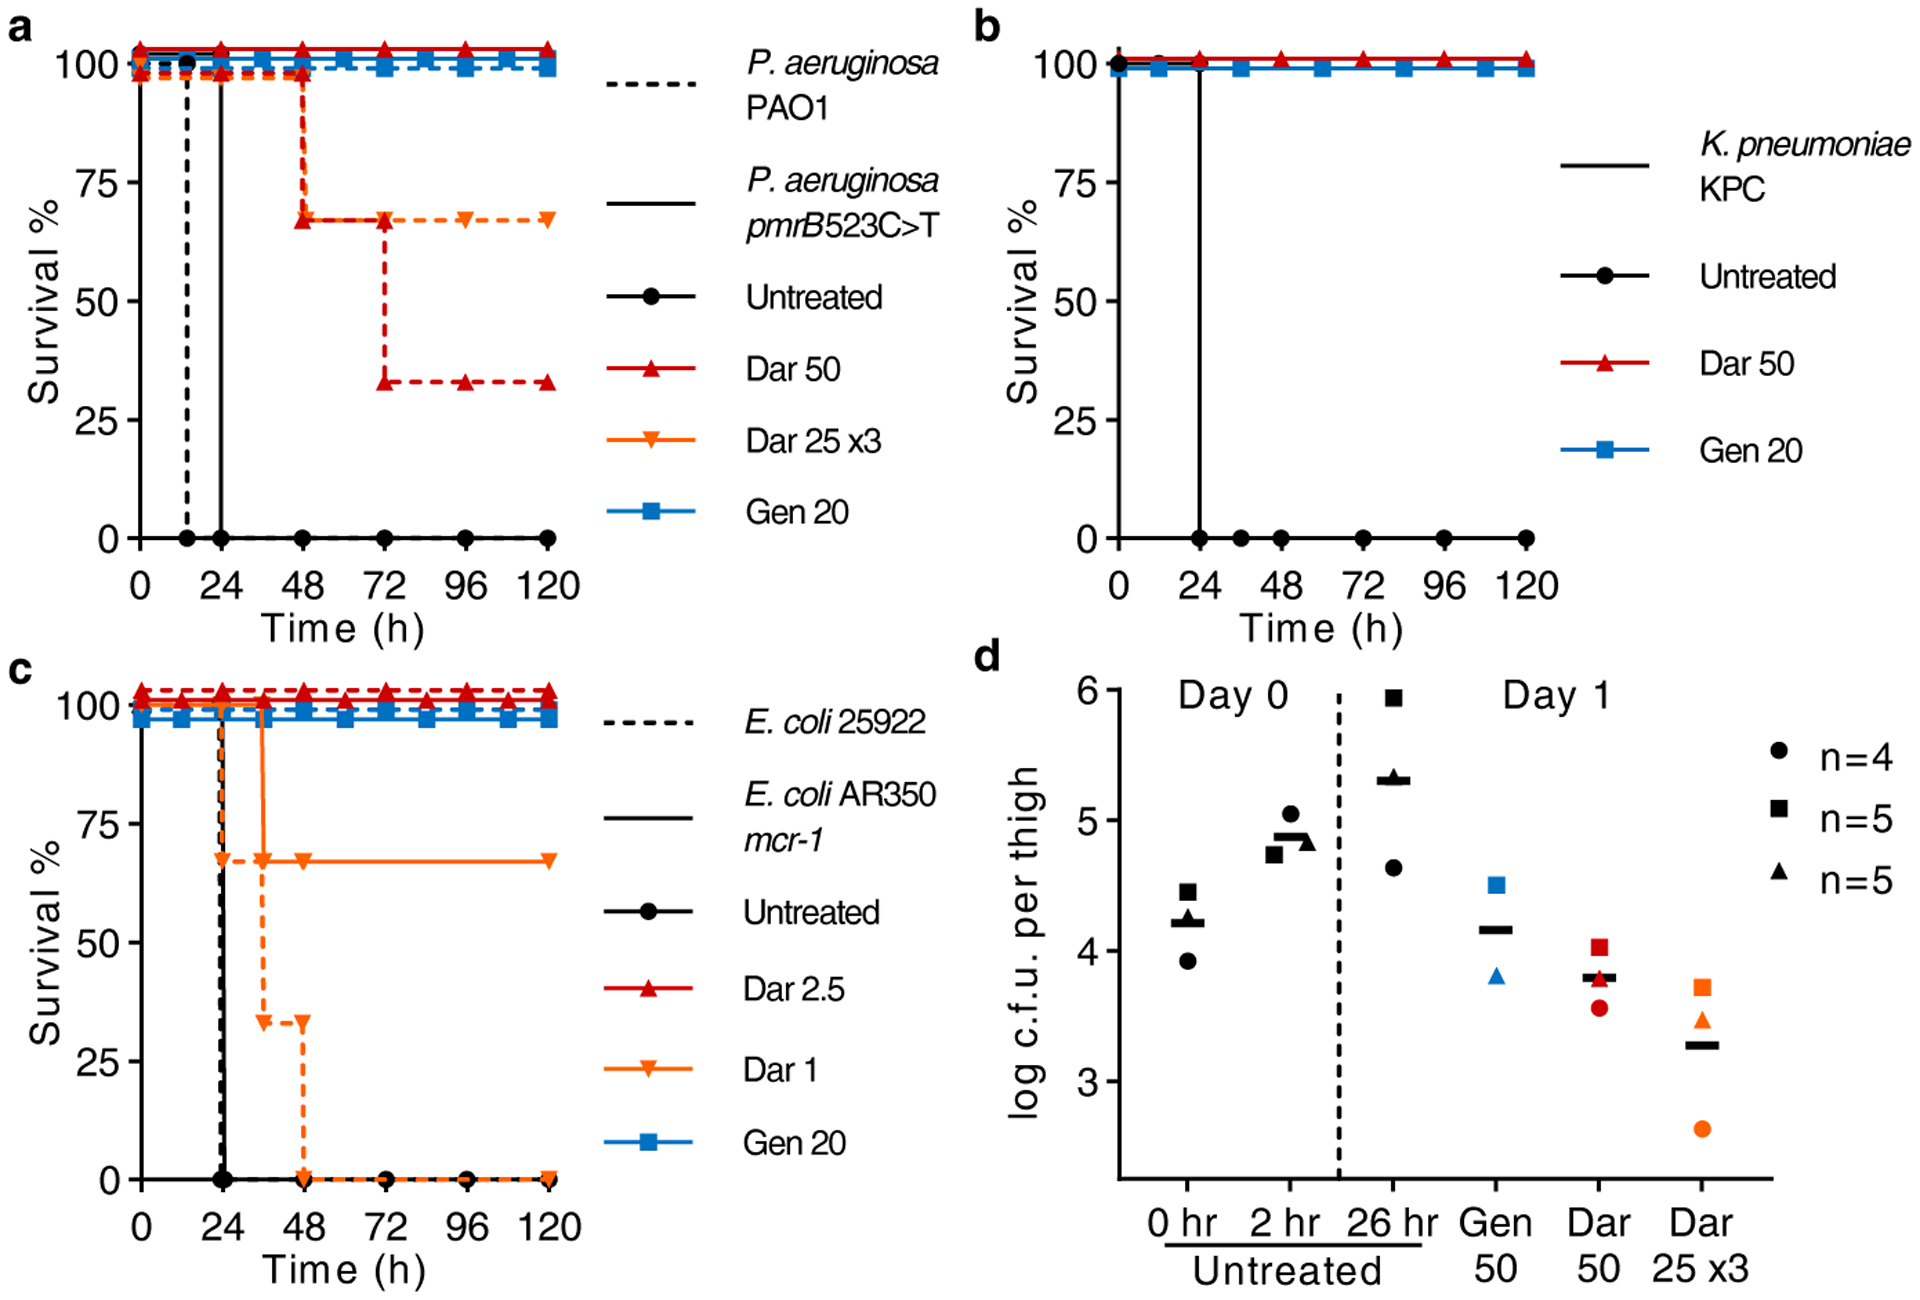
The current need for novel antibiotics is especially acute for drug-resistant Gram-negative pathogens1,2. These microorganisms have a highly restrictive permeability barrier, which limits the penetration of most compounds3,4. As a result, the last class of antibiotics that acted against Gram-negative bacteria was developed in the 1960s2. We reason that useful compounds can be found in bacteria that share similar requirements for antibiotics with humans, and focus on Photorhabdus symbionts of entomopathogenic nematode microbiomes. Here we report a new antibiotic that we name darobactin, which was obtained using a screen of Photorhabdus isolates. Darobactin is coded by a silent operon with little production under laboratory conditions, and is ribosomally synthesized. Darobactin has an unusual structure with two fused rings that form post-translationally. The compound is active against important Gram-negative pathogens both in vitro and in animal models of infection. Mutants that are resistant to darobactin map to BamA, an essential chaperone and translocator that folds outer membrane proteins. Our study suggests that bacterial symbionts of animals contain antibiotics that are particularly suitable for development into therapeutics.


Conflict of interest statement

The authors declare no competing financial interests.

Figures

Extended Data Figure 1
Extended Data Figure 1. Structural determination of darobactin.
a, HPLC chromatogram of Darobactin, in inset, HRMS spectra of Darobactin showing a peak at m/z 966.41047 corresponding to [M+H]+ ion and another at m/z 483.70865 corresponding to [M+2H]2+ ion. b, High Energy Collisional Dissociation-MS/MS spectra (HCD-MS/MS) of Darobactin. c, 1H NMR spectrum of Darobactin. d, 13C NMR spectrum. e, HMBC NMR spectrum. f, HSQC NMR spectrum. g, COSY NMR spectrum. h, ROESY NMR spectrum.
Extended Data Figure 2
Extended Data Figure 2. NMR assignments of darobactin.
a, 1H, 13C and 15N NMR chemical shifts (ppm) for darobactin. † Due to overlap with residual water peak at 4.6 ppm, the multiplicity and J coupling values were from a different 1H- NMR spectrum of Darobactin in water: deuterated acetonitrile (2:1, v/v). ‡ Two partially overlapped peaks were observed at 131.79 ppm and 131.83 ppm. b, Structure of darobactin with numbering for NMR assignments. c, Key ROESY correlations (top) and 3D model of darobactin (bottom).
Extended Data Figure 3
Extended Data Figure 3. Biosynthetic gene cluster (BGC) of darobactin in selected bacterial strains.
a, The BGC consists of the structural gene darA (colored in blue), darBCD (transporter encoding genes, in grey) and darE (encoding a radical SAM enzyme, in orange). In addition a relE-like gene (black) ORF can be co-located with the BGC at different positions. The BGC can be detected in most Photorhabdus strains in a conserved genetic region. In addition, homologous BGCs (related genes show the identical color code) are in Yersinia, Vibrio and Pseudoalteromonas strains. b, Biosynthetic hypothesis. The propeptide encoded by darA consists of 58 amino acids. The crosslinks are installed on the linear propeptide by DarE. In a next step the leader and tail regions are cleaved off and darobactin is secreted by the ABC transporter DarBCD. c, Amino acid sequence of the propeptide from selected bacterial strains. The darobactin core peptide is highlighted in bold and the amino acids involved in the crosslinking in bold red. The star indicates the stop codon.
Extended Data Figure 4
Extended Data Figure 4. Darobactin knockout strain and heterologous expression, and putative structures and producers of darobactin A-E.
a, Scheme of the double cross-over knock out vector pNB02 and the targeted genomic region. b, Scheme of the darobactin BGC expression plasmid. c, Test PCRs on P. khanii DSM3369 ΔdarABCDE, proving the loss of the darobactin BGC; left: Amplification of darA (primers darA_f/r) resulting in a 177 bp fragment in the WT and in no fragment in the mutant; right: After loss of pNB02 (indicated by sensitivity to Kan) amplification of a 450 bp fragment if the BGC is deleted (primers DSMko_f/r); positive control: pNB03-darA-E and pNB02, respectively; primer positions indicated in blue in scheme a. Raw DNA gel is provided in Supplementary Figure 1. d, LC-MS extracted ion chromatogram (EIC) at m/z=483.7089 ± 0.001, yellow: P. khanii DSM3369 ΔdarABCDE + pNB03 red: P. khanii DSM3369 ΔdarABCDE + pNB03-darA-E, brown: E. coli BW25113 + pNB03-darA-E blue: P. khanii DSM3369 WT, inset: HRMS spectrum of the ion peak showing the double charged [M+2H]2+ ion corresponding to darobactin. Data (c and d) are representative of at least three independent biological replicates. e, Putative darobactin analogs B-E were drawn based on the amino acid sequence present in the darobactin BGC. The proposed producing organisms were identified by a BLASTP search of the 7 amino acid sequence of darobactin A, and confirming the presence of darBCDE downstream of the propeptide. Amino acid changes from darobactin A are highlighted in red. f, The table shows the propeptide sequence of the various darobactin analogs.
Extended Data Figure 5
Extended Data Figure 5. Darobactin mechanism of action and resistance studies.
a, Darobactin and polymyxin B MIC against E. coli MG1655 were performed in the presence of LPS. Addition of LPS antagonized polymyxin activity, but not darobactin. Data are from triplicate experiments, symbols are mean, error bars SD. b, Groups of five mice were infected ip with 107 E. coli ATCC 25922, then at 24 h euthanized (if not already dead), livers and spleens harvested, homogenized, and plated for c.f.u. The wild-type E. coli caused 60% death and was at high c.f.u. burdens in liver and spleen. All three darobactin resistant bamA mutants had reduced virulence, with 100% survival in all groups at 24 h. The burden of bacteria of the Strain-3 (Fig. 2a) triple bamA mutant was close to limit of detection (LOD) in organs, G429R was at low but detectable levels, whereas G429V was at relatively high loads in organs. n=5, lines are mean, error bars are SD. c, Schematic of the BAM activity assay with BAM (BamA-E) first being inserted into lipid nanodiscs. Unfolded OmpT, along with the periplasmic chaperone SurA, is then mixed with the BAM-nanodiscs, where BAM folds OmpT into the nanodisc. OmpT, a protease, cleaves an internally-quenched peptide which produces a fluorescent signal. d, BAM-nanodisc (ND) assays performed in the presence of increasing concentrations of darobactin (left panel). The results show that darobactin is able to specifically inhibit BAM-ND activity in a dose-dependent manner. This data was then normalized against the ‘no darobactin’ sample and the highest concentration of darobactin, and plotted and an IC50 calculated using the online IC50 Calculator tool (AAT Bioquest) (right panel). n=3 biologically independent experiments. Symbols are mean, error bars are SD. e, As a control to the BAM-ND assays, we prepared OmpT-ND and assayed OmpT-ND activity in the presence of increasing concentrations of darobactin. To prepare the OmpT-ND, we first expressed OmpT as inclusion bodies and then refolded using previously reported methods. We then incorporated OmpT into nanodiscs using the same methods as described for BAM. The assays were performed using 0.4 μM of OmpT-ND. The results show that darobactin has virtually no effect on OmpT-ND activity, thereby confirming that darobactin is not affecting OmpT activity itself, or disrupting the nanodiscs themselves. A representative plot is shown from a triplicate experiment. f, The WNWSKSF peptide does not inhibit BAM-ND. As a control to darobactin, the BAM-ND assays were performed in the presence of increasing concentrations of a linear peptide WNWSKSF. The results show that the WNWSKSF peptide has only minimal effects on BAM-ND activity, even at the highest concentrations. A representative plot is shown from a triplicate experiment. g,h, Specific binding of darobactin to BamA/BAM. Mole Ratio is the protein/ligand ratio. g, Plot of ITC experiments of WT BAM titrated with darobactin showing a Kd of 1.2 μM, N of 0.52, ΔH of −25 kcal/mol, and ΔS of =-56 cal/mol·K. The experiment was repeated independently two times with similar results. h, Plot of ITC experiments of WT BAM titrated with the peptide WNWSKSF showing no binding within the same concentration range used for darobactin. The experiment was repeated independently two times with similar results. i, j, 2D [15N, 1H]-TROSY spectra of 250 μM BamA-β in 0.1% w/v LDAO. i, BamA-β in the absence (left) and in the presence of darobactin in the molar ratio 1:0.5 (middle) and 1:1 (right). The red dashed line outlines an exemplary spectral region experiencing substantial spectral changes during the titration. The experiment was repeated independently two times with similar results. j, An overlay of apo BamA-b (black) (250 μM) with BamA-b+scrambled linear peptide WNKWSFS (green) (230 μM). The experiment was performed once as is typical for NMR.
Extended Data Figure 6
Extended Data Figure 6. Darobactin disrupts the outer membrane and causes lysis of E. coli.
E. coli MG1655 cells were placed on top of an agarose pad containing darobactin and the fluorescent dyes FM4–64, to stain the membrane (false-colored here in magenta), and Sytox Green, to show membrane permeabilization (false-colored here in green), and observed over time at 37°C under the microscope. For each time indicated, representative panels show the killing progression of E. coli MG1655 with darobactin. White arrows highlight membrane blebbing, and orange arrows highlight swelling and lysis. Scale bar, 5 μm. This figure is representative of three biologically independent experiments performed with similar results.
Extended Data Figure 7
Extended Data Figure 7. Transcriptome analysis of darobactin treatment shows activation of envelope stress pathways.
E. coli BW25113 were treated with 1xMIC darobactin, RNA isolated, and sequenced. a,b,c, Volcano plots illustrating differential gene expression (edgeR’s Fisher’s Exact Test; significance |log2FC| ≥ 2 and FDR < 0.001; n=3 biologically independent samples for each control/treatment) at time points a, t=15, b, t=30, and c, t=60 minutes after exposure. Gray, not significant. d, Network visualization of differentially expressed genes at each time point. Nodes include genes (colored circles) and time points (gray rectangle). Gene node colors represent relevant functional categories. Directed edges radiating from a time point node represent differentially expressed genes with respect to the given time point with weights reflecting the |log2FC|. e, (Top) Heatmap showing the differential expression (|log2FC|) of genes of interest and (bottom) assignment to envelope stress pathways. Solid lines depict members of the same operon. In all panels, red indicates down-regulation (lower expression in treatment relative to control) and blue indicates up-regulation.
Extended Data Figure 8
Extended Data Figure 8. Two-dimensional thermal proteome profiling (2D-TPP) of darobactin.
a,b,c, Pseudo-volcano plots for 2D-TPP experiments of darobactin treatment (10 min) of E. coli BW25113 in a, living cells, b, lysate, and c, living cells pre-treated with chloramphenicol to inhibit protein synthesis (n=1 at each concentration, heated to 10 different temperatures, for each experiment). Significant hits (false discovery rate <1%, calculated with a functional analysis of dose-response, requiring stabilization effects at n>1 temperatures as described in Sridharan et al. (2019)) are highlighted in blue and integral outer membrane proteins are highlighted in purple. d, Heatmaps for selected proteins in the experiment with living cells. For each protein and temperature (key on right), the signal intensity was normalized to the vehicle control. e, Schematic of putative thermally stable assembled versus labile unassembled populations of BAM machinery with darobactin treatment.
Extended Data Figure 9
Extended Data Figure 9. Darobactin single-dose pharmacokinetics and mouse thigh models.
a, Three mice were injected with 50 mg kg−1 darobactin ip, and blood samples were collected by tail snip over 24 h. Samples (n=1 per timepoint and mouse) were analyzed for darobactin content by LC-MS/MS, and concentrations calculated using a standard curve created by linear regression on the log(AUC peak) to log(concentration) of standards. Pharmacokinetic values were calculated in Excel; t1/2 and Time>MIC assuming first order elimination and using linear regression on time points 3 – 8 h; AUC (0–16 h) using the trapezoid rule. Limit of detection (LOD) was 0.08 μg ml−1. b, A mouse thigh model was repeated three times testing the efficacy of darobactin against E. coli AR350. Mice were injected with bacteria in their right thigh at 0 hr, then dosed with no drug, gentamicin, or darobactin starting at 2 hr (50 mg kg−1 once, 25 mg kg−1 given three times every 6 h, or 20 mg kg−1 once). At 26 hr mice were sacked and thighs collected and plated for c.f.u. Centre lines are mean, error bars are SD.
Figure 1
Figure 1. Darobactin produced by a silent operon of P. khanii is a bactericidal antibiotic.
a, P. khanii was grown in liquid culture, then concentrated culture supernatants tested for inhibition of E. coli MG1655. P. khanii concentrated supernatant produced a zone of inhibition on an E. coli lawn, while unconcentrated supernatant or a colony overlay did not. Paenibacillus polymyxa produces polymyxin and serves as a positive control. b, Darobactin structure. c, The BGC consists of the structural gene darA (colored in blue), darBCD (transporter encoding genes, in grey) and darE (encoding a radical SAM enzyme, in orange). In addition, a relE-like gene (black) ORF can be co-located with the BGC at different positions. d, Time-dependent killing of E. coli MG1655 by darobactin. An exponential culture of E. coli MG1655 was challenged with 16xMIC antibiotics. n=3 biologically independent samples, symbols are mean, error bars are SD. e, SEM analysis of E. coli MG1655 treated with 16xMIC darobactin (Scale bar, 1 μm).
Figure 2
Figure 2. Multiple mutations in bamA confer darobactin resistance.
a, Darobactin resistant mutants were generated by serial passaging of E. coli MG1655 at sub-MIC concentrations of darobactin daily, leading to a steady shift in darobactin concentration permitting E. coli MG1655 growth. This experiment was performed in three biologically independent samples. The three mutants obtained harbored 2–3 mutations in bamA. b, Schematic of the Bam complex. c, Mice were injected with 107 c.f.u. E. coli ATCC 25922, wild-type or containing mutations in bamA; the triple mutations evolved in Strain-3 (Fig. 2a), or single spontaneous resistant mutations of G429 to R or V, n=5 per group. Mice were monitored for survival. d, Darobactin resistance mutations (colored spheres) mapped on to the BamA protein structure (gray) shown as cartoon with the barrel domain and the individual POTRA domains indicated.
Figure 3
Figure 3. Darobactin inhibits BAM activity, binds to and induces selection of the closed-gate conformation of BamA-b.
a, The assay in Extended Data Fig. 5c was used to measure BAM activity, wild type and resistant mutants, in the presence of increasing concentrations of darobactin. IC50 value are indicated in the figure for each mutant. Confidence intervals 95% for IC50 WT 0.61 to 0.75 μM, M1a (G429V, T434A and G807V; Methods) 68 to 148 μM, M2 (F394V, E435K and G443D) 0.50 to 0.83 μM, M3 (T434A, Q445P and A705T) 0.38 to 0.94 μM (Prism v8.2). The experiment was repeated independently at least three times with similar results. b, Specific binding of darobactin to BamA/BAM. Mole Ratio is the protein/ligand ratio. Plot of ITC experiments of WT BAM titrated with darobactin showing a Kd of 1.2 μM, N of 0.52, ΔH of −25 kcal/mol, and ΔS of =-56 cal/mol·K. The experiment was repeated independently two times with similar results. c, 2D-close up and 1D-cross sections from 2D [15N, 1H]-TROSY spectra of BamA-β in LDAO micelles for four selected amino acid residues, as indicated on top of each panel. Color code: Apo BamA-b (black), equimolar BamA-b:Darobactin (orange), BamA-b+nanoF7 (blue) and BamA-b+nanoE6 (red). Resonances corresponding to open and closed conformation have been indicated as O and C, respectively. The experiment was repeated independently two times with similar results. d, Conformation of the gate region in crystal structures of BamA-b+nanoE6 and BamA-b+nanoF7, respectively (PDB: 6QGW, 6QGX7).
Figure 4
Figure 4. Darobactin is efficacious in mouse infection models.
a, b, c, Mice were given a lethal inoculum of bacteria (ip), and antibiotics were administered 1 h later. a, Darobactin (Dar) was tested against P. aeruginosa, PAO1 wild type and pmrB 523C>T (resistant to polymyxin) septicemia, n=3 per group. ‘25 ×3’ refers to three doses given every 6 h. b, Darobactin was tested against K. pneumoniae, carbapenemase producing (KPC), n=3 per group. c, Determining the minimum curative dose of darobactin against E. coli wild type (ATCC 25922) and polymyxin-resistant clinical isolate (AR350), n=3 per group. d, In a neutropenic thigh model darobactin was given as a single dose (ip) at 2 h post infection, or administered three times; at 2, 8, and 14 h. Thighs were removed and plated for CFU at 26 h. Experiment was repeated three times, symbols represent average of group in each experiment (n=4 or 5), lines are mean of experiments. Gentamicin (Gen) was used as a positive control. All doses are mg kg−1.

Comment in

References

    1. Payne DJ, Gwynn MN, Holmes DJ & Pompliano DL Drugs for bad bugs: confronting the challenges of antibacterial discovery. Nat Rev Drug Discov 6, 29–40 (2007) - PubMed
    1. Lewis K Platforms for antibiotic discovery. Nat Rev Drug Discov 12, 371–387 (2013) - PubMed
    1. Lomovskaya O & Lewis K Emr, an Escherichia coli locus for multidrug resistance. Proc Natl Acad Sci U S A 89, 8938–8942 (1992) - PMC - PubMed
    1. Li XZ & Nikaido H Efflux-mediated drug resistance in bacteria. Drugs 64, 159–204 (2004) - PubMed
    1. Tacconelli E et al. Discovery, research, and development of new antibiotics: the WHO priority list of antibiotic-resistant bacteria and tuberculosis. Lancet Infect Dis 18, 318–327 (2018) - PubMed

Publication types

MeSH terms