. 2019 Nov 20;11(519):eaaw0064.
doi: 10.1126/scitranslmed.aaw0064.

Therapeutic strategies for diffuse midline glioma from high-throughput combination drug screening

Affiliations

Therapeutic strategies for diffuse midline glioma from high-throughput combination drug screening

Grant L Lin et al. Sci Transl Med. .

Abstract

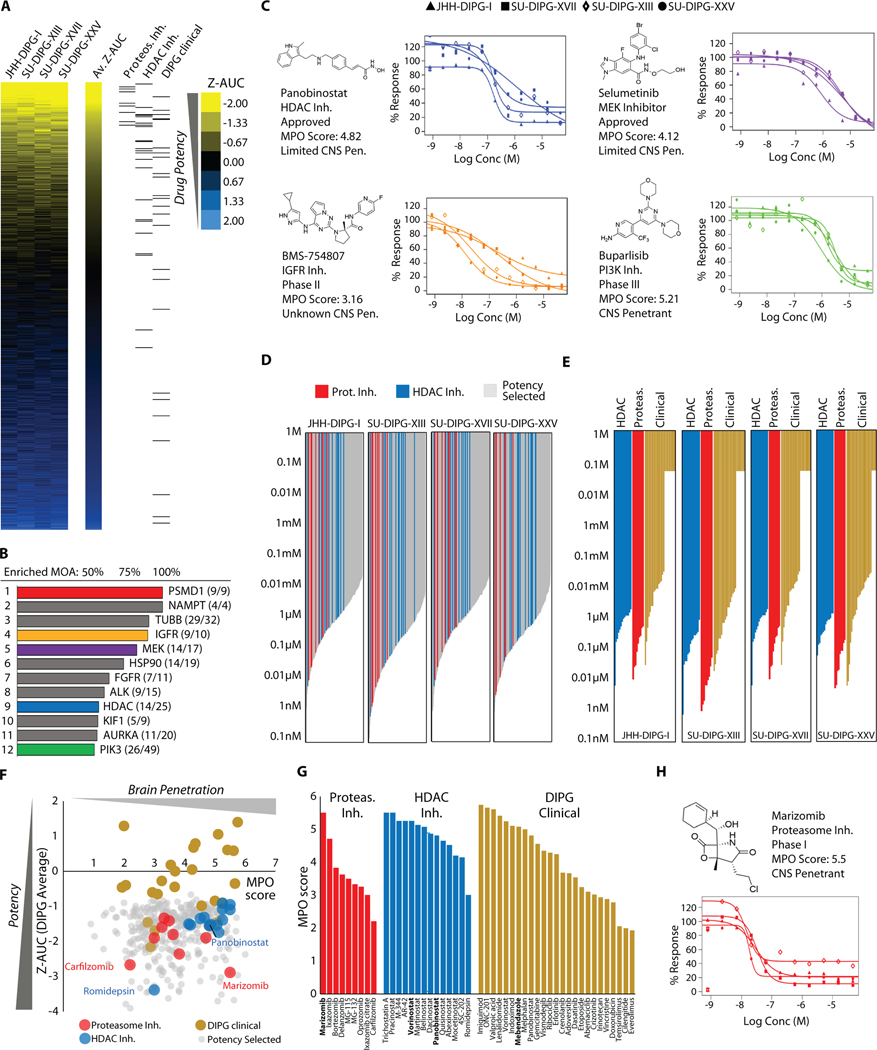
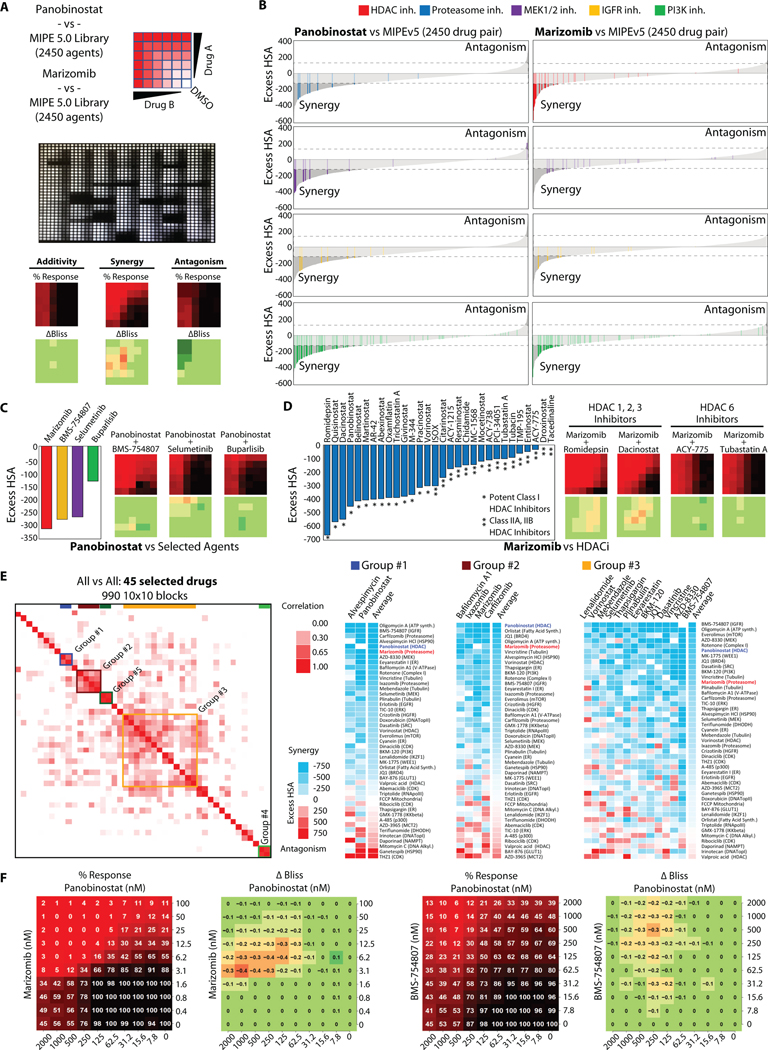
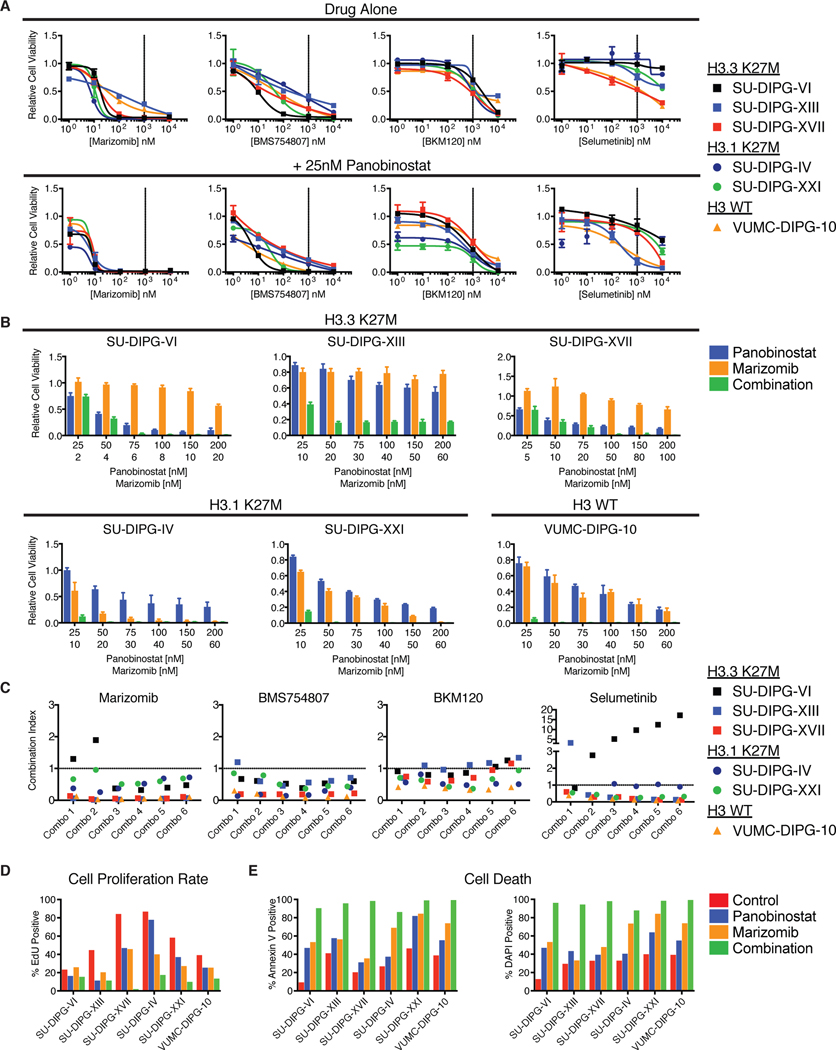
Diffuse midline gliomas (DMGs) are universally lethal malignancies occurring chiefly during childhood and involving midline structures of the central nervous system, including thalamus, pons, and spinal cord. These molecularly related cancers are characterized by high prevalence of the histone H3K27M mutation. In search of effective therapeutic options, we examined multiple DMG cultures in sequential quantitative high-throughput screens (HTS) of 2706 approved and investigational drugs. This effort generated 19,936 single-agent dose responses that inspired a series of HTS-enabled drug combination assessments encompassing 9195 drug-drug examinations. Top combinations were validated across patient-derived cell cultures representing the major DMG genotypes. In vivo testing in patient-derived xenograft models validated the combination of the multi-histone deacetylase (HDAC) inhibitor panobinostat and the proteasome inhibitor marizomib as a promising therapeutic approach. Transcriptional and metabolomic surveys revealed substantial alterations to key metabolic processes and the cellular unfolded protein response after treatment with panobinostat and marizomib. Mitigation of drug-induced cytotoxicity and basal mitochondrial respiration with exogenous application of nicotinamide mononucleotide (NMN) or exacerbation of these phenotypes when blocking nicotinamide adenine dinucleotide (NAD+) production via nicotinamide phosphoribosyltransferase (NAMPT) inhibition demonstrated that metabolic catastrophe drives the combination-induced cytotoxicity. This study provides a comprehensive single-agent and combinatorial drug screen for DMG and identifies concomitant HDAC and proteasome inhibition as a promising therapeutic strategy that underscores underrecognized metabolic vulnerabilities in DMG.


Conflict of interest statement

Competing interests: The authors declare that they have no competing interests.

Figures

Fig. 1.
Fig. 1.. Drug candidates identified through high-throughput drug screening in DIPG.
(A) Heat-map representation of drug activities for four DIPG cell cultures (JHH-DIPG-1, SU-DIPGXIII, SU-DIPG-XVII, SU-DIPG-XXV) screened versus the MIPE 5.0 library. Activity scores are based upon Z-score transformed area-under-the-curve values (Z-AUC). Tick-marks on the right side of the plots highlight the relative ranking of proteasome and HDAC inhibitors, as well as the relative rankings of agents in active clinical evaluation in DIPG. (B) Mechanistic drug classes enriched among the 371 ‘hits’ selected based on consistent potency across DIPG cell cultures. Enrichment was defined as Hits# ≥ 2 and target coverage ≥ 35%. (C) Dose response curves for selected agents from key enriched mechanistic classes (Fig. 1B) including panobinostat (HDAC), selumetinib (MEK), BMS-754807 (IGFR), buparlisib (PI3K). (D) Potency (AC50) distribution for proteasome (red) and HDAC (blue) inhibitors compared with the 371 potency-selected hits (gray). (E) Potency (AC50) distribution for proteasome (red) and HDAC (blue) inhibitors compared with agents in active clinical evaluation in DIPG (mustard). (F) For the 371 potency-selected hits, Z-AUC values were compared to predicted CNS penetration using Multi Parameter Optimization Desirability (MPO) scores. The color scheme is the same of Fig. 1E. (G) Distribution of MPO scores for proteasome inhibitors (red), HDAC inhibitors (blue), and agents in active clinical evaluation in DIPG. (H) Dose-response curves for the proteasome inhibitor marizomib.
Fig. 2.
Fig. 2.. Synergistic drug-drug interactions in DIPG identified via HTS-enabled combination drug screening.
(A) Schematic layout of the ‘drug-versus-all’ screen for panobinostat and marizomib versus the entire MIPE 5.0 library. (Top) Each drug pair was tested in a 6×6 matrix block, reflecting 5 doses plus DMSO control for each individual matrix block. (Middle) An exemplar 1536 plate containing 6×6 blocks. (Bottom) Examples of %Response and ΔBliss heat-maps for additivity, synergy or antagonism outcomes. (B) The entire panobinostat (left panels) and marizomib (right panels) ‘drug-versus-all’ screen results were ranked by synergy, as assessed by the ExcessHSA metric (gray). Each panel highlights drugs from key mechanistic classes including HDAC, proteasome, MEK, IGFR and PI3K inhibitors. (C) (Left) ExcessHSA values for the combination of panobinostat with the proteasome inhibitor marizomib, the IGFR inhibitor BMS754807, the MEK inhibitor selumetinib and the PI3K inhibitor buparlisib. (Right) % Response and ΔBliss heat-maps for BMS-754807, selumetinib, and buparlisib. (D) (Left) Thirty HDAC inhibitors from the MIPE 5.0 library were ranked based on the ExcessHSA values versus the marizomib. Class I (*) and Class II/III (**) HDAC inhibitors are highlighted. (Right) %Response and ΔBliss heat-maps for example class I pan-HDAC inhibitors (romidepsin and dacinostat) or Class II HDAC6 inhibitors (ACY-775 and tubastatin A). (E) (Left) The correlation heat-map of the 45 drug ‘all-versus-all’ combination screen. Sub-groups of drugs with similar combination profiles are highlighted (group 1: blue; group 2: brown; group 3: orange; group 4: light green; group 5: dark green). (Right) The original ExcessHSA values for the groups 1, 2 and 3. Ranking is based on the average ExcessHSA within each group. These figures are expanded in fig. S2. (F) 10×10 %Response heat-maps and ΔBliss heat-maps for the combinations of panobinostat with either marizomib or BMS-754807.
Fig. 3.
Fig. 3.. In vitro validation of top drug combinations across representative DIPG cell cultures.
(A) Dose-response curves of cell viability as measured by CellTiterGlo compared to DMSO control of patient-derived DIPG cell cultures after 72 h exposure to top candidate therapeutic agents marizomib, BMS-754807, buparlisib, and selumetinib alone (top) or with 25 nM panobinostat (bottom). Vertical dashed line is at 1 μM, representing an approximate range for achievable concentrations in vivo. (B) Cell viability compared to DMSO control after 72 hours exposure of six patient-derived DIPG cell cultures to varying doses of panobinostat (blue), marizomib (red), or both (purple). Similar measurements for the other top drug combination candidates can be found in fig. S3A. (C) Calculated median-effect drug synergy combination index (CI) scores (Biosoft Calcusyn 2.0) across dose levels for each of the four candidate drug combinations. Horizontal dashed line indicates a CI = 1, where points below the line indicate synergy and points above the line indicate antagonism. (D) Cell proliferation as measured by flow cytometric analysis of EdU incorporation (left) and cell death as measured by surface labeling of Annexin V (middle) and permeability to DAPI (right) of six patient-derived DIPG cell cultures. For EdU analysis, cells were incubated with DMSO vehicle (Control, grey), panobinostat (blue), marizomib (red) or combination panobinostat and marizomib (Combo, purple) for 16 hours, and then exposed to 10 μM EdU for 24 hours before analysis. For Annexin V and DAPI analysis, cells were incubated for 48 hours before analysis. Individual flow cytometry histograms can be found in fig. S3B.
Fig. 4.
Fig. 4.. Panobinostat and marizomib in xenograft models of DIPG and other diffuse midline gliomas.
(A) In vivo bioluminescence imaging of SU-DIPG-VI GFP-luc xenografts after four weeks of treatment with marizomib at 150 μg/kg once every two weeks (top, n = 3 vehicle controls, n = 3 treated mice) or 150 μg/kg twice every two weeks (bottom, n = 5 vehicle controls, n = 3 treated mice). Two-tailed t-test. (B) Overall survival of SU-DIPG-XIII-P* xenografted mice treated with vehicle; panobinostat alone (top: 5 mg/kg, bottom: 10 mg/kg, 3 times per week, every other week); marizomib alone (150 μg/kg, top: 1 time per week, bottom: 2 times per week, every other week); or combination (panobinostat 5 mg/kg, 3 times per week, every other week, and marizomib 150 μg/kg, 1 time per week, every other week in both cohorts). Log rank test. (C) In vivo bioluminescence imaging of QCTB-R059 GFP-luc xenografts after four weeks of treatment with vehicle control, panobinostat (5 mg/kg, 3 times weekly, every other week), marizomib (150 μg/kg, once weekly, every other week), or combination panobinostat and marizomib, alternating every week. One-way ANOVA with Tukey’s multiple comparisons test. * p < 0.05, ** p < 0.01.
Fig. 5.
Fig. 5.. RNA-seq analysis of the combination of panobinostat and marizomib in SU-DIPGXIII cells.
(A) Heat-map representations of the Log2 gene expression changes (Log2FC) following treatment of SU-DIPG-XIII with 50 nM panobinostat, 20 nM marizomib, or two combination doses (50 nM + 20 nM or 100 nM + 50 nM, panobinostat and marizomib, respectively). Differentially expressed genes were selected based on either panobinostat vs. DMSO (left) or marizomib vs. DMSO (right) comparisons, and heat-maps depicting all the four treatments set were then generated accordingly by unsupervised hierarchical clustering. (B) Volcano plot of each individual treatment set with respect to the DMSO control. Statistically significantly downregulated or upregulated genes are highlighted in blue or red, respectively. (C) A fold-change pre-ranked list of each treatment versus DMSO was used to run GSEA analysis against the Hallmark (shown here) and Reactome gene sets (fig. S9C). Unsupervised hierarchical clustering of Normalized Enrichment Scores (NES) was used to generate a comprehensive heat-map visualization of the functional transcriptional outputs of the four treatment sets. (D) Cytoscape Enrichment Map visualization of top gene programs represented by significantly upregulated genes present in combination-low treated cells but not either single-agent treated condition. Node size represents number of genes, node color represents significance (FDR), and edge thickness represents number of shared genes. Clustered gene programs are labeled. (E) The gene expression changes for the ‘leading-edge’ genes from the Reactome-UPR gene-set are shown. Leading selection and ranking were based on the combo high (h) treatment set. (F) Western blot analysis of the indicated endoplasmic reticulum (ER) stress/UPR or apoptosis biomarkers is shown for all the four treatment sets. Black triangles denote cleaved PARP and cleaved caspase-3. β-actin was used as a loading control. (G) %Response and ΔBliss heat-maps are shown for the combination of either panobinostat or marizomib with the ER modulators eeyarestatin and bafilomycin A1.
Fig. 6.
Fig. 6.. Targeted metabolic profiling of the combination of panobinostat and marizomib in SU-DIPG-XIII cells.
(A) Cytoscape Enrichment Map visualization of top gene programs represented by significantly downregulated genes present in combination low treated cells but not either single-agent treated condition. Node size represents number of genes, node color represents significance (FDR), and edge thickness represents number of shared genes. Clustered gene programs are labeled. (B) Gene expression changes for the ‘leading-edge’ genes from the Hallmark-Oxidative Phosphorylation gene-set. Leading selection and ranking were based on the combo high (h) treatment set. Complex I gene family members (NDUFs) are bolded. (C) %Response and ΔBliss heat-maps highlighting the ‘synthetic lethality’ for the combination of electron transport chain inhibitors (the complex 1 inhibitor rotenone or the H+ATP synthase inhibitor oligomycin A) with glycolytic flux inhibitors (the GLUT1 inhibitor BAY-876 or the MCT2 inhibitor AZD-3965). (D) ExcessHSA values for well resolved sub-clusters of electron transport chain (group 4) or glycolytic flux (group 5) inhibitors originally identified in the correlation heat-map for the 45 drugs ‘all vs all’ screen (Fig. 2E). Ranking is based on the average ExcessHSA within each group. This plot is expanded in fig. S2. (E) Heat-map displaying unsupervised hierarchical clustering of fold-change of metabolites with respect to DMSO control, quantified by liquid chromatography/mass spectrometry (LC/MS). (F) Relative abundance of NAD+ and 3-phospho-glycerate in each treatment set with respect to the DMSO control. (G) Basal respiration and spare respiratory capacity, as assessed by Seahorse experiments, are reported for each treatment set. (H) Relative NAD+ concentration in combination treated (24h) cells with respect to the DMSO control, in the presence or absence of the NAD+ precursor nicotinamide mononucleotide (NMN), the NAMPT inhibitor daporinad, or both. (I) Cell death in combination-treated (24 hours) cells with respect to DMSO control, in the presence or absence of NMN, daporinad or both. **p < 0.005, ***p < 0.0005, ****p < 0.0001.

References

    1. Johung TB, Monje M, Diffuse Intrinsic Pontine Glioma: New Pathophysiological Insights and Emerging Therapeutic Targets, Curr Neuropharmacol 15, 88–97 (2016). - PMC - PubMed
    1. Jansen MHA, Van Vuurden DG, Vandertop WP, Kaspers GJL, Diffuse intrinsic pontine gliomas: a systematic update on clinical trials and biology, Cancer Treat Rev. 38, 27–35 (2012). - PubMed
    1. Cooney T, Lane A, Bartels U, Bouffet E, Goldman S, Leary SES, Foreman NK, Packer RJ, Broniscer A, Minturn JE, Shih CS, Chintagumpala M, Hassall T, Gottardo NG, Dholaria H, Hoffman L, Chaney B, Baugh J, Doughman R, Leach JL, Jones BV, Fouladi M, Warren KE, Monje M, Contemporary survival endpoints: an International Diffuse Intrinsic Pontine Glioma Registry study, Neuro-Oncol. 19, 1279–1280 (2017). - PMC - PubMed
    1. Schwartzentruber J, Korshunov A, Liu XY, Jones DT, Pfaff E, Jacob K, Sturm D, Fontebasso AM, Quang DA, Tönjes M, Hovestadt V, Albrecht S, Kool M, Nantel A, Konermann C, Lindroth A, Jäger N, Rausch T, Ryzhova M, Korbel JO, Hielscher T, Hauser P, Garami A. Klekner, Bognar L, Ebinger M, Schuhmann MU, Scheurlen W, Pekrun A, Frühwald MC, Roggendorf W, Kramm C, Dürken M, Atkinson J, Lepage P, Montpetit A, Zakrzewska M, Zakrzewski K, Liberski PP, Dong Z, Siegel P, Kulozik AE, Zapatka M, Guha A, Malkin D, Felsberg J, Reifenberger G, von Deimling A, Ichimura K, Collins VP, Witt H, Milde T, Witt O, Zhang C, Castelo-Branco P, Lichter P, Faury D, Tabori U, Plass C, Majewski J, Pfister SM, Jabado N, Driver mutations in histone H3.3 and chromatin remodelling genes in paediatric glioblastoma, Nature 482, 226–31 (2012). - PubMed
    1. Khuong-Quang DA, Buczkowicz P, Rakopoulos P, Liu XY, Fontebasso AM, Bouffet E, Bartels U, Albrecht S, Schwartzentruber J, Letourneau L, Bourgey M, Bourque G, Montpetit A, Bourret G, Lepage P, Fleming A, Lichter P, Kool M, von Deimling A, Sturm D, Korshunov A, Faury D, Jones DT, Majewski J, Pfister SM, Jabado N, Hawkins C, K27M mutation in histone H3.3 defines clinically and biologically distinct subgroups of pediatric diffuse intrinsic pontine gliomas, Acta Neuropathol 124, 439–447 (2012). - PMC - PubMed

Publication types

MeSH terms