. 2020 Jan 31;94(4):e01680-19.
doi: 10.1128/JVI.01680-19. Print 2020 Jan 31.

Glutaminolysis and Glycolysis Are Essential for Optimal Replication of Marek's Disease Virus

Affiliations

Glutaminolysis and Glycolysis Are Essential for Optimal Replication of Marek's Disease Virus

Nitish Boodhoo et al. J Virol. .

Abstract

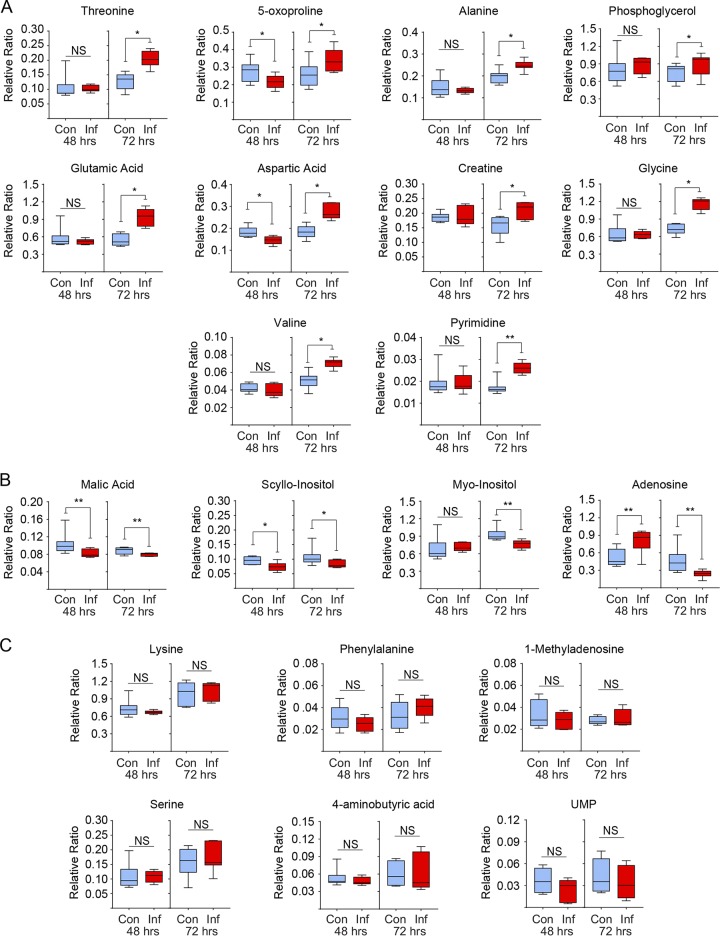
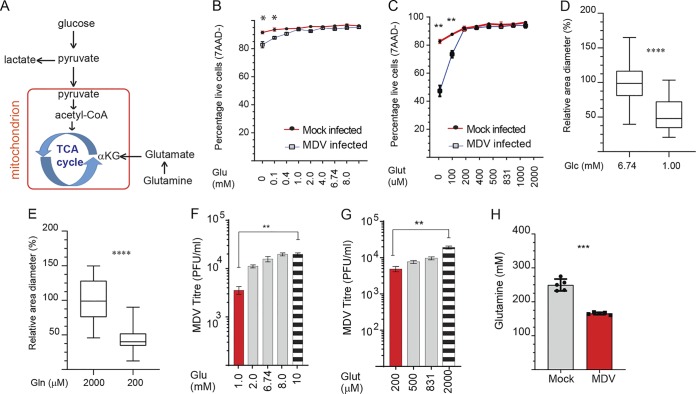
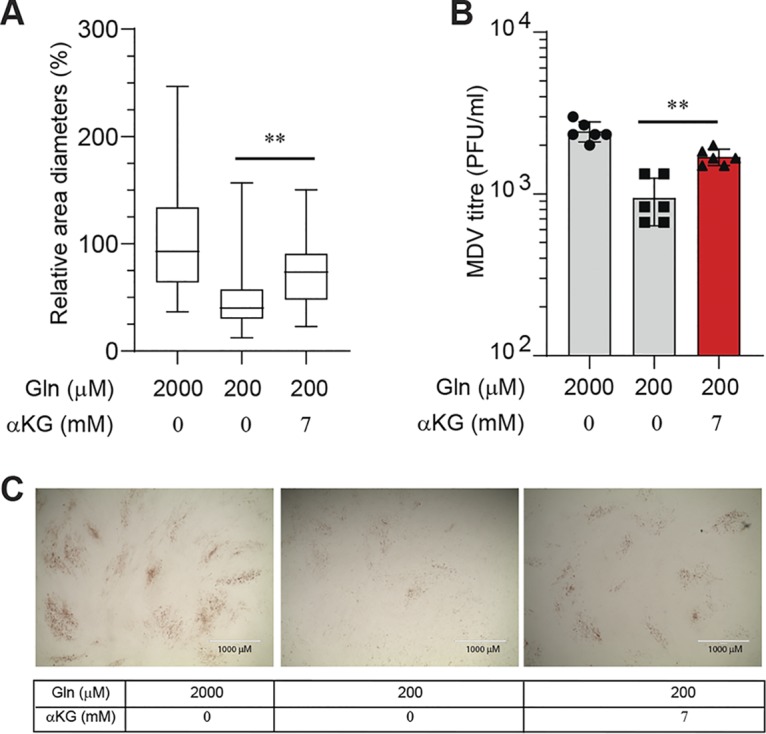
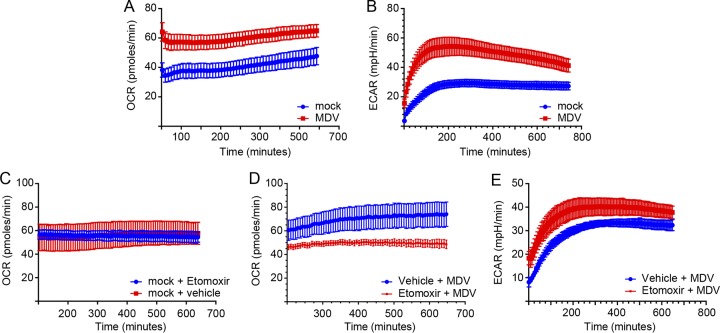
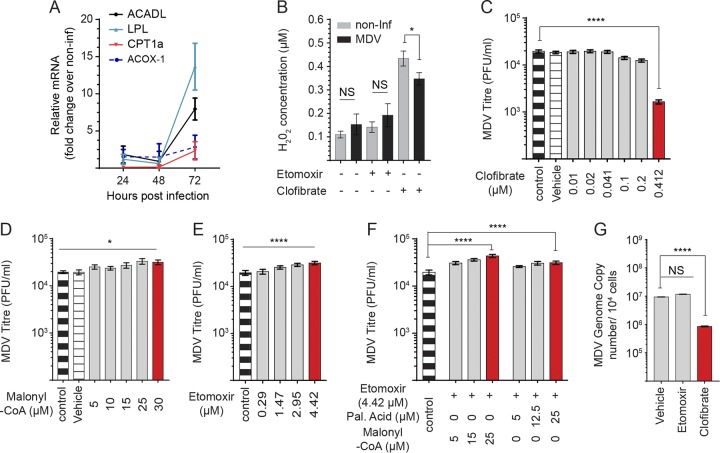
Viruses may hijack glycolysis, glutaminolysis, or fatty acid β-oxidation of host cells to provide the energy and macromolecules required for efficient viral replication. Marek's disease virus (MDV) causes a deadly lymphoproliferative disease in chickens and modulates metabolism of host cells. Metabolic analysis of MDV-infected chicken embryonic fibroblasts (CEFs) identified elevated levels of metabolites involved in glutamine catabolism, such as glutamic acid, alanine, glycine, pyrimidine, and creatine. In addition, our results demonstrate that glutamine uptake is elevated by MDV-infected cells in vitro Although glutamine, but not glucose, deprivation significantly reduced cell viability in MDV-infected cells, both glutamine and glucose were required for virus replication and spread. In the presence of minimum glutamine requirements based on optimal cell viability, virus replication was partially rescued by the addition of the tricarboxylic acid (TCA) cycle intermediate, α-ketoglutarate, suggesting that exogenous glutamine is an essential carbon source for the TCA cycle to generate energy and macromolecules required for virus replication. Surprisingly, the inhibition of carnitine palmitoyltransferase 1a (CPT1a), which is elevated in MDV-infected cells, by chemical (etomoxir) or physiological (malonyl-CoA) inhibitors, did not reduce MDV replication, indicating that MDV replication does not require fatty acid β-oxidation. Taken together, our results demonstrate that MDV infection activates anaplerotic substrate from glucose to glutamine to provide energy and macromolecules required for MDV replication, and optimal MDV replication occurs when the cells do not depend on mitochondrial β-oxidation.IMPORTANCE Viruses can manipulate host cellular metabolism to provide energy and essential biosynthetic requirements for efficient replication. Marek's disease virus (MDV), an avian alphaherpesvirus, causes a deadly lymphoma in chickens and hijacks host cell metabolism. This study provides evidence for the importance of glycolysis and glutaminolysis, but not fatty acid β-oxidation, as an essential energy source for the replication and spread of MDV. Moreover, it suggests that in MDV infection, as in many tumor cells, glutamine is used for generation of energetic and biosynthetic requirements of the MDV infection, while glucose is used biosynthetically.

Keywords: Marek’s disease virus; glucose; glutamine; virus replication.


Figures

FIG 1
FIG 1
Increased levels of metabolites involved in glutaminolysis in MDV-infected cells. GSxMS analysis of relative levels of characterized metabolites from mock-infected (control) and MDV-infected (RB1B) CEFs are shown at 48 hpi and 72 hpi. Box and whisker plots showing minimum and maximum relative levels of named metabolites either (A) significantly increased, (B) significantly decreased, or (C) showed no change as a result of MDV infection. Nonparametric Wilcoxon tests (Mann-Whitney) were used to assess normal distribution and test significance, with the results shown as mean ± SD. * (P = 0.01) and ** (P = 0.001) indicate a statistically significant difference compared to the control. NS indicates no significant difference. The experiment was performed in biological triplicates with six technical replicates per biological replicates. Con, control; Inf, infected.
FIG 2
FIG 2
Glucose and glutamine support MDV infection. (A) Glucose and glutamine utilization in the tricarboxylic acid (TCA) cycle during MDV infection. (B and C) Cell viability of mock-infected or RB1B-infected CEFs at 72 hpi. CEFs were mock infected or infected with RB1B (100 PFU), and the cells were cultured in cell culture medium containing various concentrations of exogenous (B) glucose (0, 0.1, 0.4, 1.0, 2.0, 4.0, 6.74, 8.0, and 10 mM) or (C) glutamine (0, 100, 200, 400, 500, 831, 1,000, and 2,000 μM). Plaque sizes were determined in cell culture medium with (D) low glucose (1.0 mM) or (E) low glutamine (200 μM) or complete medium (2,000 μM and 6.74 mM glucose) at 72 hpi. Plaque sizes are shown as box plots with minimums and maximums (20 plaques were measured for each condition). Analysis of MDV viral titer (PFU/ml) in the presence of exogenous (F) glucose (1.0, 2.0, 6.74, 8.0, and 10 mM) and (G) glutamine (400, 500, 851, and 2,000 μM) at 72 hpi. (H) Glutamine levels in supernatant of mock-infected and RB1B-infected CEFs. All viral titer experiments were performed in 6 replicates, and the data are representative of 3 independent experiments. ** (P = 0.001) and **** (P < 0.0001) indicate a statistically significant difference compared to vehicle-treated cells. NS indicates no significant difference.
FIG 3
FIG 3
α-ketoglutarate rescues MDV replication in low-glutamine conditions. MDV-infected CEFs were cultured in complete medium (2 mM glutamine, 6.74 mM glucose) or low glutamine (200 μM) with or without α-ketoglutarate (α-KG) (7 mM). CEFs were infected with RB1B (100 PFU) and 72 hpi; (A) MDV plaque size and (B) MDV titers were determined. Plaque sizes are shown as box plots with minimums and maximums (20 plaques were measured in each well). (C) Representative plaque images are shown. Scale bar, 1,000 μm. All experiments were performed in triplicate, and data are representative of 3 independent experiments.
FIG 4
FIG 4
MDV infection increases OCR and ECAR. (A) Oxygen consumption rate (OCR; pmol/min) and (B) extracellular acidification rate (ECAR; mpH/min) are shown for the mock-infected and MDV-infected CEFs. (C) The OCR (pmol/min) of mock-infected CEFs treated with either etomoxir (4.42 μM) or vehicle are shown for 12 h. MDV-infected CEFs were treated with etomoxir (4.42 μM) or vehicle during the first 12 h post-mock infection, and the (D) OCR and (E) ECAR were determined using a Seahorse XFp analyzer. All experiments were performed in triplicate, and data are representative of 3 independent experiments.
FIG 5
FIG 5
Inhibition of CPT1a increases MDV titer. (A) Fold-change expression of genes involved in fatty acid oxidation in MDV-infected CEFs at 24, 48, and 72 hpi. (B) Hydrogen peroxide (H2O2) synthesis (μM) in mock- or MDV-infected CEFs treated with etomoxir (4.42 μM) or clofibrate (0.41 μM) at 72 hpi. Analysis of MDV viral titer in MDV-infected CEFs treated with (C) clofibrate (0.01, 0.02, 0.041, 0.1, 0.2, and 0.41 μM), an agonist of PPAR-α, (D) malonyl-CoA (5, 10, 15, 25, and 30 μM), and (E) etomoxir (0.29, 1.47, 2.95, and 4.42 μM). (F) MDV viral titers are shown for MDV-infected CEFs treated with etomoxir (4.42 μM) or in combination with either palmitic acid (5, 12.5, and 25 μM) or malonyl-CoA (5, 15, and 25 μM). (G) MDV genome copy numbers per 104 cells (meq gene with reference ovotransferrin gene) were determined using qPCR in CEFs treated with etomoxir (4.42 μM) or clofibrate (0.41 μM). Nonparametric Wilcoxon tests (Mann-Whitney) and one-way ANOVA were used to assess normal distribution and test significance with the results shown as mean ± SD. * (P < 0.05) and **** (P < 0.0001) indicate a statistically significant difference compared to the control. NS indicates no significant difference. All experiments were performed in 6 replicates for plaque assays and 3 replicates for real-time PCR and fluorometric assays. All experiments were performed in triplicate, and data are representative of 3 independent experiments.

References

    1. Yu Y, Clippinger AJ, Alwine JC. 2011. Viral effects on metabolism: changes in glucose and glutamine utilization during human cytomegalovirus infection. Trends Microbiol 19:360–367. doi:10.1016/j.tim.2011.04.002. - DOI - PMC - PubMed
    1. Yang L, Venneti S, Nagrath D. 2017. Glutaminolysis: a hallmark of cancer metabolism. Annu Rev Biomed Eng 19:163–194. doi:10.1146/annurev-bioeng-071516-044546. - DOI - PubMed
    1. Wise DR, Thompson CB. 2010. Glutamine addiction: a new therapeutic target in cancer. Trends Biochem Sci 35:427–433. doi:10.1016/j.tibs.2010.05.003. - DOI - PMC - PubMed
    1. Wise DR, DeBerardinis RJ, Mancuso A, Sayed N, Zhang XY, Pfeiffer HK, Nissim I, Daikhin E, Yudkoff M, McMahon SB, Thompson CB. 2008. Myc regulates a transcriptional program that stimulates mitochondrial glutaminolysis and leads to glutamine addiction. Proc Natl Acad Sci U S A 105:18782–18787. doi:10.1073/pnas.0810199105. - DOI - PMC - PubMed
    1. Boodhoo N, Gurung A, Sharif S, Behboudi S. 2016. Marek’s disease in chickens: a review with focus on immunology. Vet Res 47:119. doi:10.1186/s13567-016-0404-3. - DOI - PMC - PubMed

Publication types

LinkOut - more resources