. 2019 Nov 20;10(1):5242.
doi: 10.1038/s41467-019-12941-9.

Distinct CD1d docking strategies exhibited by diverse Type II NKT cell receptors

Affiliations

Distinct CD1d docking strategies exhibited by diverse Type II NKT cell receptors

Catarina F Almeida et al. Nat Commun. .

Abstract

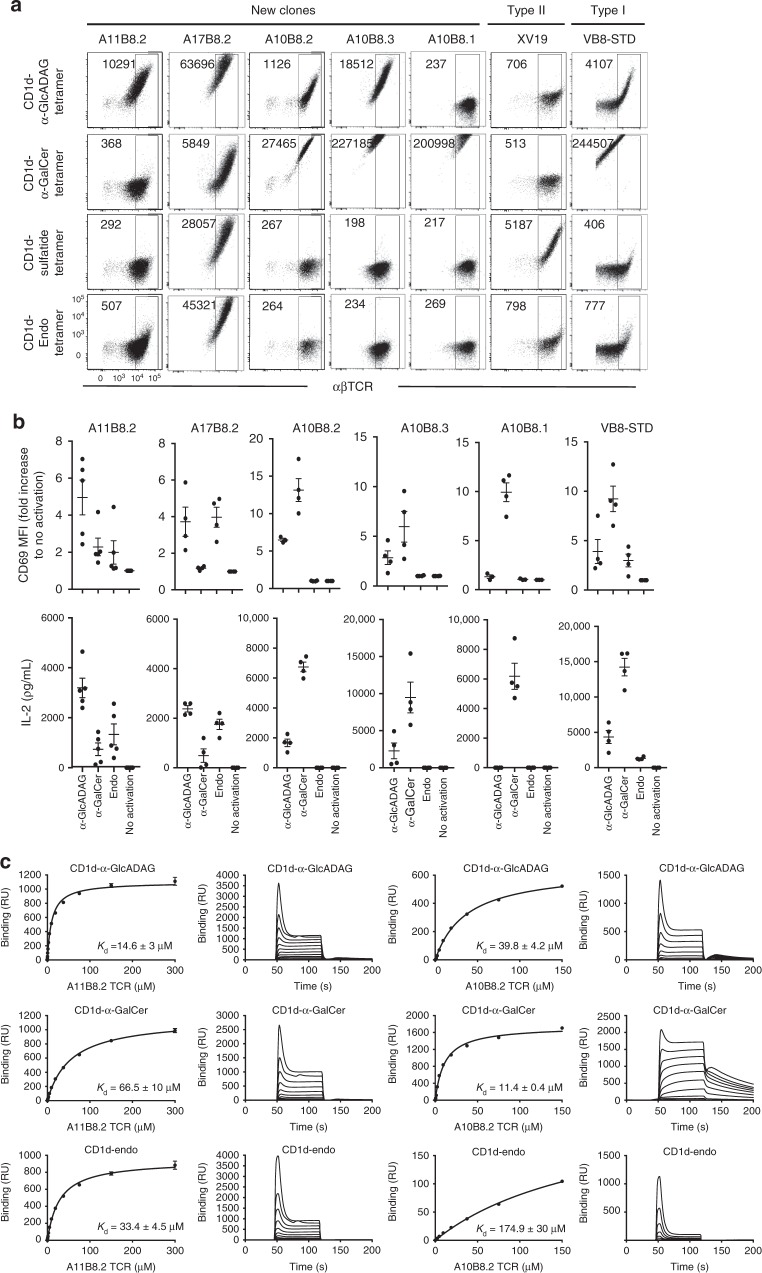
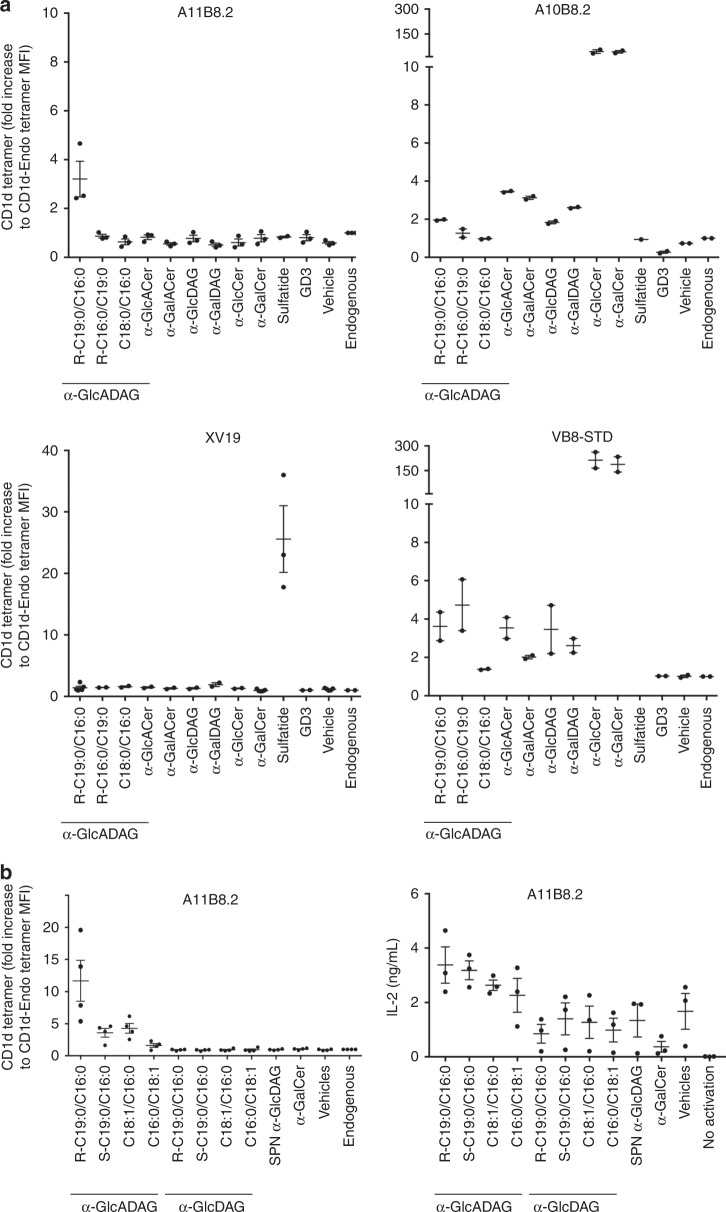
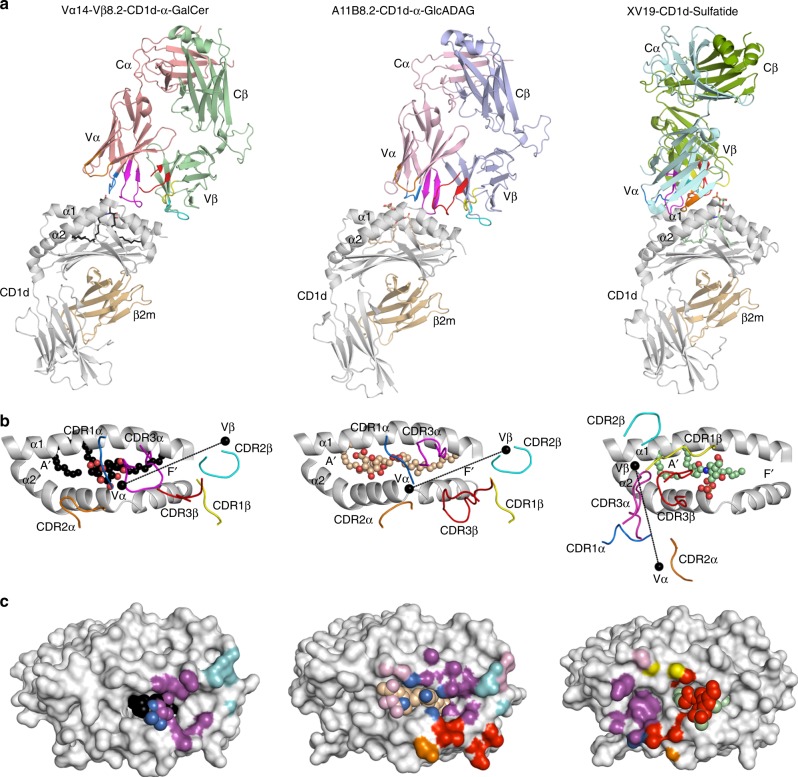
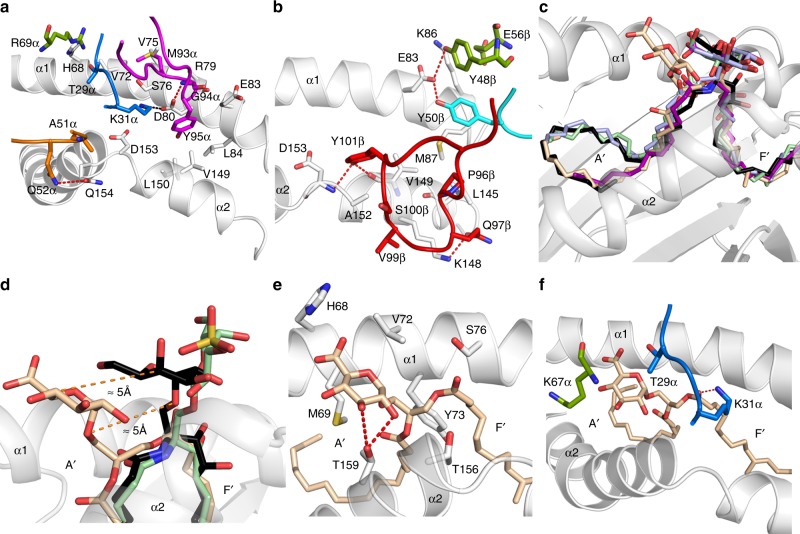
Type I and type II natural killer T (NKT) cells are restricted to the lipid antigen-presenting molecule CD1d. While we have an understanding of the antigen reactivity and function of type I NKT cells, our knowledge of type II NKT cells in health and disease remains unclear. Here we describe a population of type II NKT cells that recognise and respond to the microbial antigen, α-glucuronosyl-diacylglycerol (α-GlcADAG) presented by CD1d, but not the prototypical type I NKT cell agonist, α-galactosylceramide. Surprisingly, the crystal structure of a type II NKT TCR-CD1d-α-GlcADAG complex reveals a CD1d F'-pocket-docking mode that contrasts sharply with the previously determined A'-roof positioning of a sulfatide-reactive type II NKT TCR. Our data also suggest that diverse type II NKT TCRs directed against distinct microbial or mammalian lipid antigens adopt multiple recognition strategies on CD1d, thereby maximising the potential for type II NKT cells to detect different lipid antigens.


Conflict of interest statement

D.I.G. is a member of the scientific advisory board for Avalia Immunotherapies, a company that is developing NKT cell-based vaccines. The other authors declare no competing interests.

Figures

Fig. 1
Fig. 1
Identification of CD1d–α-GlcADAG tetramer+ NKT cells in mice. Flow cytometry analysis of anti-CD24-depleted thymocytes from BALB/c wt, Jα18−/− or CD1d−/− mice a. On the left, representative plots showing αβTCR versus CD1d–α-GalCer tetramer (top) or CD1d–α-GlcADAG tetramer staining (bottom) on gated 7AADB220CD11cCD11b thymocytes. Numbers next to outlined areas indicate percent cells in each gated population. Graphs on the right show the frequency and total cell numbers per whole thymus, of the population identified by the gate in each plot. Values are representative of a total of n = 7 individual experiments where in 5 (out of 7) experiments each black dot represents a pool of five mice (Exps. #1 and #2) or three mice (Exps. #3–5) thymi per group and in 2 (out of 7) experiments the grey dots represent individual thymi. **p = 0.0079, ****p < 0.0001 determined by the two tailed Mann–Whitney U test. b Representative plots of dual tetramer labelling of gated BALB/c thymocytes, showing CD1d–α-GlcADAG tetramer versus CD1d–α-GalCer tetramers on 7AADB220CD11cCD11bαβTCRint/hi cells. c CD4 versus CD8 expression (top), and CD44 versus CD69 (bottom) for each population that has been segregated based on CD1d–α-GlcADAG versus CD1d–α-GalCer tetramer gates in b. Plots are derived from four concatenated flow cytometry files acquired in a single experiment, where each file corresponds to a pool of four thymii (representative of two independent experiments). d Representative flow cytometry plots showing CD1d–α-GalCer versus CD1d–α-GlcADAG tetramer staining in both pre-enriched and post-enriched samples following CD1d–α-GlcADAG tetramer-associated magnetic enrichment (TAME). Plots depict gated 7AADB220CD11cCD11bαβTCRint/hi thymocytes. Numbers indicate percent cells in each gated population. Cells from each population (as identified by gates) were individually sorted into individual wells for TCR gene PCR amplification. In total three independent sorting experiments were performed, where experiments contained a pool of five mice (Exps. #1 and #2) or three mice (Exp. #3), respectively
Fig. 2
Fig. 2
Antigen reactivity of CD1d–α-GlcADAG tetramer+ sorted clones. a α-GlcADAG-, α-GalCer-, sulfatide-loaded or unloaded CD1d (CD1d-Endo) tetramer reactivity of BW58 cells expressing the nominated NKT cell TCRs. Representative plots from n = 5 experiments. Numbers depict mean fluorescence intensity (MFI) of CD1d tetramer within the gate encompassing 7AAD cells with equivalent surface αβTCR levels). b CD69 induction and IL-2 production from NKT TCR+ BW58 cell lines shown in a, following culture with immobilised CD1d–α-GlcADAG, CD1d–α-GalCer or CD1d–endo for 16 h. Graphs depict the mean CD69 fold difference relative to unstimulated control condition (top), or IL-2 detection in the supernatant (bottom). Error bars depict SEM. When CD1d was used at 10 μg/mL. Data is representative from n = 4 (n = 5 for A11B8.2) independent experiments. c SPR affinity measurement of soluble A11B8.2 and A10B8.2 NKT TCRs to CD1d–endo and CD1d loaded with α-GlcADAG and α-GalCer. The equilibrium curves are representative of one experiment performed in duplicate. Error bars refer to SEM of two replicates. The sensorgrams are representative of one experiment. Kd values are derived from duplicate runs from n = 3 (i) and n = 2 (ii) independent experiments performed
Fig. 3
Fig. 3
Fine Ag-specificity of BW58 cell lines expressing CD1d–α-GlcADAG-reactive NKT TCRs. a BW58 cell lines expressing the A11B8.2 and A10B8.2 TCRs were tested by flow cytometry for their ability to bind a panel of CD1d tetramers loaded with: Mycobacteria smegmatis natural occurring α-GlcADAG species (R-C19:0/C16:0) and two synthetic analogue variants (C16:0/C19:0) and (C18:0/C16:0); Sphingomonas spp. α-GlcACer C14:0 (GSL-1); Sphingomonas spp. α-GalAcer C14:0 (GSL-1′); Streptococcus pneumoniae α-GlcDAG C16:0/C18:1; Borrelia burgdorferi α-GalDAG C17:1/C16:0; α-GlcCer C20:2; α-GalCer C:20:2; sulfatide C24:1 and GD3. CD1d-endogenous and vehicle-loaded CD1d tetramers were included as controls. The VB8-STD type I NKT TCR+ and the XV19 type II NKT TCR+ cell lines were also included as a control. Graphs represent the mean fluorescence intensity (MFI) of CD1d tetramer staining within cells with similar TCR expression from duplicate values of n = 2 (n = 3 for A11B8.2) independent experiments and SEM. b Synthetic versions of the naturally occurring forms of α-GlcADAG bearing a methyl group with R-enantiomer or S-enantiomer (R-C19:0/C16:0 and S-C19:0/16:0) or the oleic version containing a double bond between C9 and C10 (C18:1/C16:0) or the isooleic variant (C16:0/C18:1), were loaded into CD1d tetramers and assessed for their ability to stain the A11B8.2 type II NKT TCR+ cell line (left), or to induce IL-2 following 16 h culture on platebound CD1d-lipid (right). Variants in which the glucoronic headgroup (–GlcA) was substituted for a glycosydic headgroup (–Glc) were also tested. S. pneumoniae α-GlcDAG (SPN α-GlcDAG), α-GalCer, vehicle-loaded and endogenous-loaded CD1d tetramers were included as controls. Graph on left represents the MFI of CD1d tetramer fold increase over CD1d-endogenous staining within cells with similar TCR expression from four independent experiments ± SEM, and graph on right depicts the mean IL-2 production of three independent experiments ± SEM
Fig. 4
Fig. 4
Overview of the mouse type I, type II XV19, and A11B8.2 NKT TCR ternary complexes. a Cartoon representation of the structure of the mouse type I (Vα14-Vβ8.2) TCR–CD1d–α-GalCer (PDB code: 3HE6) (left panel), mouse A11B8.2 TCR–CD1d–α-GlcADAG (middle panel), and mouse type II XV19 TCR–CD1d–α-GalCer (PDB code: 4EI5) (right panel). The CD1d and β2-microglobulin molecules are coloured in grey and light orange, respectively. Vα14-Vβ8.2 TCRα, salmon; Vα14-Vβ8.2 TCRβ, light green; A11B8.2 TCRα, light pink; A11B8.2 TCRβ, light blue; XV19 TCRβ, green; XV19 TCRα, cyan. The CDR loops are coloured as follows: CDR1α, blue; CDR2α, orange; CDR3α, magenta; CDR1β, yellow; CDR2β, cyan; CDR3β, red. α-GalCer, α-GlcADAG and sulfatide are coloured in black, wheat, pale green sticks, respectively. b Top view of the CD1d-binding cleft for each ternary complex. The lipids are shown as spheres and the centre of mass of the respective TRAV and TRBV variable domains are shown as black spheres. c TCR footprints on the CD1d–Ag molecular surface. The molecular surface of CD1d is coloured in light grey
Fig. 5
Fig. 5
Molecular interactions at the A11B8.2 TCR/CD1d–α-GlcADAG interface. a A11B8.2 TCR α-chain interactions with CD1d. b A11B8.2 TCR β-chain interactions with CD1d. c Superposition of NKT TCR–CD1d–microbial lipids ternary structures: CD1d–α-GlcADAG (wheat), CD1d–α-Gal-GSL (purple, PDB code: 3O8X), CD1d–α-GalCer (black, PDB code: 3HE6), CD1d–α-GlcDAG-s2 (light blue, PDB code: 3TA3), and CD1d–BbGL-2c (light green, 3O9W). d Superposition of CD1d–α-GlcADAG (wheat), CD1d–α-GalCer (black, PDB code: 3HE6), and CD1d–sulfatide (pale green, PDB code: 4EI5). CD1d is coloured in light grey. e CD1d interactions with α-GlcADAG headgroup. f A11B8.2 TCR interactions with α-GlcADAG. For clarity, only the hydrogen bonds are shown as red dashed lines and the α1- and α2-helices of CD1d are shown as cartoon representation and coloured in light grey. CDR loops are coloured as in Fig. 5. The framework residues are also coloured in green. CD1d is coloured in light grey
Fig. 6
Fig. 6
Binding modes of a panel of type II NKT cell lines. CD69 up-regulation on NKT TCR-expressing BW58 cell lines, following 16 h culture on plates coated with alanine (Ala) mutants of CD1d loaded with either α-GalCer, sulfatide, or α-GlcADAG. The level of activation elicited by each mutant is normalised to the response elicited by a control CD1d mutant (Asp226Ala). Graphs show the average of duplicate wells ± SEM from one experiment, which is representative of three independent assays. Corresponding surfaces of CD1d (PDB code: 1Z5L) are shown to the right of each graph, depicting residues that when mutated had no effect (dark grey); a 25–50% decrease (orange); a >50% decrease (red); and a >150% increase (green)

References

    1. Godfrey DI, Uldrich AP, McCluskey J, Rossjohn J, Moody DB. The burgeoning family of unconventional T cells. Nat. Immunol. 2015;16:1114–1123. doi: 10.1038/ni.3298. - DOI - PubMed
    1. Dhodapkar MV, Kumar V. Type II NKT. J. Immunol. 2017;198:1015–1021. doi: 10.4049/jimmunol.1601399. - DOI - PMC - PubMed
    1. Ambrosino E, et al. Cross-regulation between type I and type II NKT cells in regulating tumor immunity: a new immunoregulatory axis. J. Immunol. 2007;179:5126–5136. doi: 10.4049/jimmunol.179.8.5126. - DOI - PubMed
    1. Berzofsky JA, Terabe M. A novel immunoregulatory axis of NKT cell subsets regulating tumor immunity. Cancer Immunol. Immunother. 2008;57:1679–1683. doi: 10.1007/s00262-008-0495-4. - DOI - PMC - PubMed
    1. Exley MA, et al. A major fraction of human bone marrow lymphocytes are Th2-like CD1d-reactive T cells that can suppress mixed lymphocyte responses. J. Immunol. 2001;167:5531–5534. doi: 10.4049/jimmunol.167.10.5531. - DOI - PubMed

Publication types

MeSH terms