. 2019 Nov 20;10(1):5239.
doi: 10.1038/s41467-019-12850-x.

Mapping optogenetically-driven single-vessel fMRI with concurrent neuronal calcium recordings in the rat hippocampus

Affiliations

Mapping optogenetically-driven single-vessel fMRI with concurrent neuronal calcium recordings in the rat hippocampus

Xuming Chen et al. Nat Commun. .

Abstract

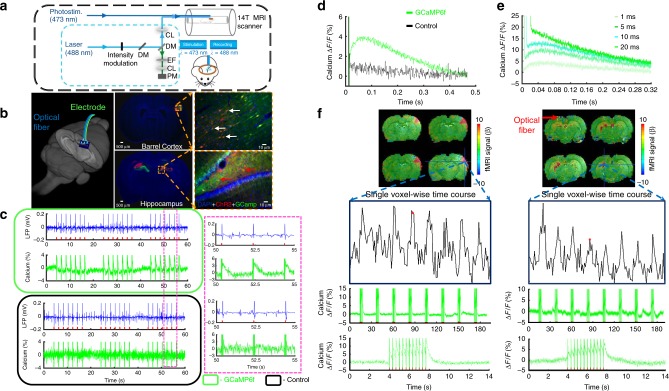
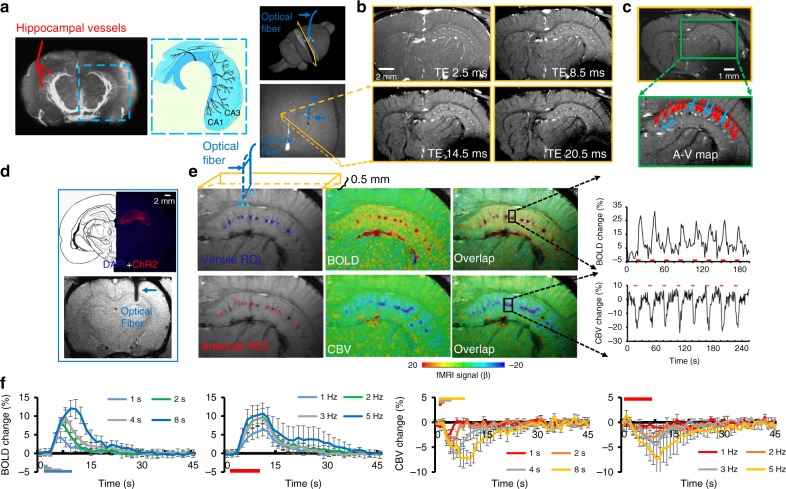
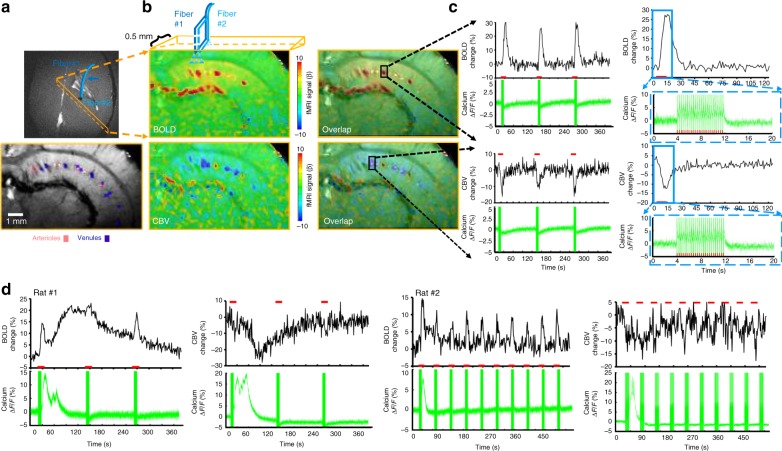
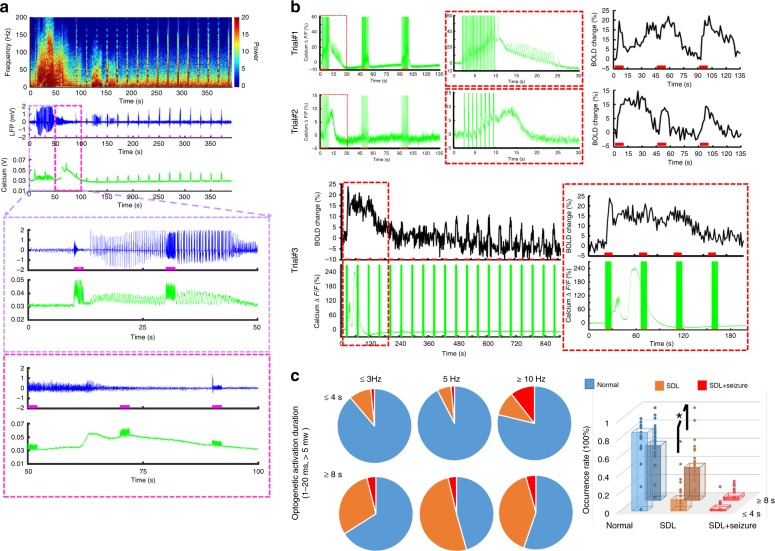
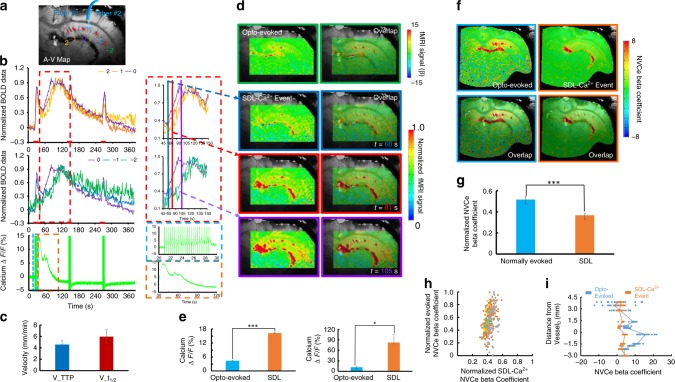
Extensive in vivo imaging studies investigate the hippocampal neural network function, mainly focusing on the dorsal CA1 region given its optical accessibility. Multi-modality fMRI with simultaneous hippocampal electrophysiological recording reveal broad cortical correlation patterns, but the detailed spatial hippocampal functional map remains lacking given the limited fMRI resolution. In particular, hemodynamic responses linked to specific neural activity are unclear at the single-vessel level across hippocampal vasculature, which hinders the deciphering of the hippocampal malfunction in animal models and the translation to critical neurovascular coupling (NVC) patterns for human fMRI. We simultaneously acquired optogenetically-driven neuronal Ca2+ signals with single-vessel blood-oxygen-level-dependent (BOLD) and cerebral-blood-volume (CBV)-fMRI from individual venules and arterioles. Distinct spatiotemporal patterns of hippocampal hemodynamic responses were correlated to optogenetically evoked and spreading depression-like calcium events. The calcium event-related single-vessel hemodynamic modeling revealed significantly reduced NVC efficiency upon spreading depression-like (SDL) events, providing a direct measure of the NVC function at various hippocampal states.


Conflict of interest statement

The authors declare no competing interests.

Figures

Fig. 1
Fig. 1
Optogenetically evoked Ca2+ recording with LFP or fMRI. a Schematic drawing for the light path of optogenetic activation and calcium recordings in the multi-modal fMRI platform (PM, photomultiplier; EF, emission filter; DM, dichroic mirror; CL, coupling lens). b Schematic drawing of optical fibers implantation to target the rat hippocampus in a 3D view (left). Channelrhodopsin (ChR2, red) and GcaMP6f (green) were co-expressed in the barrel cortex (BC, upper, white arrows) and hippocampus (lower, red arrows) with enlarged images (dashed box, right). c Simultaneous LFP (blue) and neuronal Ca2+ (green) traces in the hippocampus following optical stimulation (10 ms light pulse, 1 Hz, 7 s, 4 mW; upper: GCaMP6f expression; lower: control; right panel, enlarged view). d Averaged traces of optogenetically evoked Ca2+ spikes in the hippocampus (green: GCaMP6f expression; black: control). e Averaged traces of optogenetically evoked Ca2+ spikes with different widths of the light pulse (1, 5, 10, and 20 ms). f A representative color-coded BOLD fMRI map from the BC (left) and hippocampus (optical fiber insertion trace: red arrow), together with associated fMRI time courses (lower, top) and concurrent neuronal Ca2+ signals (lower, middle) in the block-design paradigm (illumination: 10 ms light pulse, 3 Hz, 4 s, 5 mW, zoomed views are averaged evoked Ca2+ signals from one epoch)
Fig. 2
Fig. 2
Single-vessel hippocampal BOLD and CBV-weighted fMRI. a The magnetic resonance angiography (MRA) image shows major vascular branches penetrating the rat hippocampus (middle image is the schematic drawing of the hippocampal transverse plane of vessels aligned in parallel [modified from Peter Coyle (1976)]). The 3D view of the 2D slice alignment to cover the transverse hippocampal structure (lower image is the horizontal view to show the 2D slice with 40° to the midline to cross the penetrating vessels, dark hole: the fiber optic tip). b Representative images of 2D MGE slices from the hippocampus at different TEs. c A–V map derived from images in b. Arterioles and venules appear as bright and dark dots, respectively [zoomed view of hippocampal arterioles (bright dots, red arrows) and venules (dark dots, blue arrows)]. d A histological section shows ChR2 expressed in the hippocampus (upper). The T2*-weighted (T2*-W) image shows the optical fiber inserted into the hippocampus (lower, blue arrow). e Venule (blue)/arteriole (red) ROIs on A–V maps (left). Evoked BOLD (upper) and CBV-weighted (lower) fMRI maps on the same 2D slice (center) and overlap (active voxels are in purple in overlap images). Time courses of the evoked BOLD and CBV-weighted fMRI with the block-design paradigm from a representative venule (upper) and arteriole (lower) ROI (illumination: 10 ms light pulse, 3 Hz, 4 s, 5 mW). f Averaged BOLD (upper) and CBV-weighted (lower) fMRI responses from different stimulation durations (1, 2, 4, and 8 s) and frequencies (1, 2, 3, and 5 Hz) (n = 4, mean ± SEM)
Fig. 3
Fig. 3
Concurrent fMRI and Ca2+ recording in the hippocampus. a Schematic drawing of the hippocampal single-vessel fMRI with two optical fibers (blue arrow) for optogenetic stimulation and Ca2+ recordings. A representative A–V map shows individual arterioles (bright dots, red markers) and venules (dark dots, purple markers) on the same 2D slice. b Evoked BOLD (upper) and CBV-weighted (lower) fMRI maps and overlapping maps on the A–V map. c Time courses of evoked BOLD and CBV-weighted fMRI signal from a single venule (upper) or arteriole (lower) ROI with the concurrent neuronal Ca2+ signal (illumination: 10 ms light pulse, 3 Hz, 8 s, 5 mW). Averaged time course of the fMRI signal and the evoked Ca2+ spike train. d A representative time course of single-vessel BOLD and CBV-weighted fMRI signal changes with concurrent hippocampus SDL-Ca2+ responses (illumination: 10 ms light pulse, 3 Hz, 8 s, 5 mW)
Fig. 4
Fig. 4
SDL and seizure-based Ca2+ recordings with LFP or fMRI. a Representative traces of SD and seizure spikes in the hippocampus: power spectra of LFP (top), LFP trace (middle), and Ca2+ signal (bottom). Zoomed views of the area are outlined in the upper panel (purple/pink box) (illumination: 10 ms light pulse, 50 Hz, 2 s, 5.5 mW). b Representative trials (3 rats) of neuronal Ca2+ signal (green) with simultaneous single-vessel BOLD fMRI signal (black) (upper: 10 ms light pulse, 1 Hz, SDL and 3 Hz, SDL + seizure Ca2+ events, 8 s, 6 mW; lower: 20 ms light pulse, 5 Hz, 8 s, 5.5 mW). Zoomed views of the area are outlined in the red box. c Quantification of the occurrence percentage of normal, SDL and SDL + seizure Ca2+ events as a function of optogenetic light pulse frequency (≤3 Hz, 5 Hz, ≥10 Hz) and stimulation duration ((≤4 s, 382 trials, ≥8 Hz, 448 trials, n = 28 rats). Induction rate of SDL-Ca2+ events in trials with 8 s stimulation duration is significantly higher than that of trials with 4 s stimulation (*p = 0.001, n = 28 rats, mean ± SEM)
Fig. 5
Fig. 5
Ca2+-based NVCe mapping. a Numbered venules on the A–V map. Venule 0 (purple) is the one closest to the optical fiber tip, venules 1, 2 and −1, −2 are vessels with different directions in the hippocampal structure. b Time courses of normalized single-vessel BOLD fMRI signal from individual venules, as shown in Fig. 4a, are plotted (top) with the concurrent neuronal Ca2+ signal (bottom). Insets are the magnified figures of the dashed box in the left to highlight the SDL-Ca2+ events and coupled single-vessel BOLD responses (illumination: 10 ms light pulse, 3 Hz, 8 s, 5 mW). c Velocity of SDL-Ca2+ events spreading between different hippocampal venules with different time to peak (TTP) and t1/2 (18 vessels from 3 rats, mean ± SEM). d Representative color-coded BOLD fMRI map (optogenetically evoked) from the hippocampus (upper). Time-lapsed function maps and semi-transparent overlapping images on the A–V map at 60 s (blue box), 81 s (red box), and 105 s (purple box) during the trial. e Amplitude of optogenetically evoked Ca2+ signals is significantly lower than that of SDL-Ca2+ spikes in the hippocampus (left: *p = 6.22e − 11, 10 trials from a representative rat; right: *p = 0.028, n = 4 rats). f NVCe coefficient map for both optogenetically evoked and SDL-Ca2+ events. g Z-score normalized NVCe coefficients of optogenetically evoked events are significantly higher than those of SDL-Ca2+ events (n = 4 rats, *p = 0.003). h Scatter plot of z-score normalized NVCe coefficients from optogenetically evoked vs. SDL-Ca2+ events from each trial in four representative rats. i Z-score normalized NVCe coefficients from individual vessels were plotted as a function of vessel distance for both optogenetically evoked and SDL-Ca2+ events in a representative rat

References

    1. Ogawa S, et al. Intrinsic signal changes accompanying sensory stimulation: functional brain mapping with magnetic resonance imaging. Proc. Natl. Acad. Sci. USA. 1992;89:5951–5955. doi: 10.1073/pnas.89.13.5951. - DOI - PMC - PubMed
    1. Kwong KK, et al. Dynamic magnetic resonance imaging of human brain activity during primary sensory stimulation. Proc. Natl. Acad. Sci. USA. 1992;89:5675–5679. doi: 10.1073/pnas.89.12.5675. - DOI - PMC - PubMed
    1. Bandettini PA, Wong EC, Hinks RS, Tikofsky RS, Hyde JS. Time course EPI of human brain function during task activation. Magn. Reson. Med. 1992;25:390–397. doi: 10.1002/mrm.1910250220. - DOI - PubMed
    1. Kim SG, Ogawa S. Biophysical and physiological origins of blood oxygenation level-dependent fMRI signals. J. Cereb. Blood Flow Metab. 2012;32:1188–1206. doi: 10.1038/jcbfm.2012.23. - DOI - PMC - PubMed
    1. Logothetis NK. What we can do and what we cannot do with fMRI. Nature. 2008;453:869–878. doi: 10.1038/nature06976. - DOI - PubMed

Publication types