. 2019 Nov 20;9(1):17152.
doi: 10.1038/s41598-019-53676-3.

Vasoactive Intestinal Peptide induces glucose and neutral amino acid uptake through mTOR signalling in human cytotrophoblast cells

Affiliations

Vasoactive Intestinal Peptide induces glucose and neutral amino acid uptake through mTOR signalling in human cytotrophoblast cells

Fatima Merech et al. Sci Rep. .

Abstract

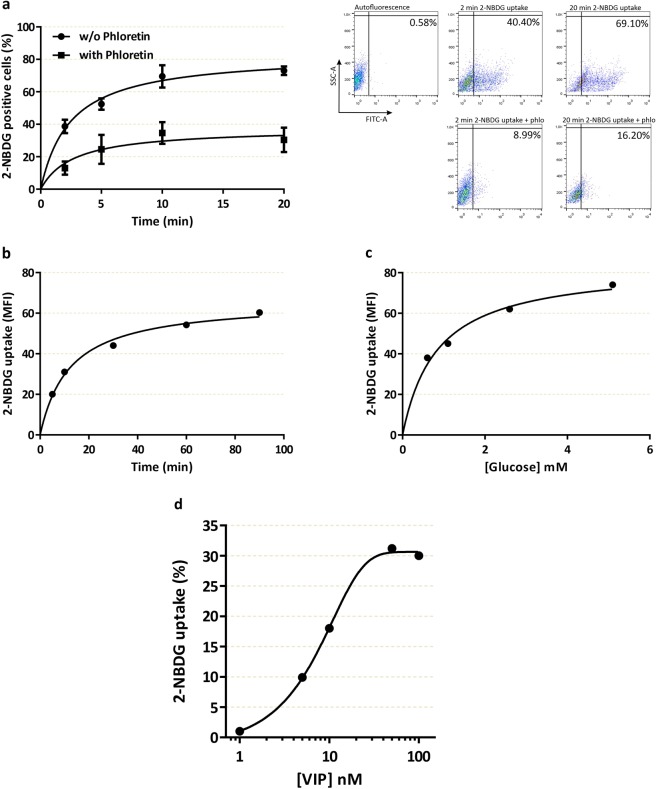
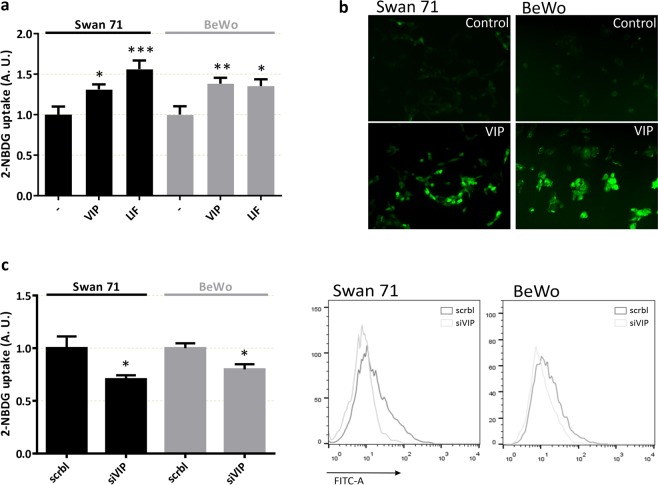
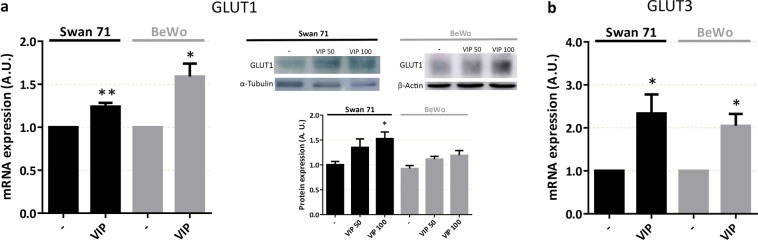
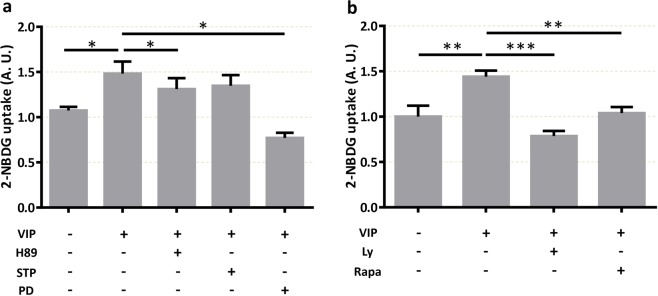
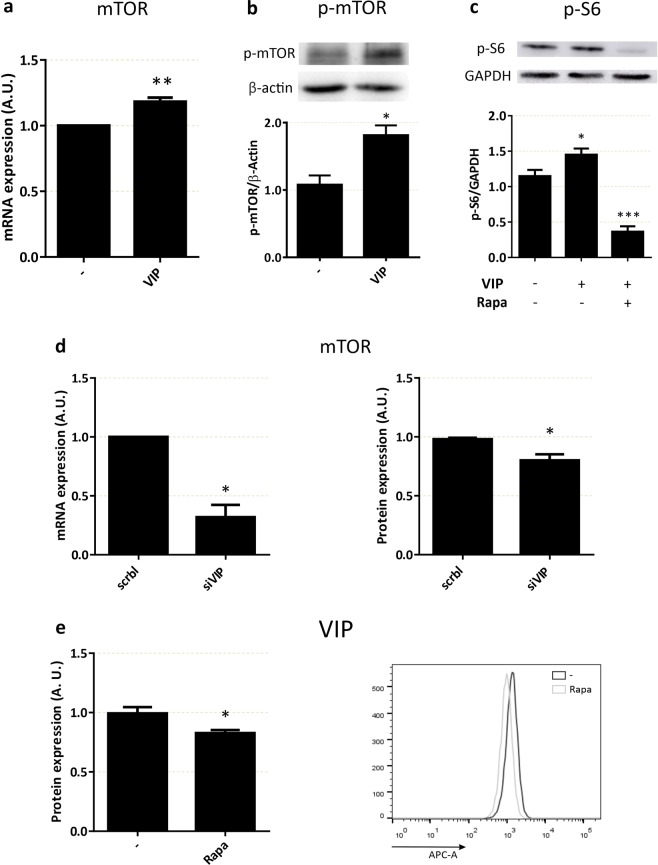
The transport of nutrients across the placenta involves trophoblast cell specific transporters modulated through the mammalian target of rapamycin (mTOR). The vasoactive intestinal peptide (VIP) has embryotrophic effects in mice and regulates human cytotrophoblast cell migration and invasion. Here we explored the effect of VIP on glucose and System A amino acid uptake by human trophoblast-derived cells (Swan 71 and BeWo cell lines). VIP activated D-glucose specific uptake in single cytotrophoblast cells in a concentration-dependent manner through PKA, MAPK, PI3K and mTOR signalling pathways. Glucose uptake was reduced in VIP-knocked down cytotrophoblast cells. Also, VIP stimulated System A amino acid uptake and the expression of GLUT1 glucose transporter and SNAT1 neutral amino acid transporter. VIP increased mTOR expression and mTOR/S6 phosphorylation whereas VIP silencing reduced mTOR mRNA and protein expression. Inhibition of mTOR signalling with rapamycin reduced the expression of endogenous VIP and of VIP-induced S6 phosphorylation. Our findings support a role of VIP in the transport of glucose and neutral amino acids in cytotrophoblast cells through mTOR-regulated pathways and they are instrumental for understanding the physiological regulation of nutrient sensing by endogenous VIP at the maternal-foetal interface.


Conflict of interest statement

The authors declare no competing interests.

Figures

Figure 1
Figure 1
Characterization of 2-NBDG uptake and the effect of VIP in trophoblast cells. Swan 71 cell line was grown until subconfluence, then the cells were washed with cold PBS and medium was replaced by glucose free medium. 2-NBDG was added for different times (a,b) or 10 min (c,d), cells were washed with cold PBS and flow cytometry was performed. Results in (b–d) are express as the difference between without/with 1 mM Phloretin. (a) 2-NBDG positive cells at 2, 5, 10 and 20 min in absence/presence of 1 mM Phloretin. Dot plots are representative of autofluorescence control and 2 and 20 min of 2-NBDG incubation in absence/presence of 1 mM Phloretin. Each point represents the Mean ± S.E.M. (b) Mean fluorescence intensity (MFI) after incubation with 2-NBDG for 5, 10, 30, 60, and 90 min. The points are representative of 3 different experiments. (c) MFI after 10 min incubation with 2-NBDG in glucose free medium supplemented with 0.5, 1, 2.5, 5 mM of glucose. The points are representative of 3 different experiments. (d) 2-NBDG uptake by trophoblast cells incubated with 1–100 nM VIP expressed as percent vs. basal value taken as 1. VIP was added 10 min before the addition of 2-NBDG for another 10 min.
Figure 2
Figure 2
Relevance of trophoblast endogenous VIP for glucose uptake in Swan 71 and BeWo cells. Trophoblast cells (Swan 71 and BeWo cell lines) were grown as in Fig. 1. 2-NBDG was added for 10 min (a,c) or 3 min (b), cells were washed with cold PBS and flow cytometry was performed. Results are expressed as the difference between without/with 1 mM Phloretin. (a) 2-NBDG uptake of cells incubated with 50 nM VIP or 50 ng/ml LIF 10 min before the addition of 2-NBDG (n = 9 for both Swan 71 and BeWo cell lines in VIP treatment and n = 6 in LIF treatment). (b) Representative fluorescence microscopy of both cell lines after 3 min incubation with 2-NBDG without/with 50 nM VIP. (c) 2-NBDG uptake after VIP was knocked down for 72 h and 2-NBDG were added for 10 min (n = 4). ANOVA with Dunnett’s multiple comparisons against basal condition (a) or Student’s t-test was used (c). Results are expressed as Mean ± S.E.M. *p < 0.05, **p < 0.01, ***p < 0.001.
Figure 3
Figure 3
VIP induces the expression of glucose transporters GLUT1 and GLUT3 in human trophoblast-derived cells. (a,b) Cells were seeded until subconfluence and 50/100 nM VIP was added for 6 h in DMEM-F12 2% FBS and then cells were harvested. For mRNA analysis, qRT-PCR was performed and results were analysed employing 2-ΔΔCT method normalized to the endogenous GAPDH gene control. For protein analysis, Western Blot was performed and GLUT1 expression was normalized to α-Tubulin or β-Actin. The image shows cropped lines corresponding to α-Tubulin, β-Actin and GLUT1. Blots were run under the same experimental conditions. Full-length gels are presented in Supplementary Fig. S1. Student’s t test or ANOVA with Dunnett’s multiple comparisons against basal condition was used to compare between conditions ((a) GLUT1 mRNA: n = 6 for Swan 71 and BeWo; GLUT1 protein: n = 3 for Swan 71 and BeWo; (b) GLUT3 mRNA: n = 5 for Swan 71 and n = 4 for BeWo). Results are expressed as Mean ± S.E.M. *p < 0.05, **p < 0.01.
Figure 4
Figure 4
VIP induces glucose uptake through PKA, MAPK, PI3K and mTOR pathways in human trophoblast cells. BeWo cells were cultured as in Fig. 2. Cells were pre-incubated with the corresponding specific kinases inhibitors for 20 min before the addition of 50 nM VIP for 10 min and 2-NBDG for another 10 min. Cells were washed with cold PBS and flow cytometry was performed. (a) 2-NBDG uptake in absence/presence of 10 µM H89 (PKA inhibitor), 5 nM STP (PKC inhibitor) or 50 µM PD98059 (MEK inhibitor). (b) 2-NBDG uptake in absence/presence of 10 μM Ly294502 (PI3K inhibitor) or 100 nM rapamycin (mTOR inhibitor) (n = 5). RM-one way-ANOVA or ANOVA, with Dunnett’s multiple comparisons test, was used to compare against VIP treatment. Results are expressed as Mean ± S.E.M. *p < 0.05, **p < 0.01, ***p < 0.001.
Figure 5
Figure 5
VIP stimulates System A amino acid activity and SNATs expression in human trophoblast cells. (a,b) Cells were seeded until subconfluence and then incubated with 50 nM VIP in DMEM-F12 2% FBS for 20 min. Cells were washed with Tyrode’s buffer with/without Na+ and 14C-MeAIB were added for another 8 min. Cells were washed with cold Tyrode’s buffer without Na+ and lysed with distilled H2O for 1 h. Liquid scintillation counting was performed. (a) Characterization of 14C-MeAIB Na+-dependant uptake in Swan 71 and BeWo cell lines (n = 4). Results are expressed in pmol 14C-MeAIB. (b) Na+-dependent 14C-MeAIB uptake in the absence/presence of 50 nM VIP. Results are expressed as the difference between with/without Na+ (n = 4), in pmol 14C-MeAIB.mg prot−1.min-1. (c) mRNA and protein expression of SNAT1. Cells were cultured as in Fig. 3 and 50 nM VIP was added for 6 h. Cells were harvested for mRNA analysis by qRT-PCR (n = 4) or protein analysis by flow cytometry (n = 5). (d) mRNA expression of SNAT2. Cells were cultured as in (c) (n = 7). For mRNA analysis, qRT-PCR was performed and results were analysed employing 2−ΔΔCT method normalized to the endogenous GAPDH gene control. Student’s t test was used to compare between conditions. Results are expressed as Mean ± S.E.M. *p < 0.05, **p < 0.01.
Figure 6
Figure 6
Cross-regulation of mTOR and VIP in trophoblast cells. (a) mTOR mRNA expression. Swan 71 cells were seeded and treated as in Fig. 3, in absence/presence of 50 nM VIP (n = 6), qRT-PCR was performed and results were analysed employing 2−ΔΔCT method normalized to the endogenous GAPDH gene control. (b) mTOR phosphorylation. Cells were incubated in absence/presence of 50 nM VIP for 20 min, Western Blot was performed and p-mTOR was normalized to β-Actin. The image shows cropped lines corresponding to p-mTOR and β-Actin. Blots were run under the same experimental conditions (n = 4). (c) S6 phosphorylation. Cells were incubated in absence/presence of 50 nM VIP for 20 min. 100 µM rapamycin were added 20 min before the stimulus, Western Blot was performed and p-S6 was normalized to GAPDH. The image shows cropped lines corresponding to p-S6 and GAPDH. Blots were run under the same experimental conditions (n = 3). Full-length gels are presented in Supplementary Fig. S1. (d) mTOR expression in VIP-silenced cells. Swan 71 cells were seeded, VIP was knocked-down for 72 h and treated as in (a) for mRNA expression, or flow cytometry was performed for protein expression (n = 3). (e) VIP expression. Cells were cultured as in Fig. 3, then 100 µM of rapamycin was added for 24 h. Protein secretion was inhibited by Stop Golgi® incubation for 4 h and cells were subjected to VIP immunostaining and quantification by flow cytometry (n = 3). ANOVA with Dunnett’s multiple comparisons against basal condition or Student’s t test was used to compare between conditions. Results are expressed as Mean ± S.E.M. *p < 0.05, **p < 0.01, *** p < 0.001.

Similar articles

Cited by

References

    1. Dimasuay KG, Boeuf P, Powell TL, Jansson T. Placental responses to changes in the maternal environment determine fetal growth. Front. Physiol. 2016;7:1–9. doi: 10.3389/fphys.2016.00012. - DOI - PMC - PubMed
    1. Chassen, S. & Jansson, T. Complex, coordinated and highly regulated changes in placental signaling and nutrient transport capacity in IUGR. Biochim. Biophys. Acta - Mol. Basis Dis, 10.1016/j.bbadis.2018.12.024 (2019). - PMC - PubMed
    1. Brett KE, Ferraro ZM, Yockell-Lelievre J, Gruslin A, Adamo KB. Maternal–Fetal nutrient transport in pregnancy pathologies: The role of the placenta. Int. J. Mol. Sci. 2014;15:16153–16185. doi: 10.3390/ijms150916153. - DOI - PMC - PubMed
    1. Gallo LA, Barrett HL, Dekker Nitert M. Review: Placental transport and metabolism of energy substrates in maternal obesity and diabetes. Placenta. 2017;54:59–67. doi: 10.1016/j.placenta.2016.12.006. - DOI - PubMed
    1. Mahendran D, et al. Na+ transport, H+ concentration gradient dissipation, and system A amino acid transporter activity in purified microvillous plasma membrane isolated from first-trimester human placenta: Comparison with the term microvillous membrane. Am. J. Obstet. Gynecol. 1994;171:1534–1540. doi: 10.1016/0002-9378(94)90397-2. - DOI - PubMed

Publication types