. 2019 Nov 20;9(1):17161.
doi: 10.1038/s41598-019-52985-x.

Identification of Circulating Serum Multi-MicroRNA Signatures in Human DLBCL Models

Affiliations

Identification of Circulating Serum Multi-MicroRNA Signatures in Human DLBCL Models

Afshin Beheshti et al. Sci Rep. .

Abstract

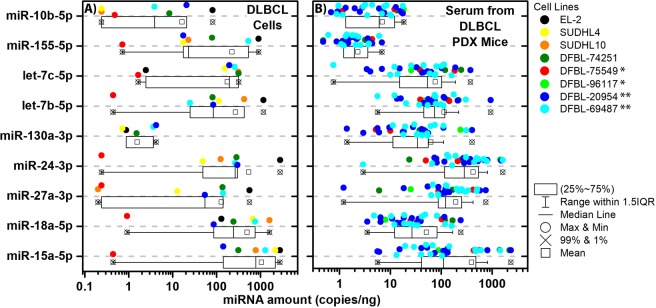
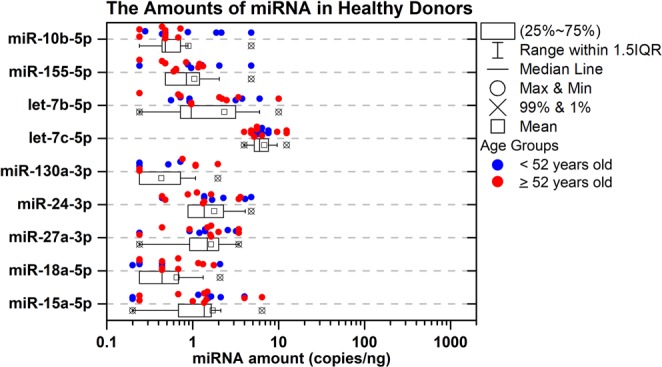
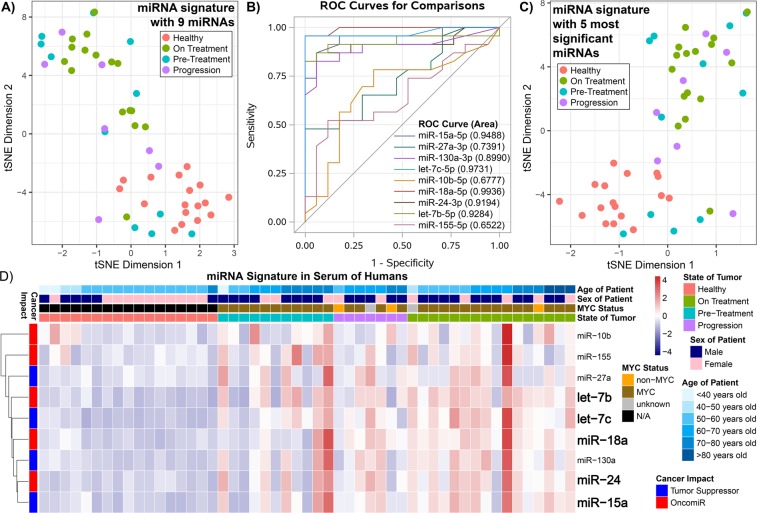
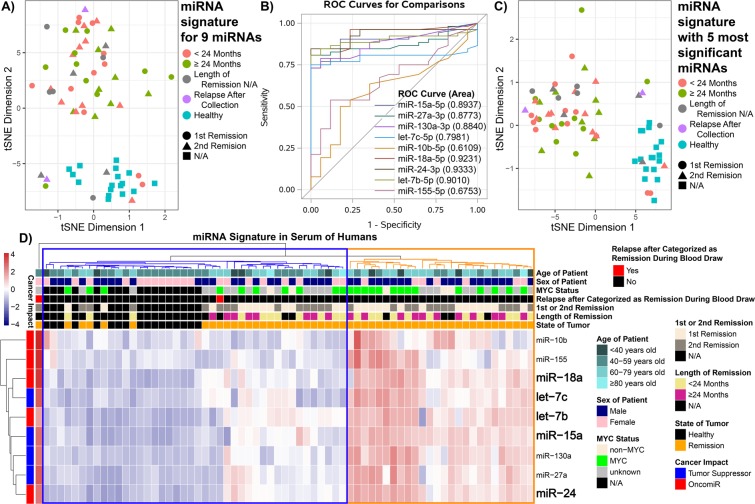
There remains a need to identify new sensitive diagnostic and predictive blood-based platforms in lymphoma. We previously discovered a novel circulating microRNA (miRNA) signature in a Smurf2-deficient mouse model that spontaneously develops diffuse large B-cell lymphoma (DLBCL). Herein, we investigated this 10-miRNA signature (miR-15a, let-7c, let-7b, miR-27a, miR-10b, miR-18a, miR-497, miR-130a, miR24, and miR-155) in human lymphoma cell lines, mice engrafted with patient-derived xenografts (PDXs), and DLBCL patient serum samples leveraging systems biology analyses and droplet digital PCR (ddPCR) technology. Overall, 90% of the miRNAs were enriched in PDX DLBCL models and human lymphoma cell lines. Circulating miRNAs from the serum of 86 DLBCL patients were significantly increased compared with healthy controls and had similar patterns to the murine models. Strikingly, miRNAs were identified up to 27-fold higher levels in the serum of PDX-bearing mice and human patients compared with lymphoma cell lysates, suggesting a concentration of these factors over time within sera. Using cut-points from recursive partitioning analysis, we derived a 5-miRNA signature (let-7b, let-7c, miR-18a, miR-24, and miR-15a) with a classification rate of 91% for serum from patients with DLBCL versus normal controls. In addition, higher levels of circulating let-7b miRNA were associated with more advanced stage disease (i.e., III-IV vs. I-II) in DLBCL patients and higher levels of miR-27a and miR-24 were associated with MYC rearrangement. Taken together, circulating multi-miRNAs were readily detectable in pre-clinical cell line and human lymphoma models as well as in DLBCL patients where they appeared to distinguish clinico-pathologic subtypes and disease features.


Conflict of interest statement

The authors declare no competing interests.

Figures

Figure 1
Figure 1
The amounts of miRNA in the DLBCL cell lines and PDX murine models. (A) Boxplot showing the amount of miRNA (copies/ng) for each miRNA part of the miRNA signature that are contained in commercial DLBCL cell lines (SUDHL4 and SUDHL10), primary human lymphoma cells isolated from discarded tumor biopsies (EL-2), and PDX cell lines (DFBL-74251, DFBL-69487, DFBL-75549, and DFBL-20954). Each cell line represents a biological replicate for DLBCL for a total of n = 7 DLBCL cell lines. (B) Box plots of the amount of miRNA (copies/ng) quantified from the serum of PDX mice implanted with the following PDX cell lines: DFBL-74251 (n = 2), DFBL-69487 (n = 13), DFBL-75549 (n = 2), DFBL-20954 (n = 13), and DFBL-96117 (n = 2). Single MYC + (*) and MYC/BCL2 Double-Hit (**) DLBCL cells are designated in the figure legend next to the cell names. In the boxplots the whiskers show the range of the outliers, with maximum and minimum values as “o” and the 1st and 99th percentile outliers as “X”, the mean values are shown as “□”, and the median line is shown as “—”. The data points for each sample is shown on the top of the boxplots and are color coded to match the specific cell lines.
Figure 2
Figure 2
The amount of miRNA in healthy subjects. A boxplot of the amount of miRNA (copies/ng) quantified from the serum of n = 17 healthy subjects. The whiskers show the range of the outliers, with maximum and minimum values as “o” and the 1st and 99th percentile outliers as “X”, the mean values are shown as “□”, and the median line is shown as “—”. The data points for each sample is shown on the top of the boxplots and are color coded for <52 years old as blue and ≥52 years old as red.
Figure 3
Figure 3
Comparison of the circulating miRNA signature among DLBCL patients and healthy subjects. (A) t-Distributed Stochastic Neighbor Embedding (t-SNE) plot showing the distribution of the overall response of the circulating miRNA signature (containing all 9 miRNAs) from the serum between the healthy subjects (red), DLBCL patients pre-treatment (blue), DLBCL patients progression after treatment (purple), and DLBCL patients which are currently on treatment (olive). (B) Receiver Operating Curves (ROCs) for the Progression/On-treatment (n = 23) Compared to Healthy (n = 17) Samples. The area under the curve is shown in parentheses. (C) t-SNE plot determined by using the 5 most significant miRNAs (Supplemental Table S4 and (B)) for the same patient samples as in the previous plot. (D) Heatmap representing hierarchical clustering of the circulating miRNA signature. The specific subject information for age, MYC status, state of tumor, and miRNA cancer impact is shown. For all plots the miRNA amounts were log2(x + 1) transformed.
Figure 4
Figure 4
Analysis of circulating miRNAs between healthy subjects and DLBCL patients based on disease status. The log2 fold-change values directly comparing (A) the average circulating miRNA amounts from the serum between the pre-treatment DLBCL patients versus the healthy controls, (B) the progression after treatment DLBCL patients versus the healthy controls and (C) the progression after treatment DLBCL patients versus the on-treatment DLBCL patients. The darker shade of the color for (B,C) and (D) represent the 5 most significant miRNAs. Boxplots of the actual amounts of miRNAs (copies/ng) which are present in (D) the serum for pre-treatment DLBCL patients, (E) progression after treatment in DLBCL patients, and (F) on-treatment in DLBCL patients. The whiskers show the range of the outliers, with maximum and minimum values as “o” and the 1st and 99th percentile outliers as “X”, the mean values are shown as “□”, and the median line is shown as “—”. The data points for each sample is shown on the top of the boxplots and are color coded for <40 years old as red, 40–59 years old as olive, and ≥60 years old as blue.
Figure 5
Figure 5
Presence of the miRNA signature for DLBCL patients in remission. (A) t-SNE plot showing the distribution of the overall response of the circulating miRNA signature (containing all 9 miRNAs) from the serum between the DLBCL in remission for <24 months (red), DLBCL patients in remission for ≥24 months (olive), DLBCL patients with the length of remission unknown (grey), DLBCL patients which at the time blood collection were categorized as remission, by follow up data indicates that patients relapsed with DLBCL (purple), and healthy subjects (blue). In addition, the DLBCL remission patients were classified as 1st remission (●) or 2nd remission (▲). (B) Receiver Operating Curves (ROCs) for the Remission (n = 52) vs. Healthy (n = 17) Samples. The area under the curve is shown in parentheses. (C) t-SNA plot determined by using the 5 most significant miRNAs (Supplemental Tables S4 and S5) for the same patient samples as in the previous plot. (D) Heatmap representing hierarchical clustering of the circulating miRNA signature. The specific subject information for age, MYC status, state of tumor, length of remission, either 1st or 2nd remission, relapse after categorized as remission during blood draw, and miRNA cancer impact is shown. For all plots the miRNA amounts were log2(x + 1) transformed.
Figure 6
Figure 6
Predicted genes and biological functions to be the most impacted by the 5 miRNAs included in the signature. (A) The five miRNAs selected for the signature (Supplemental Tables S4 and S5) were used to predict which genes will be the most regulated by these miRNAs determined using CluePedia Cytoscape plugin. The miRNA-mRNA interactions were determined from three different databases. MYC is the most regulated by these miRNAs with JUN be the second most regulated. (B,C) The impact of the five miRNAs on the KEGG and Gene Ontology (GO) biological pathways predicted with DIANA microT-CDS tool. Heatmap representation of the pathways and the significance (determined from log(p-values)) with each miRNA with red indicating the highest level of significance and yellow the lowest level of significance.

References

    1. Skrabek P, Turner D, Seftel M. Epidemiology of non-Hodgkin lymphoma. Transfusion and apheresis science: official journal of the World Apheresis Association: official journal of the European Society for Haemapheresis. 2013;49:133–138. doi: 10.1016/j.transci.2013.07.014. - DOI - PubMed
    1. Martelli M, et al. Diffuse large B-cell lymphoma. Critical reviews in oncology/hematology. 2013;87:146–171. doi: 10.1016/j.critrevonc.2012.12.009. - DOI - PubMed
    1. Due H, et al. miR-155 as a Biomarker in B-Cell Malignancies. Biomed Res Int. 2016;2016:9513037. doi: 10.1155/2016/9513037. - DOI - PMC - PubMed
    1. Evens AM, et al. A phase I/II trial of bortezomib combined concurrently with gemcitabine for relapsed or refractory DLBCL and peripheral T-cell lymphomas. British journal of haematology. 2013;163:55–61. doi: 10.1111/bjh.12488. - DOI - PubMed
    1. Carey CD, et al. Molecular classification of MYC-driven B-cell lymphomas by targeted gene expression profiling of fixed biopsy specimens. The Journal of molecular diagnostics: JMD. 2015;17:19–30. doi: 10.1016/j.jmoldx.2014.08.006. - DOI - PMC - PubMed

Publication types