. 2019 Dec;576(7785):138-142.
doi: 10.1038/s41586-019-1774-2. Epub 2019 Nov 20.

PGRMC2 is an intracellular haem chaperone critical for adipocyte function

Affiliations

PGRMC2 is an intracellular haem chaperone critical for adipocyte function

Andrea Galmozzi et al. Nature. 2019 Dec.

Abstract

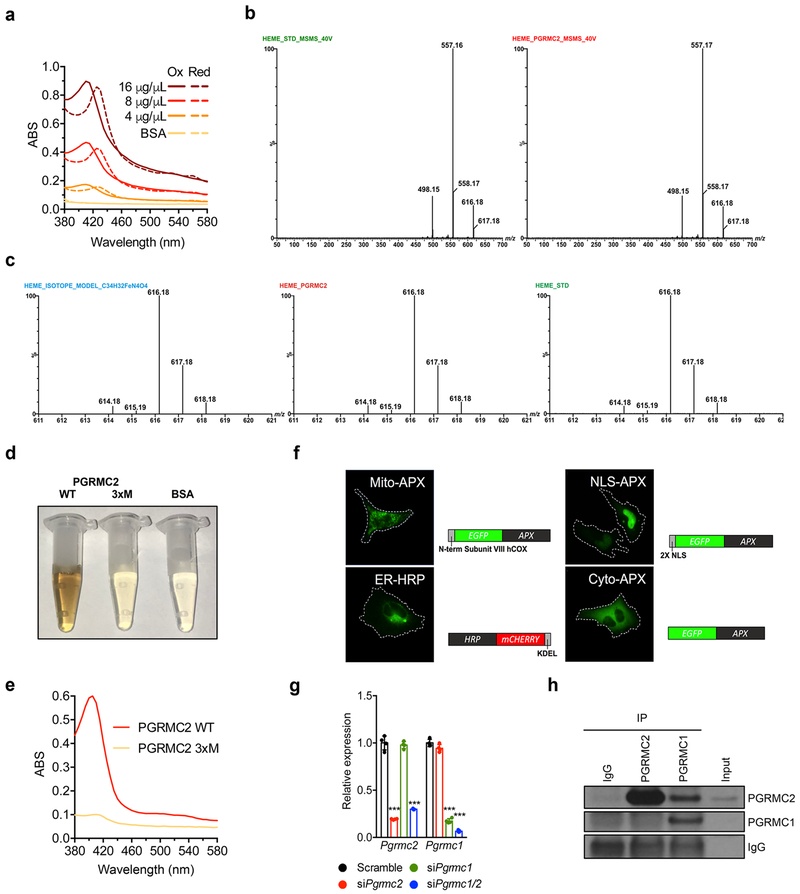
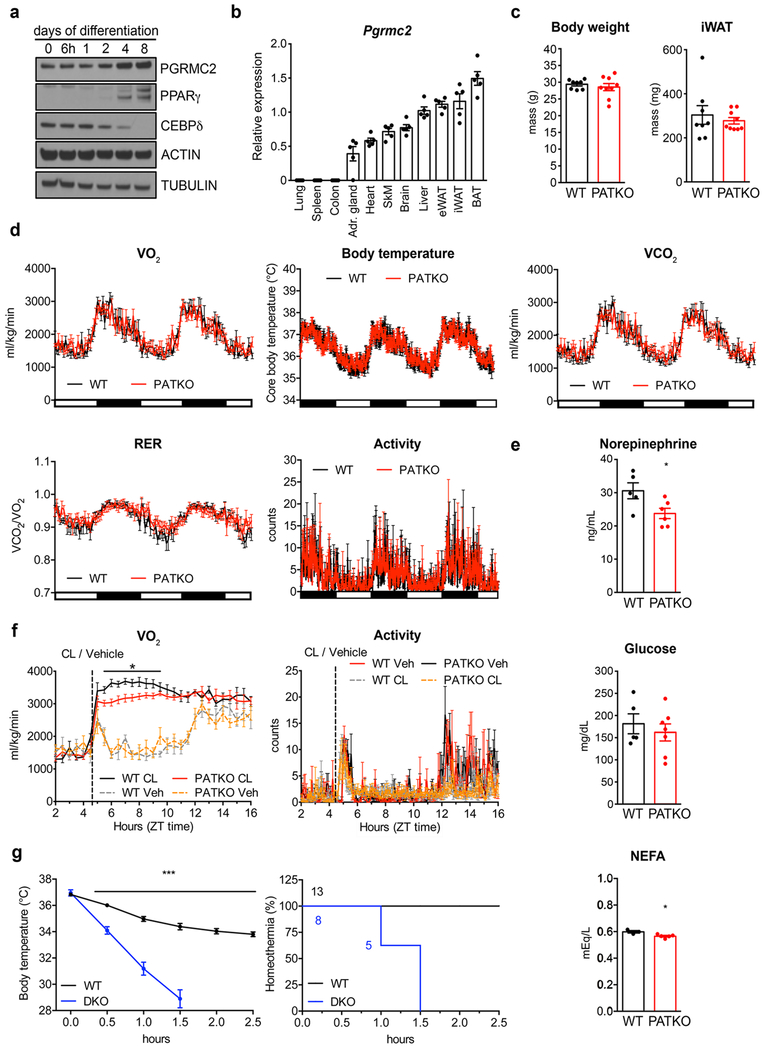
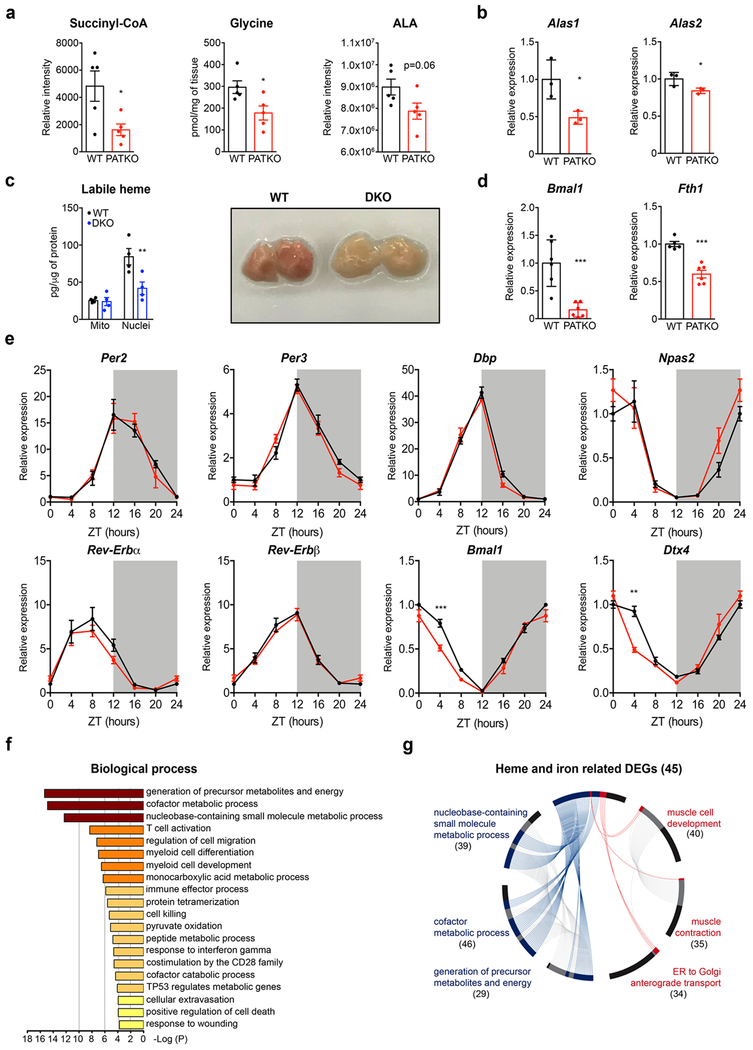
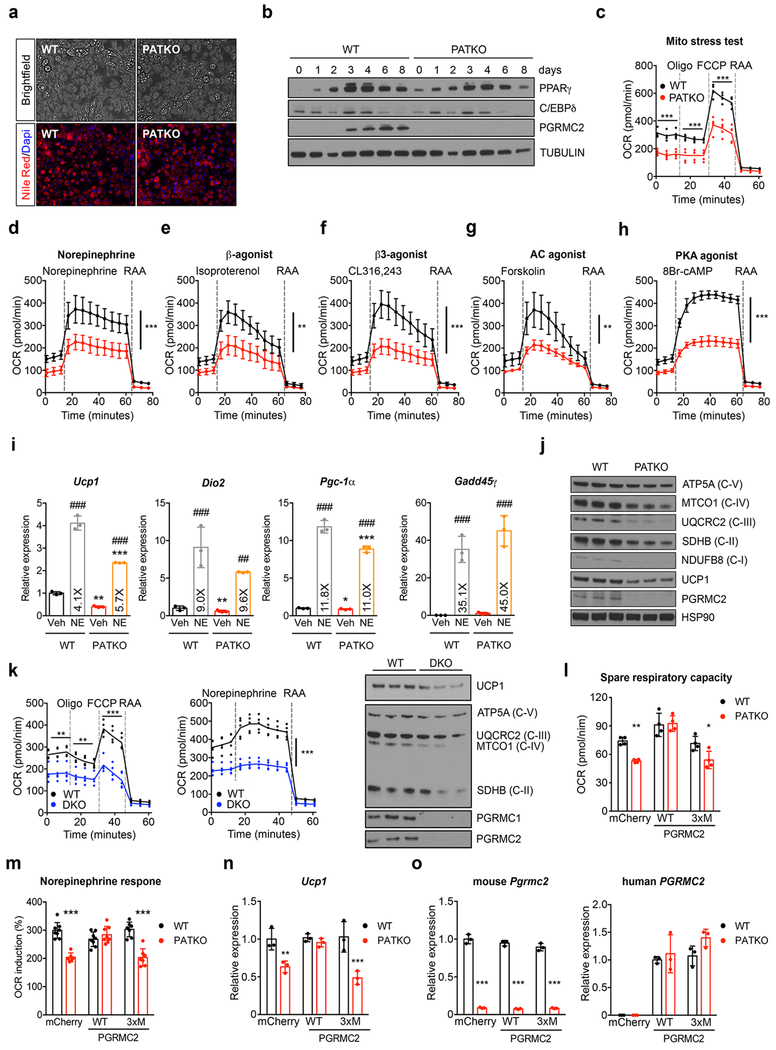
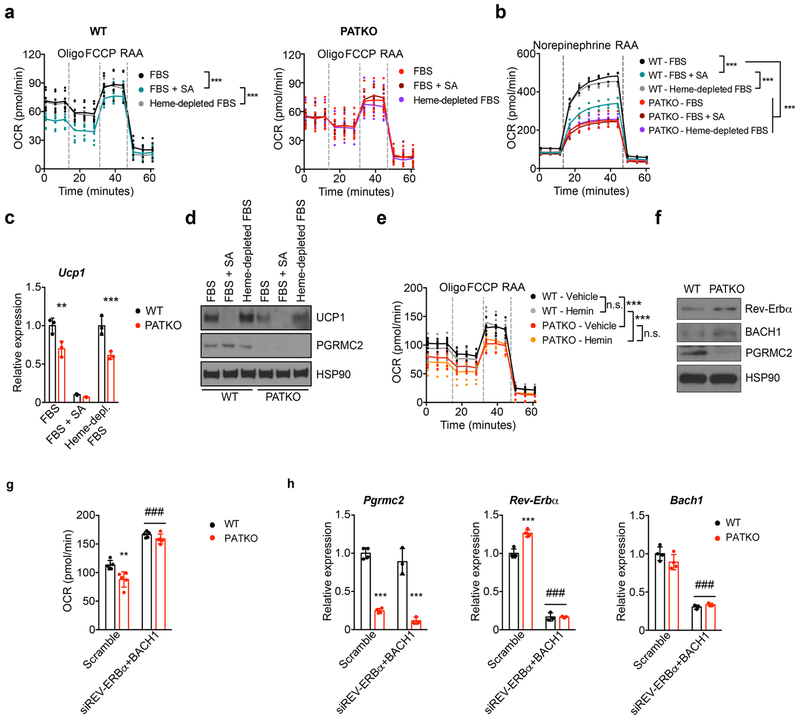
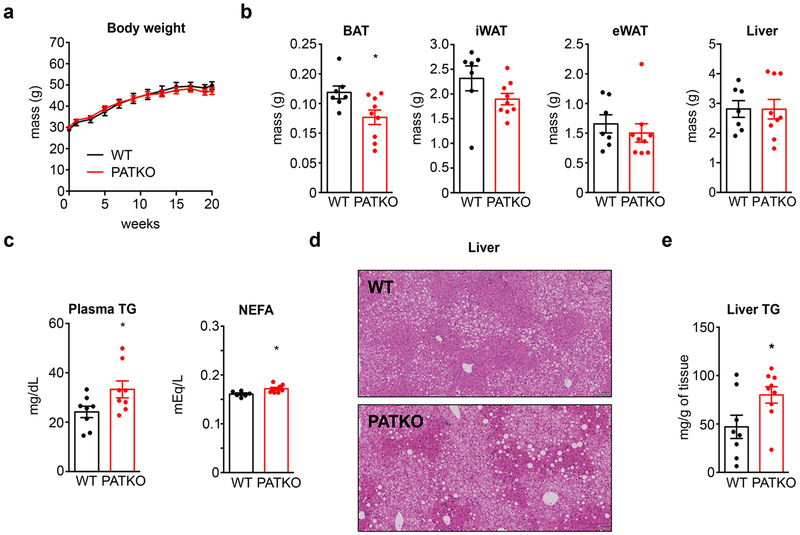
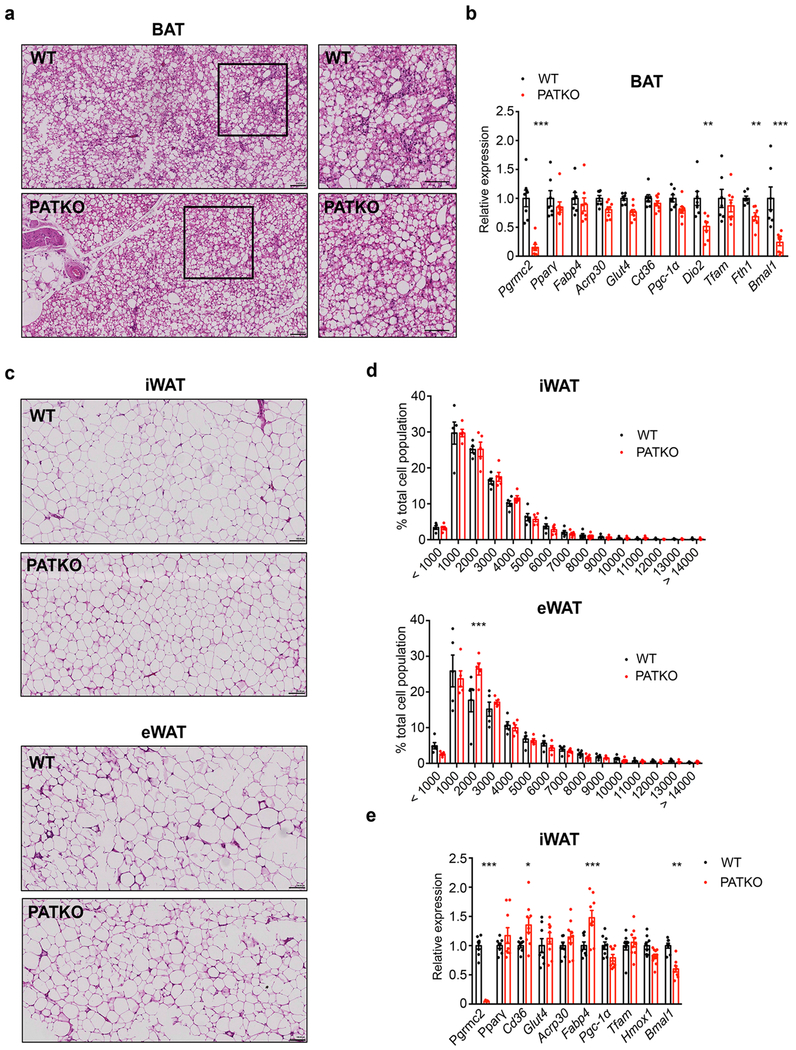
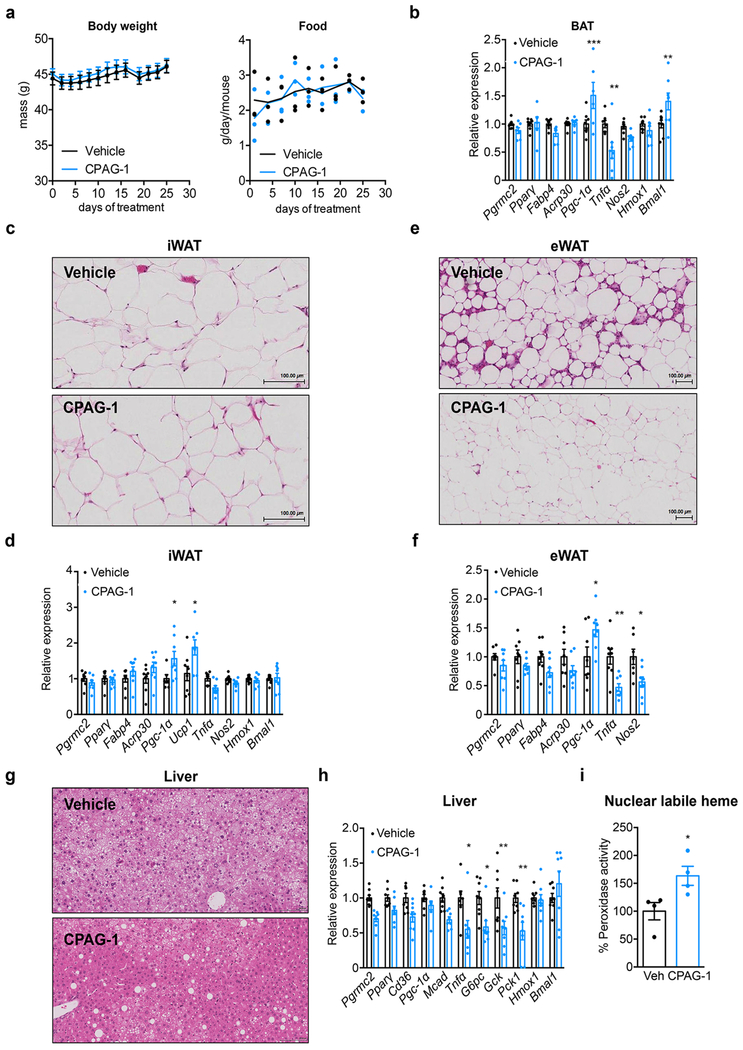
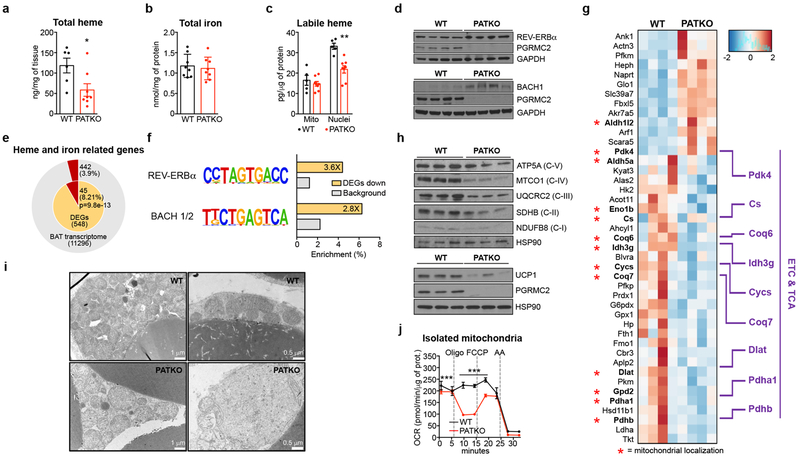
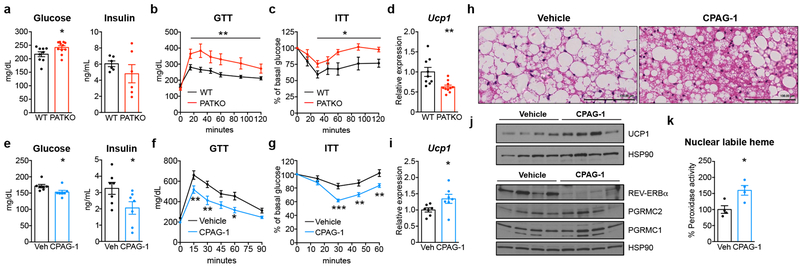
Haem is an essential prosthetic group of numerous proteins and a central signalling molecule in many physiologic processes1,2. The chemical reactivity of haem means that a network of intracellular chaperone proteins is required to avert the cytotoxic effects of free haem, but the constituents of such trafficking pathways are unknown3,4. Haem synthesis is completed in mitochondria, with ferrochelatase adding iron to protoporphyrin IX. How this vital but highly reactive metabolite is delivered from mitochondria to haemoproteins throughout the cell remains poorly defined3,4. Here we show that progesterone receptor membrane component 2 (PGRMC2) is required for delivery of labile, or signalling haem, to the nucleus. Deletion of PGMRC2 in brown fat, which has a high demand for haem, reduced labile haem in the nucleus and increased stability of the haem-responsive transcriptional repressors Rev-Erbα and BACH1. Ensuing alterations in gene expression caused severe mitochondrial defects that rendered adipose-specific PGRMC2-null mice unable to activate adaptive thermogenesis and prone to greater metabolic deterioration when fed a high-fat diet. By contrast, obese-diabetic mice treated with a small-molecule PGRMC2 activator showed substantial improvement of diabetic features. These studies uncover a role for PGRMC2 in intracellular haem transport, reveal the influence of adipose tissue haem dynamics on physiology and suggest that modulation of PGRMC2 may revert obesity-linked defects in adipocytes.


Conflict of interest statement

Competing interests. The authors declare no competing interests

Figures

Extended Data Fig. 1 |
Extended Data Fig. 1 |. PGRMC2 binds heme and coordinates with PGRMC1 its intracellular distribution.
a, Absorbance spectra of mouse PGRMC2 protein shows peaks of heme-protein complexes in the 390-450 nm range. Dotted spectra indicate heme-protein complexes after 10 mM dithionite reduction of the iron moiety. b, LC-MS/MS spectra of hemin standard (left) and PGRMC2 protein (right) at CE = 40V. c, Isotope envelope of hemin calculated based on isotope natural abundance for C34H32FeN4O4 (-Cl ion) (left), PGRMC2 protein (center), and hemin standard (right). d, Purified mouse PGRMC2 3xM mutant (Y131F, K187A, Y188F) does not bind heme. e, The Soret peak typical of hemoproteins is absent in PGRMC2 3xM. f, Representative fluorescence imaging of cells expressing targeted HRP/APX labile heme reporters showing their localization to mitochondria, ER, nucleus, and cytosol. g, Levels of Pgrmc2 and Pgrmc1 mRNA in siRNA-transfected HEK293T cells (n = 3 biologically independent samples). h, Interaction of PGRMC1 with PGRMC2 is not observed when PGRMC2 is immunoprecipitated using an antibody that recognizes the heme-binding domain at the C-terminus of PGRMC2. Representative results from two (a-e, h) or three (f, g) independent experiments. Data presented as mean ± s.d, ***p<0.001 vs. Scramble-Basal, determined by two-way ANOVA with multiple comparisons and a Tukey’s post-test.
Extended Data Fig. 2 |
Extended Data Fig. 2 |. Pgrmc2 is enriched in adipose tissue and regulates BAT function.
a, PGRMC2 protein levels increase during adipocyte differentiation. 3T3-L1 preadipocytes were induced to differentiate and protein extracts prepared at the indicated time points. PPARγ and CEBPδ are markers of mature adipocytes and preadipocytes, respectively. Representative results from three independent experiments. b, Profile of Pgrmc2 mRNA expression across mouse tissues (n = 5 biologically independent samples). c, Whole-body and inguinal subcutaneous fat weight of chow-fed WT and PATKO mice housed at 30°C (WT, n = 8; PATKO, n = 9). d, Oxygen consumption rate (OCR), core body temperature, CO2 production rate, Respiratory Exchange Ratio (RER), and activity oscillations of PATKO mice housed at 30°C (WT, n = 5; PATKO, n = 6). e, Levels of plasma norepinephrine, glucose, and non-esterified fatty acids (NEFA) in WT and PATKO mice upon cold challenge (WT n = 5; PATKO n = 7). f, Increased oxygen consumption upon acute injection of the β3-agonist CL316,243 (1 mg/kg) is reduced in PATKO mice housed at 30°C, despite comparable motor activity (n = 5 biologically independent samples). g, Adipose-specific PGRMC1/2 double knockout mice (DKO) housed at 30°C are cold intolerant (WT n = 13; DKO n = 8 biologically independent samples). Survival curves of WT and PGRMC1/2 DKO mice exposed to 4°C (homeothermia = 31°C). Mice were exposed to 4°C at 11 am (ZT5). Data presented as mean ± s.e.m. *p<0.05, ***p<0.001 vs. WT analyzed by two-tailed Student’s t-test (e, f) or two-way ANOVA with multiple comparisons and a Tukey’s post-test (g).
Extended Data Fig. 3 |
Extended Data Fig. 3 |. Impact of Pgrmc2 deletion in BAT.
Brown adipose tissue from chow-fed WT and mutant mice housed at 30°C was analyzed. a, Levels of succinyl-CoA, glycine, and aminolevulinic acid (ALA) in BAT quantified using targeted metabolomics (n = 5 biologically independent samples per group). b, PATKO mice show reduced expression of Alas1 and Alas2 in BAT (n = 3 biologically independent samples per group). c, Nuclear labile heme is significantly lower in BAT of fat-specific PGRMC1/2 DKO mice housed at 30°C (n = 4 biologically independent samples per group). Similar to what is seen in PATKO mice, BAT of PGRMC1/2 DKO mice is discolored. Representative results from two independent experiments. d, Expression of REV-ERBα (Bmal1) and BACH1 (Fth1) targets in BAT of PATKO mice housed at 30°C (WT n = 5; PATKO n = 6). e, Circadian oscillation of clock components is not altered in PATKO BAT (n = 3 biologically independent samples per group per time point). f, GO category analysis (biological process) of significantly downregulated genes in RNAseq analysis of BAT from WT and PATKO mice housed at 30°C (n = 4 biologically independent samples per group). p values determined by standard accumulative hypergeometric statistical test. g, Circos plot of heme-related differentially-regulated genes (DEGs) showing that the majority (28/45) of them belong to the top 3 downregulated biological processes. Number in parenthesis below each biological process represents the total number of DEGs in PATKO BAT in that category. Blue lines refer to downregulated DEGs and red lines to upregulated DEGs. Data presented as mean ± s.e.m. *p<0.05, **p<0.01, ***p<0.001 vs. WT determined by two-tailed Student’s t-test.
Extended Data Fig. 4 |
Extended Data Fig. 4 |. Primary brown adipocytes recapitulate the mitochondrial defects of PATKO BAT.
a, WT and PGRMC2-null primary brown adipocytes differentiated in vitro imaged on day 8. Lipid stained with Nile red (red) and nuclei with Hoechst (blue). Scale bar is 100 μm. b, Protein levels of adipocyte markers during the course of differentiation. c, PGRMC2-null brown adipocytes have impaired mitochondrial respiration (n = 3). d-h, Lack of PGRMC2 in brown adipocytes results in a defective mitochondrial response to endogenous (d), synthetic panβ- (e) and β3-adrenergic (f) agonists, and to downstream activators of adrenergic signaling (g, h) (n = 5). i, Induction of norepinephrine-responsive genes is similar in WT and PGRMC2-null brown adipocytes (n = 3) exposed to 100 nM norepinephrine (NE) for 2 hr. j, OXPHOS proteins and UCP1 are reduced in primary brown PATKO adipocytes. k, PGRMC1/2 DKO primary brown adipocytes differentiated in vitro show severe mitochondrial dysfunction, an inability to increase oxygen consumption upon NE exposure (n = 3), and reduced UCP1 and OXPHOS proteins. l-m, Overexpression of human WT PGRMC2, but not of a heme-binding mutant (3xM Y137F, K193A, and Y194F), can rescue mitochondrial function and the response to NE in PATKO adipocytes (l, n = 4; m, WT-mCherry, WT-WT, PATKO-WT n = 8; WT-3xM, PATKO-3xM n = 7; PATKO-mCherry n = 6). n, Ucp1 mRNA expression is restored when human WT PGRMC2, but not the heme-binding mutant 3xM, is expressed in PATKO cells (n = 3). o, Levels of mouse and human Pgrmc2 mRNA in primary adipocytes used in panels l-n (n = 3). a-o, Biologically independent samples. Representative results from two (j-o) or three (a-i) independent experiments. Data presented as mean ± s.d. *p<0.05, **p<0.01, ***p<0.001 vs. WT; ###p<0.001 vs. Veh determined by two-way ANOVA with multiple comparisons and a Bonferroni’s post-test.
Extended Data Fig. 5 |
Extended Data Fig. 5 |. PGRMC2-mediated transport of endogenous labile heme regulates mitochondrial function in primary brown adipocytes.
a-b, Inhibition for 48 hr of endogenous heme synthesis with 0.5 mM succinylacetone (FBS +SA), but not exogenous heme depletion (Heme-depleted FBS), in WT primary brown adipocytes phenocopies the mitochondrial defects of PATKO cells (a, n = 8; b, n = 4). c-d, Treatment with SA (0.5 mM) dramatically reduces Ucp1 mRNA and protein levels (n = 3). e, Exogenous hemin (20 μM) does not correct mitochondrial dysfunction in PATKO cells (n = 3). f, PATKO brown adipocytes show higher levels of Rev-Erbα and BACH1 protein. g, Dual knockdown of Rev-Erbα and BACH1 in mature PATKO adipocytes restores mitochondrial respiration (n = 5). h, Pgrmc2, Rev-Erbα, and Bach1 mRNA in control and knockdown cells. a-h, Biologically independent samples. Representative results from two independent experiments. Data presented as mean ± s.d. **p<0.01, ***p<0.001 vs. WT; ###p<0.001 vs. Scramble determined by two-way ANOVA with multiple comparisons and a Bonferroni’s post-test.
Extended Data Fig. 6 |
Extended Data Fig. 6 |. Body composition of PATKO mice fed a high-fat diet.
WT and PATKO mice were fed HFD for 20 weeks. a, Body weight progression (WT n = 7; PATKO n = 9). b, BAT of PATKO mice fed HFD is smaller compared to BAT of HFD-fed WT mice. No difference was seen in iWAT, eWAT, or liver weight (WT n = 7; PATKO n = 9). c, PATKO mice fed HFD had higher levels of plasma triglycerides and non-esterified fatty acids (NEFA) (WT n = 7; PATKO n = 8). d, H&E stain images of liver show increased steatosis in PATKO mice. Scale bar is 100 μm. Representative images of 7 biologically independent samples. e, PATKO mice fed HFD had more lipid accumulation in liver. (n = 8). a-e, Biologically independent samples. Data presented as mean ± s.e.m. *p<0.05 vs. WT determined by two-tailed Student’s t-test.
Extended Data Fig. 7 |
Extended Data Fig. 7 |. Analysis of adipose depots of PATKO mice fed a high-fat diet.
WT and PATKO mice were fed HFD for 20 weeks. a, H&E stain images of BAT from WT and PATKO mice fed HFD show similar morphology. Insets are magnified on the right. Scale bar is 100 μm. Representative images of 7 biologically independent samples. b, Gene expression analysis in BAT shows reduced levels of Fth1 and Bmal1, targets of BACH1 and Rev-Erbα respectively, in PATKO BAT (WT n = 7; PATKO n = 8). c, H&E stain images of iWAT and eWAT from WT and PATKO mice fed HFD do not show clear differences. Scale bar is 100 μm. Representative images of 7 biologically independent samples. d, Size analysis of iWAT and eWAT adipocytes from HFD-fed WT and PATKO mice. X axis indicates μm2 (n = 5 images of biologically independent samples). e, Gene expression analysis in iWAT reveals a modest increase in expression of genes involved in lipid handling. Similar to BAT, Bmal1 expression is significantly reduced in iWAT of PATKO mice (WT n = 7; PATKO n = 9). a-e, Biologically independent samples. Data presented as mean ± s.e.m. *p<0.05, **p<0.01, ***p<0.001 vs. WT determined by two-way ANOVA with multiple comparisons and a Bonferroni’s post-test.
Extended Data Fig. 8 |
Extended Data Fig. 8 |. Impact of pharmacological activation of PGRMC2 in DIO mice.
DIO mice were treated with CPAG-1 for 30 days. a, Body weight (left) and food intake (right) progression (n = 8). b, Expression of Pgc-1α and Bmal1 is increased in BAT of treated DIO mice (n = 8). c, H&E stain images of iWAT show no difference between Vehicle- and CPAG-1-treated DIO mice. Scale bar is 100 μm. d, Gene expression analysis reveals increased expression of Pgc-1α and Ucp1 in iWAT of CPAG-1-treated DIO mice (n = 8). e, H&E stain images show reduced fibrosis and immune cell infiltration in eWAT of DIO mice treated with CPAG-1. Scale bar is 100 μm. f, Gene expression analysis shows decreased expression of markers of inflammation in eWAT of treated mice (n = 8). g, H&E stain images of liver show CPAG-1 treatment modestly reduces lipid deposition. Scale bar is 100 μm. h, Hepatic gene expression analysis shows decreased levels of gluconeogenic genes and inflammation markers in liver of treated mice (n = 8). i, Treatment with CPAG-1 for 4 days significantly increases nuclear labile heme levels in the liver of DIO mice (n = 4). a-i, Biologically independent samples. d, e and g, Representative images of 8 biologically independent samples per group. Data presented as mean ± s.e.m. *p<0.05, **p<0.01, ***p<0.001 vs. Veh determined by two-way ANOVA with multiple comparisons and a Bonferroni’s post-test.
Extended Data Fig. 9 |
Extended Data Fig. 9 |. Evaluation of interaction of CPAG-1 with PGRMC1 and PGRMC2 in live cells.
a, HEK293T cells transfected with expression vectors for either PGRMC1 or PGRMC2 were treated with 10 μM probe 25 (the photoreactive form of CPAG-1) and DMSO, 100 μM hemin, or 100 μM CPAG-1 for 30 min followed by UV-photocrosslinking, lysis, and conjugation of labeled proteomes to a TAMRA-azide tag. Labeled proteomes were separated by SDS-PAGE and visualized by in-gel fluorescence scanning. The intensity of the signals indicates the affinity of probe 25 for the overexpressed proteins. The black asterisk marks PGRMC1 protein and the red one PGRMC2 protein. Though detectable, PGRMC1 shows very poor labeling with probe 25 relative to PGRMC2. Both interactions can be competed by hemin or CPAG-1. Western blot analysis confirms expression of PGRMC1 and PGRMC2 in transfected cells. Representative results from two independent experiments.
Extended Data Fig. 10 |
Extended Data Fig. 10 |. PGRMC2 is an intracellular heme chaperone critical for adipocyte function.
Model of the proposed role for PGRMC2 in heme dynamics in brown adipocytes. PGRMC2 acquires heme from PGRMC1, which forms a complex with FECH, the last enzyme in heme synthesis. PGRMC2, located in the ER and the nuclear envelope, facilitates delivery of labile heme to the nucleus. Nuclear labile heme alters expression of genes regulated by heme-responsive transcriptional repressors, such as REV-ERBα and BACH1, that impact mitochondrial bioenergetics. Also shown are FVLCR1b, a mitochondrial heme exporter identified in erythrocytes, and HRG-1, a plasma-membrane heme importer characterized in macrophages. FVLCR1b and HRG-1 are both expressed in brown adipocytes, but their role in heme dynamics in this cell type remains to be defined.
Fig. 1 |
Fig. 1 |. PGRMC2 controls intracellular distribution of labile heme.
a, Purified PGRMC2 has the color of hemoproteins. b, LC-MS/MS spectra of PGRMC2 and hemin standard. c, Peroxidase activity of apoHRP with PGRMC2. PGRMC2, hemin, apoHRP, and apoHRP plus protoporphyrin IX (PPIX) show no activity. Hemin served as positive control. Technical duplicates shown. d, Native PAGE of WT, heme-binding mutant (3xM) PGRMC2, and apo-Rev-Erbα LBD alone or in combination stained in-gel for heme (top) or protein (bottom). Black arrows, PGRMC2; red arrows, Rev-Erbα. Hemin (20 μM) served as positive control. PGRMC2 3xM and apo-Rev-Erbα LBD show no heme staining. e, Differential spectroscopy of PGRMC2 heme-binding domain with increasing amounts of ferric or ferrous (in presence of 10 mM dithionite) hemin. Titration curves represent differential absorbance at 405 (ferric) and 400 (ferrous) nm. Kd expressed as mean ± s.d. f, Peroxidase activity in HEK293T cells co-transfected with labile heme reporters and scramble or Pgrmc2 siRNA, and exposed to succinylacetone (SA), heme-depleted FBS, or both for 48 hr. g, Endogenous PGRMC2 co-immunoprecipitates with endogenous PGRMC1 in primary brown adipocytes. h, Peroxidase activity in HEK293T cells co-transfected with labile heme reporters and scramble, Pgrmc1, or Pgrmc1/2 siRNA and treated as in panel f. Scramble group is repeated from panel f. f, h, Biologically independent samples (n = 6). Representative results from two (b, g) or three (a, c, d, e, f, h) independent experiments. Data presented as mean ± s.d, *p<0.05, ***p<0.001 vs. Scramble-Basal, determined by two-way ANOVA with multiple comparisons and a Tukey’s post-test.
Fig. 2 |
Fig. 2 |. PATKO mice are cold-sensitive.
a, Weight and b, gross appearance of BAT of chow-fed WT (n = 8) and PATKO (n = 9) mice at 30°C. c, Expression of thermogenic genes is decreased in PATKO BAT (WT n = 5; PATKO n = 6). d, H&E stains of BAT. Representative images from two independent experiments (n = 5). e, PATKO mice are cold intolerant (n = 12). Challenge started at ZT5 (11 am). f, Survival curves at 4°C (homeothermia = 31°C). g, PATKO BAT responds normally to adrenergic signaling (WT n = 4; PATKO n = 5). a-g, Biologically independent samples. Data presented as mean ± s.e.m. *p<0.05, **p<0.01, ***p<0.001 PATKO vs. WT, ###p<0.001 30°C vs. 4°C determined by two-tailed Student’s t-test (a, c) or two-way ANOVA with multiple comparisons and a Bonferroni’s post-test (e, g).
Fig. 3 |
Fig. 3 |. Pgrmc2 regulates heme-sensitive transcription and mitochondrial function in BAT.
a, Total heme (WT, n = 6; PATKO, n = 8) and b, iron (n = 8) levels in BAT. c, Labile heme in mitochondrial and nuclear fractions of BAT (WT n = 5; PATKO n = 8). d, REV-ERBα and BACH1 levels in BAT. e, Genes related to heme and iron metabolism (red portions) are enriched in differentially-expressed genes. f, REV-ERBα and BACH1/2-binding motifs are enriched in genes downregulated in PATKO BAT. g, Heat map of heme and iron related genes shows a global decrease of ETC and TCA gene expression. h, UCP1 and OXPHOS proteins are reduced in PATKO BAT. i, Electron microscopy shows altered mitochondrial morphology in PATKO BAT. Representative images from 4 biologically independent samples. j, Oxygen consumption rate (OCR) of mitochondria isolated from BAT (n = 6). a-j, Biologically independent samples. Representative results from two (a-c, j) or three (d, h) independent experiments. Data presented as mean ± s.e.m. *p<0.05, **p<0.01, ***p<0.001 vs. WT determined by two-tailed Student’s t-test.
Fig. 4 |
Fig. 4 |. PGRMC2 controls systemic glucose homeostasis.
a, Glucose (WT n = 9; PATKO n = 10) and insulin (n = 6) in WT and PATKO mice fed high-fat diet. b-c, Glucose (b) and insulin (c) tolerance tests after 10 (GTT) and 12 (ITT) weeks of HFD (GTT: WT n = 8, PATKO n = 11; ITT: WT n = 6, PATKO n = 9). d, Ucp1 mRNA in BAT of HFD-fed WT (n = 9) and PATKO (n = 10) mice. e, Glucose and insulin levels in DIO mice treated with vehicle or CPAG-1 for 30 days (n = 7). f-g, Glucose (f) and insulin (g) tolerance tests in DIO mice after 14 (GTT) and 20 (ITT) days of treatment (n = 7). h, H&E stains of BAT. Representative images from 4 biologically independent samples. i, Ucp1 mRNA levels in BAT of treated DIO mice (n = 7). j, UCP1 and Rev-Erbα levels in BAT of treated DIO mice. k, Nuclear labile heme levels in BAT of DIO mice treated with CPAG-1 for 4 days (n = 4). a-k, Biologically independent samples, representative results from two independent experiments. Data presented as mean ± s.e.m. *p<0.05, **p<0.01, ***p<0.001 vs. WT or vehicle determined by two-tailed Student’s t-test (a, d, e, i, k) or two-way ANOVA with multiple comparisons and a Bonferroni’s post-test (b, c, f, g).

References

    1. Severance S & Hamza I Trafficking of heme and porphyrins in metazoa. Chem Rev 109, 4596–4616, (2009). - PMC - PubMed
    1. Mense SM & Zhang L Heme: a versatile signaling molecule controlling the activities of diverse regulators ranging from transcription factors to MAP kinases. Cell Res 16, 681–692 (2006). - PubMed
    1. Donegan RK, Moore CM, Hanna DA & Reddi AR Handling heme: The mechanisms underlying the movement of heme within and between cells. Free Radic Biol Med 133, 88–100, (2019). - PMC - PubMed
    1. Reddi AR & Hamza I Heme Mobilization in Animals: A Metallolipid’s Journey. Acc Chem Res 49, 1104–1110 (2016). - PMC - PubMed
    1. Parker CG et al. Ligand and Target Discovery by Fragment-Based Screening in Human Cells. Cell 168, 527–541 (2017). - PMC - PubMed

Publication types