. 2019 Dec;576(7785):112-120.
doi: 10.1038/s41586-019-1775-1. Epub 2019 Nov 20.

Longitudinal molecular trajectories of diffuse glioma in adults

Floris P Barthel #  1   2 Kevin C Johnson #  1 Frederick S Varn  1 Anzhela D Moskalik  1 Georgette Tanner  3 Emre Kocakavuk  1   4   5 Kevin J Anderson  1 Olajide Abiola  1 Kenneth Aldape  6 Kristin D Alfaro  7 Donat Alpar  8   9 Samirkumar B Amin  1 David M Ashley  10 Pratiti Bandopadhayay  11   12 Jill S Barnholtz-Sloan  13 Rameen Beroukhim  12   14 Christoph Bock  8   15 Priscilla K Brastianos  16 Daniel J Brat  17 Andrew R Brodbelt  18 Alexander F Bruns  3 Ketan R Bulsara  19 Aruna Chakrabarty  20 Arnab Chakravarti  21 Jeffrey H Chuang  1   22 Elizabeth B Claus  23   24 Elizabeth J Cochran  25 Jennifer Connelly  26 Joseph F Costello  27 Gaetano Finocchiaro  28 Michael N Fletcher  29 Pim J French  30 Hui K Gan  31   32 Mark R Gilbert  33 Peter V Gould  34 Matthew R Grimmer  27 Antonio Iavarone  35   36   37 Azzam Ismail  20 Michael D Jenkinson  18 Mustafa Khasraw  38 Hoon Kim  1 Mathilde C M Kouwenhoven  39 Peter S LaViolette  40 Meihong Li  1 Peter Lichter  29 Keith L Ligon  12   41 Allison K Lowman  40 Tathiane M Malta  42 Tali Mazor  27 Kerrie L McDonald  43 Annette M Molinaro  27 Do-Hyun Nam  44   45 Naema Nayyar  16 Ho Keung Ng  46 Chew Yee Ngan  1 Simone P Niclou  47 Johanna M Niers  39 Houtan Noushmehr  42 Javad Noorbakhsh  1 D Ryan Ormond  48 Chul-Kee Park  49 Laila M Poisson  50 Raul Rabadan  51   52 Bernhard Radlwimmer  29 Ganesh Rao  53 Guido Reifenberger  54 Jason K Sa  45 Michael Schuster  8 Brian L Shaw  16 Susan C Short  3 Peter A Sillevis Smitt  30 Andrew E Sloan  55   56   57 Marion Smits  58 Hiromichi Suzuki  59 Ghazaleh Tabatabai  60 Erwin G Van Meir  61 Colin Watts  62 Michael Weller  63 Pieter Wesseling  2   64 Bart A Westerman  65 Georg Widhalm  66 Adelheid Woehrer  67 W K Alfred Yung  7 Gelareh Zadeh  68 Jason T Huse  69   70 John F De Groot  7 Lucy F Stead  3 Roel G W Verhaak  71 GLASS Consortium
Collaborators, Affiliations

Longitudinal molecular trajectories of diffuse glioma in adults

Floris P Barthel et al. Nature. 2019 Dec.

Abstract

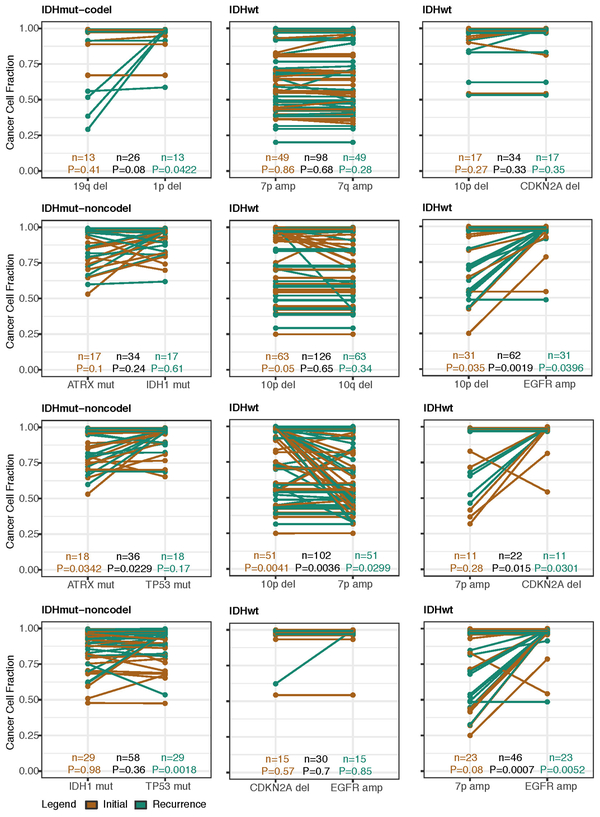
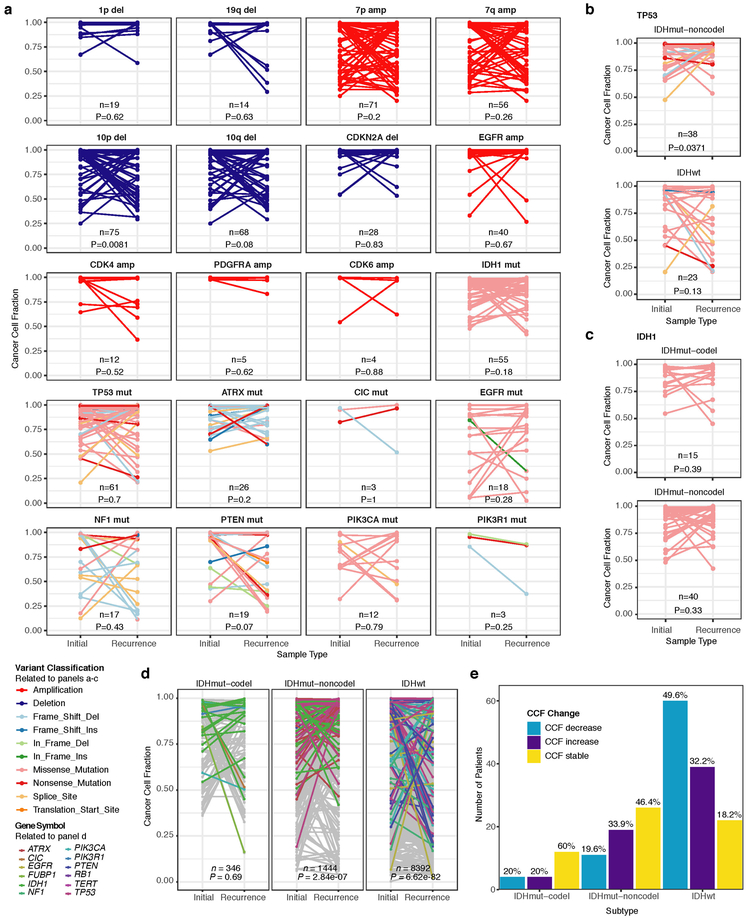
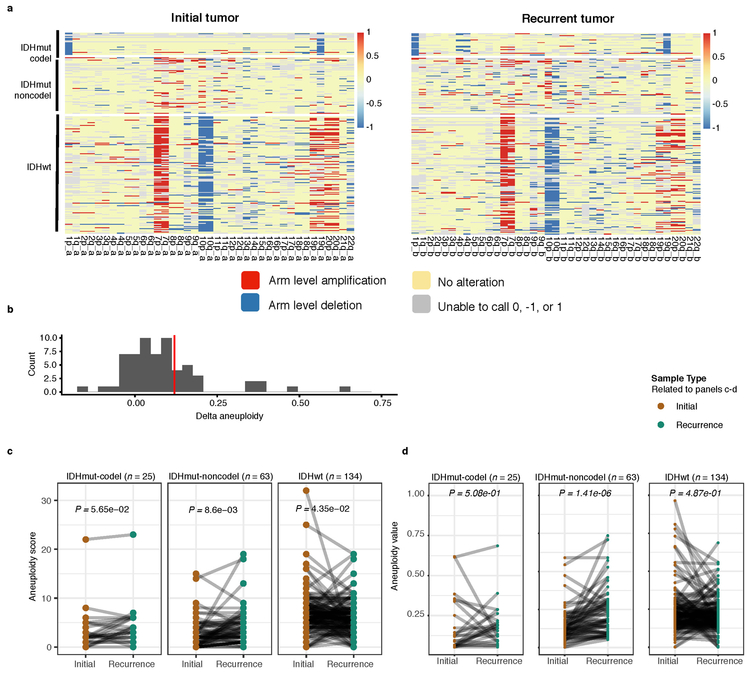
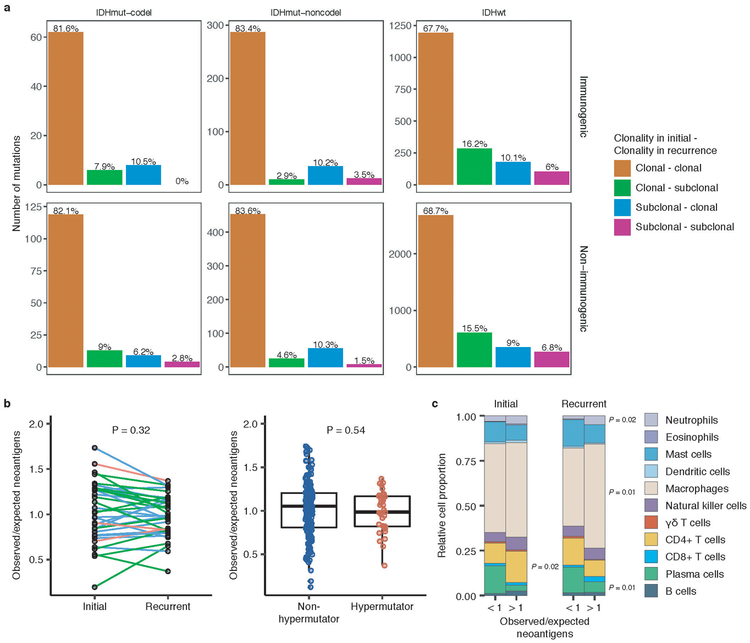
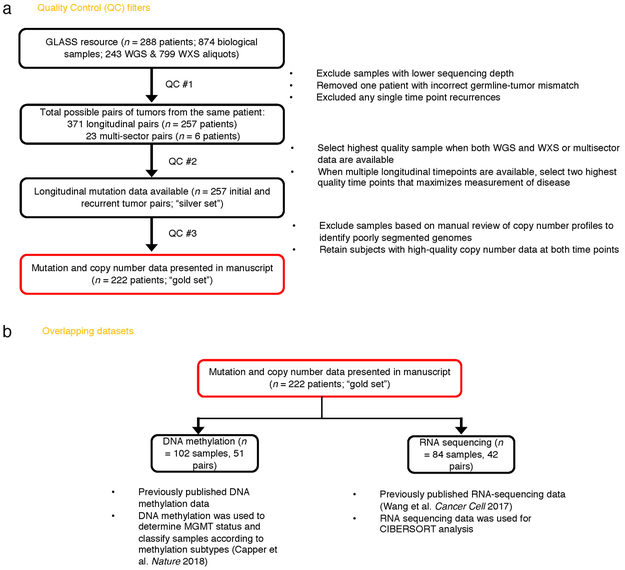
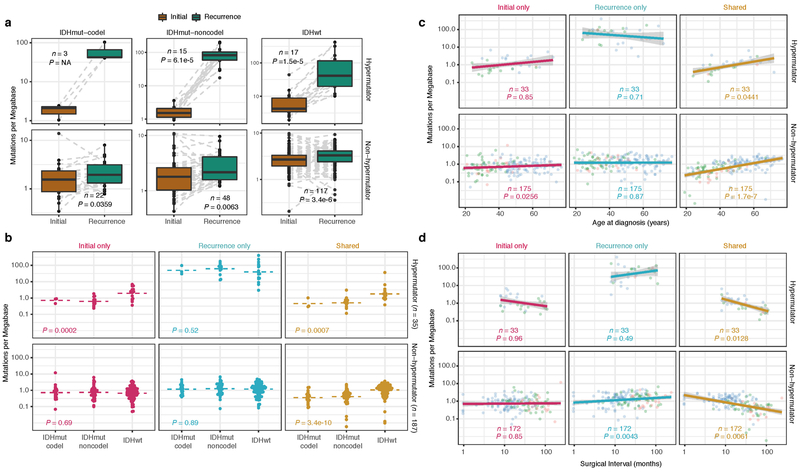
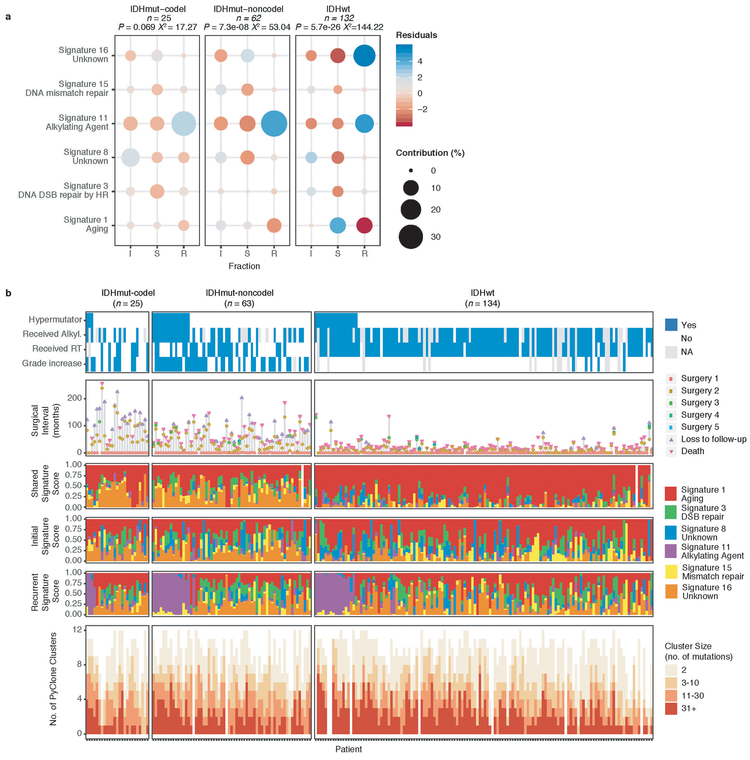
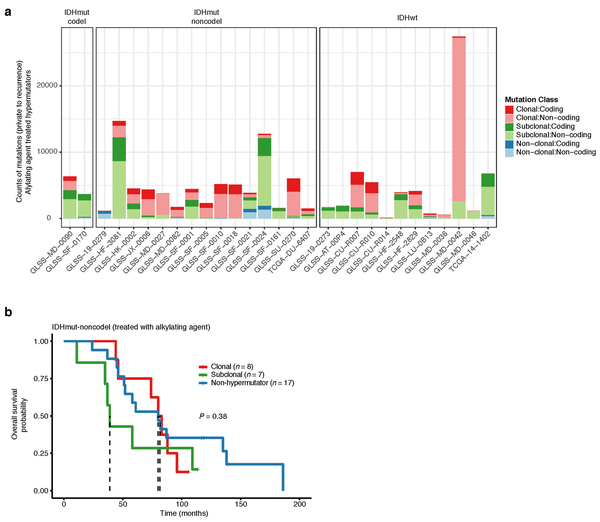
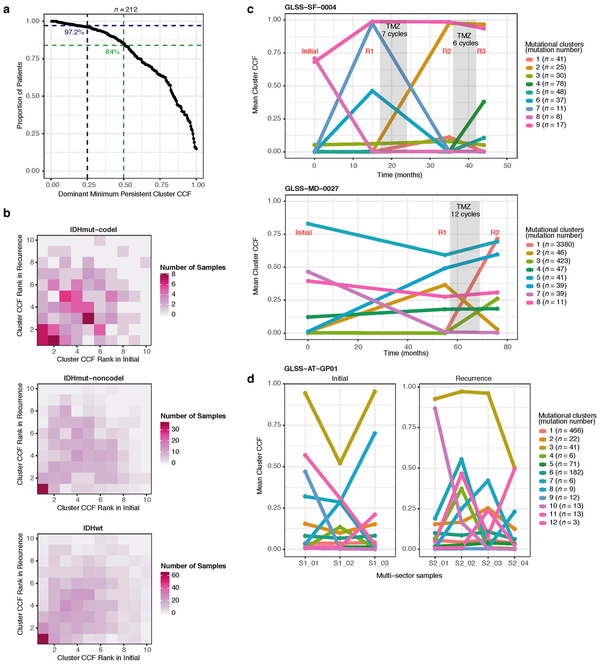
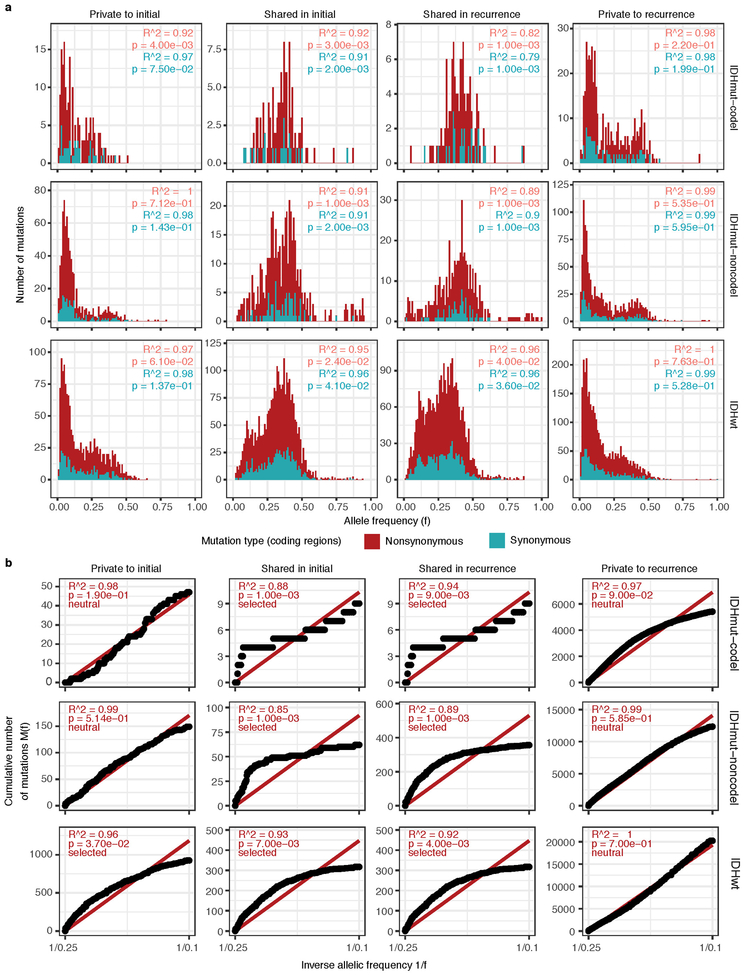
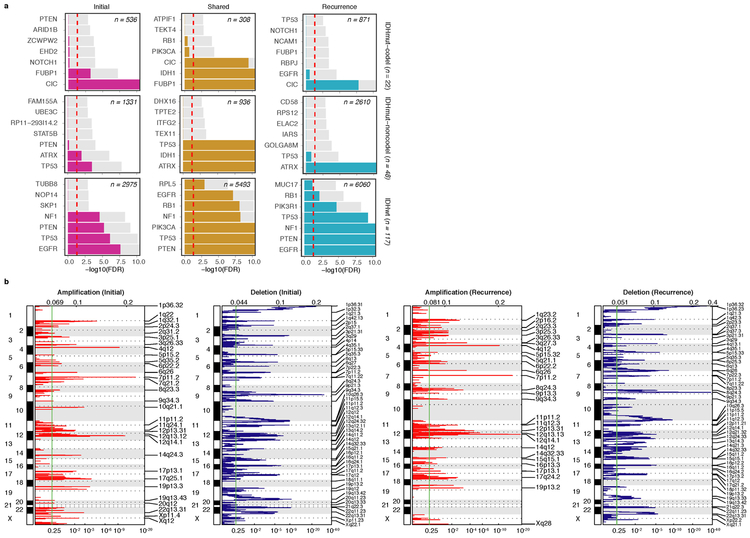
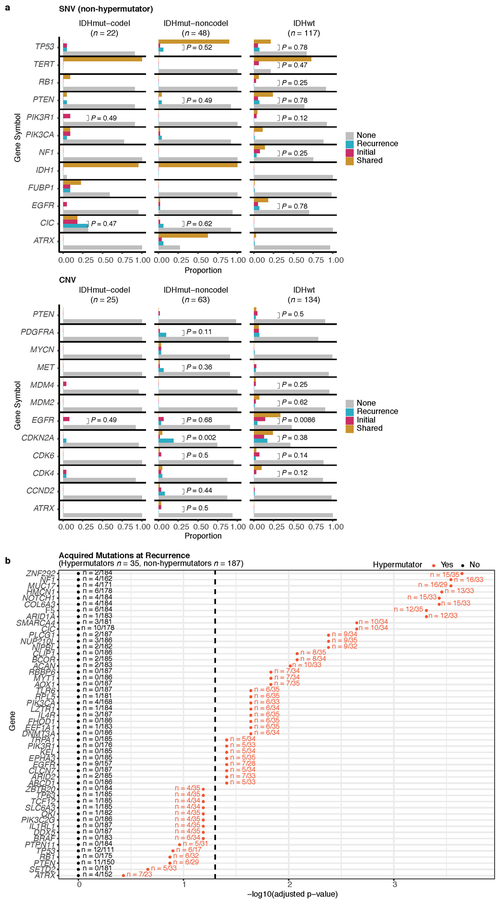
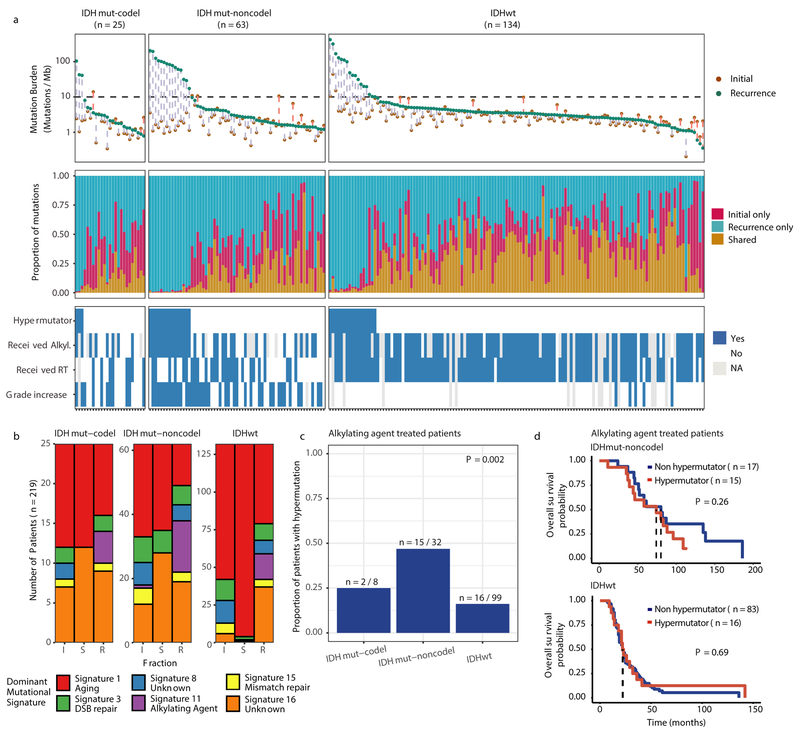
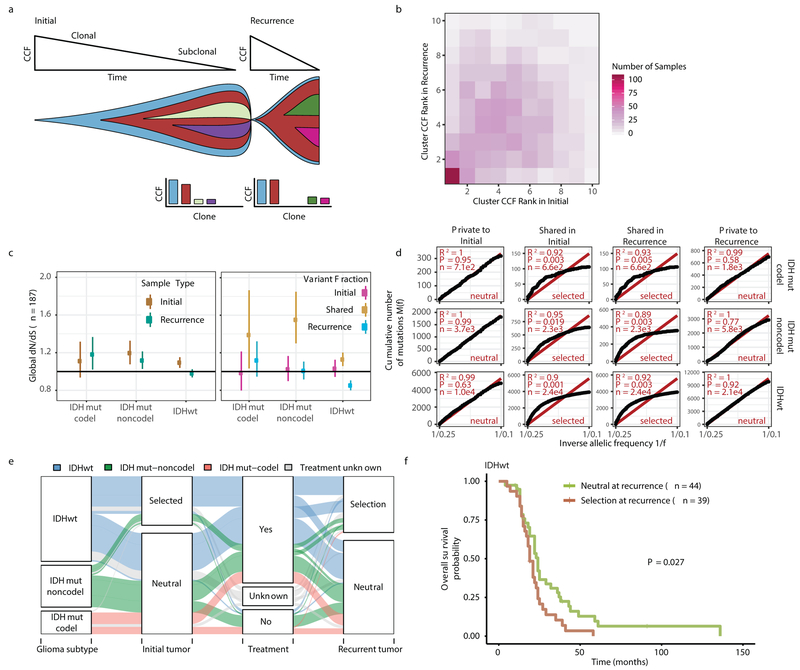
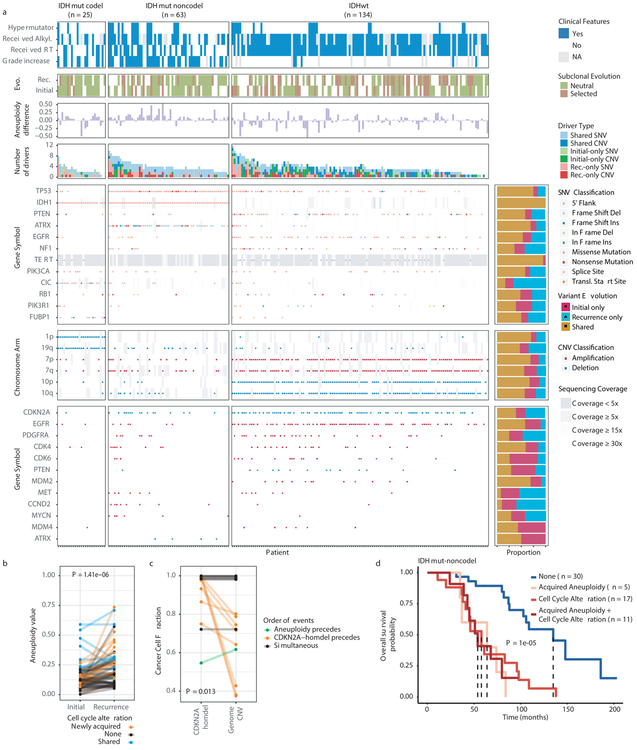
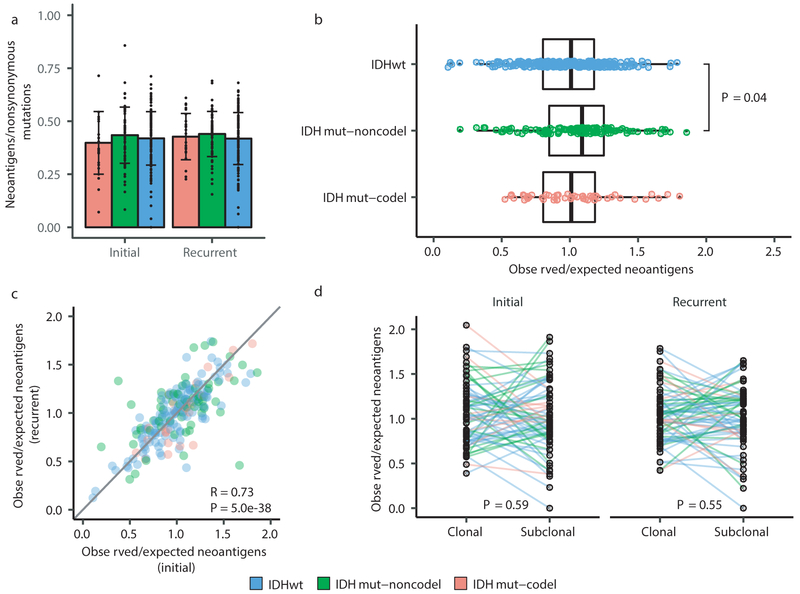
The evolutionary processes that drive universal therapeutic resistance in adult patients with diffuse glioma remain unclear1,2. Here we analysed temporally separated DNA-sequencing data and matched clinical annotation from 222 adult patients with glioma. By analysing mutations and copy numbers across the three major subtypes of diffuse glioma, we found that driver genes detected at the initial stage of disease were retained at recurrence, whereas there was little evidence of recurrence-specific gene alterations. Treatment with alkylating agents resulted in a hypermutator phenotype at different rates across the glioma subtypes, and hypermutation was not associated with differences in overall survival. Acquired aneuploidy was frequently detected in recurrent gliomas and was characterized by IDH mutation but without co-deletion of chromosome arms 1p/19q, and further converged with acquired alterations in the cell cycle and poor outcomes. The clonal architecture of each tumour remained similar over time, but the presence of subclonal selection was associated with decreased survival. Finally, there were no differences in the levels of immunoediting between initial and recurrent gliomas. Collectively, our results suggest that the strongest selective pressures occur during early glioma development and that current therapies shape this evolution in a largely stochastic manner.


Conflict of interest statement

CONFLICTS OF INTEREST

R.G.W.V. declares equity in Boundless Bio, Inc. M.K. receives research grants from BMS and ABBVie. P.K.B. is a consultant for Lilly, Genentech-Roche, Angiochem and Tesaro. P.K.B. receives institutional funding from Merck and Pfizer and honoraria from Merch and Genentech-Roche. W.K.A.Y serves in a consulting or advisory role at DNAtrix Therapeutics. M.W. receives funding from Acceleron, Actelion, Bayer, Isarna, Merck, Sharp & Dohme, Merck (EMD, Darmstadt), Novocure, OGD2, Pigur and Roche as well as honoraria from BMS, Celldex, Immunocellular Therapeutics, Isarna, Magforce, Merck, Sharp & Dohme, Merck (EMD, Darmstadt), Northwest Biotherapeutics, Novocure, Pfizer, Roche, Teva and Tocagen. G.R. receives funding from Roche and Merck (EMD, Darmstadt) as well as honoraria from AbbVie. M.S. is a central reviewer for Parexel Ltd and honoraria are paid to the institution. G.T. reports personal fees from Bristol-Myers-Squibb, personal fees from AbbVie, personal fees from Novocure, personal fees from Medac, travel grants from Bristol-Myers-Squibb, education grants from Novocure, research grants from Roche Diagnostics, research grants from Medac, membership in the National Steering board of the TIGER NIS (Novocure) and the International Steering board of the ON-TRK NIS (Bayer).

Figures

Extended Data Fig. 1 ∣
Extended Data Fig. 1 ∣. Sample Selection.
a. Quality control workflow steps identifying all GLASS samples available as a resource and the identification of the highest quality set of patient pairs (n = 222) used for the presented mutational and copy number analyses. b. Additional available datasets.
Extended Data Fig. 2 ∣
Extended Data Fig. 2 ∣. Mutation burden by time point and subtype.
a. Boxplots and paired lines depicting coverage adjusted mutation frequencies in initial and matched recurrent samples across three subtypes. Wilcoxon signed-rank test P-values and sample sizes are indicated. b. Bee swarm plot depicting coverage adjusted mutation frequencies in fractions by subtype. Dashed line indicates the mean. One-way ANOVA P-values comparing three subtypes are indicated. c. Scatter plot showing the relationship between age at diagnosis and coverage adjusted mutation burdens by subtype and fraction. Linear model P-values are indicated and were adjusted by subtype. d. Similar to the analysis presented in c, but showing the relationship between time to recurrence and coverage adjusted mutation burdens.
Extended Data Fig. 3 ∣
Extended Data Fig. 3 ∣. Mutational signatures by fraction and subtype.
a. Correlation plot showing the Pearson’s chi-squared (X2) residuals for each signature by fraction and subtype. A X2 was performed for each subtype and P-values are indicated. Positive residuals (blue) indicate a positive correlation, whereas negative residuals (red) indicate an anticorrelation. The point size reflects the contribution to X2 estimate. b. The same ordered of patients as Fig. 1a along with relevant clinical information is provided alongside the fraction-specific mutational signatures. PyClone mutational clusters are also presented.
Extended Data Fig. 4 ∣
Extended Data Fig. 4 ∣. Hypermutator clonality.
a. Bar plots represent counts of recurrence-only mutations per hypermutator tumor that were known to receive alkylating agent therapy and were successfully run through the PyClone algorithm. Colors indicate mutation clonality and color intensity indicates whether the mutations resulted in coding changes. b. Kaplan-Meier curve comparing alkylating agent-treated patients with IDHmut-noncodel hypermutator tumors that were predominantly clonal (n = 8), predominantly subclonal (n = 7), versus IDHmut-noncodel non-hypermutators known to be treated with alkylating agents and had available PyClone data (n = 17). Log-rank P-value is shown.
Extended Data Fig. 5 ∣
Extended Data Fig. 5 ∣. Clonal structure evolution over time.
a. The minimum cancer cell fraction of the most persistent (shared between initial and recurrence) PyClone cluster. b. Comparison of PyClone clusters ranked by CCF in matched initial and recurrent tumors, as Fig. 2b but separated by subtype. c-d. Examples of cluster CCF dynamics over time in three separate samples, including (c) two multi-timepoint samples (d) and one multi-sector sample. These additional data are available in the GLASS resource, but only two time-separated samples were used throughput the manuscript to ensure clarity.
Extended Data Fig. 6 ∣
Extended Data Fig. 6 ∣. Variant allele fraction distribution
(a) Non-hypermutator variant allele fraction distributions for copy neutral variants in coding regions (n = 181 patients). Variants are separated by subtype, fraction, and also whether the variant was non-synonymous or synonymous mutation in a coding region. R2 goodness-of-fit measure and associated P-values are shown for both mutation types. Note that this data considers only the coding portion of genome while Fig. 2d presents both coding and non-coding. (b) The cumulative distribution of the subclonal mutations in copy-neutral regions for hypermutators (n = 31 patients). For each variant fraction and subtype, the R2 goodness-of-fit measure and P-values are shown.
Extended Data Fig. 7 ∣
Extended Data Fig. 7 ∣. Driver gene nomination.
a. Local (gene-wise) dNdScv estimates by subtype (rows) and fraction (columns). Genes are sorted by Q-value and P-value. The Q-value is shown in color, whereas the P-value is indicated in light gray. The Q-value threshold of 0.05 is indicated by a horizontal red line. b. GISTIC significant amplification (red) and deletion (blue) plots in initial (left) and recurrent tumors (right). Chromosomal locations are ordered on the y-axis, Q-values are shown on the x-axis, and selected drivers are indicated by their chromosomal location on the right.
Extended Data Fig. 8 ∣
Extended Data Fig. 8 ∣. Driver acquisition over time
a. Tabulated numbers of SNV (top) and CNV (bottom) driver events that were shared, initial-only, or recurrence-only. P-values were obtained using a two-sided Fisher test comparing the initial-only fraction to the recurrence-only fraction testing for acquisition. b. One-sided Fisher test comparing the initial-only fraction to the recurrence-only fraction amongst previously implicated glioma drivers testing for driver acquisition. P-values were adjusted for multiple testing using the FDR (x-axis). Hypermutators (red) and non-hypermutators (black) were separately analyzed.
Extended Data Fig. 9 ∣
Extended Data Fig. 9 ∣. Intra-tumor CCF comparison.
Ladder plots comparing the CCF of co-occurring drivers in single tumor samples. The color of the lines and points indicates whether the sample shown is an initial (brown) or recurrent (green) tumor. Two-sided Wilcoxon rank-sum test P-values are shown for all initial samples, all recurrent samples, as well as all samples (black).
Extended Data Fig. 10 ∣
Extended Data Fig. 10 ∣. Between time point intra-patient CCF comparison.
a. Driver-gene CCF comparison between initial and matched recurrences. Lines are colored by variant classification. Two-sided Wilcoxon rank-sum test P-values are shown. b. TP53 CCF by subtype, otherwise as in (a). c. IDH1 CCF by subtype, otherwise as in (a). d. Ladder plot visualizing CCF change across all SNVs between initial and recurrent tumors, separated by subtype. Wilcoxon rank-sum test was used to test for differences between time points. e. Initial and recurrent mutations in each patient were compared using a Wilcoxon rank-sum test. Bar plot with counts of patients in each subtype are shown. Patients lacking significant change are shown in yellow, those with a significant increase or decrease are shown in dark and light blue, respectively.
Extended Data Fig. 11 ∣
Extended Data Fig. 11 ∣. Aneuploidy calculation
a. Heatmap displaying the chromosomal arm-level events (x-axis) with patients represented in each row. Patients are placed in the same order for both the initial (left) and recurrence (right). White space was inserted as a break between the three subtypes. b. Distribution of total aneuploidy difference. Acquired aneuploidy determination (upper-quartile) indicated with a red line. c. Comparison of aneuploidy score between initial and recurrent tumors separated by subtype d. As (c), comparing aneuploidy value.
Extended Data Fig. 12 ∣
Extended Data Fig. 12 ∣. Neoantigen evolution and cellular analysis
a. Bar plots representing the number of shared mutations that give rise to neoantigens (top row, “immunogenic”) and those that do not give rise to neoantigens (bottom row, “non-immunogenic”) stratified by longitudinal clonality (“(clonality in initial)-(clonality in recurrence)”) and further separated by subtype. Percentage of longitudinal clonality per subtype and mutation immunogenicity are presented above the respective bars. b. Left: Ladder plot depicting the difference in observed-to-expected neoantigen ratio between the initial and recurrent tumors of patients with hypermutated tumors at recurrence. Each set of points connected by a line represents one tumor (n = 70). Right: Boxplot depicting the distribution of observed to expected neoantigen ratios in recurrent tumors stratified by hypermutator status (n = 35 and 183 for hypermutators and non-hypermutators, respectively). Each box spans quartiles, with the lines representing the median ratio for each group. Whiskers represent absolute range, excluding outliers. P-values for panel b were calculated using a paired and unpaired two-sided t-test, respectively. c. Stacked bar plots depicting the average relative fraction of 11 CIBERSORT cell types in the neoantigen depleted (< 1) and non-depleted (> 1) initial and recurrent tumor subgroups. Asterisks to the right of each plot indicate a significant difference (P < 0.05, Wilcoxon rank-sum test) between the depleted and non-depleted groups for the noted cell type at that time.
Fig. 1 ∣
Fig. 1 ∣. Temporal changes in glioma mutational burden and processes.
a. Each column represents a single patient (n = 222) at two separate timepoints grouped by glioma subtype and ordered left-to-right by decreasing mutation frequency at recurrence. Top, mutation frequency differences between initial and recurrent tumors. Blue dotted line indicates increased mutation frequency while a red dotted line indicates decreased mutational frequency. Stacked bar plot reflects the proportion of total mutations shared (mustard), private to initial (magenta), or private to recurrence (blue). Clinical information including hypermutation status, therapy, and grade changes. b. Stacked bar plot (n=219) indicating the dominant mutational signature among initial, recurrent and shared mutation fractions stratified by glioma subtype. c. The proportion of glioma recurrences with alkylating agent-related hypermutation, grouped by glioma subtype. Fisher’s exact test was used to compare proportions between subtypes. d. Kaplan-Meier curve depicting overall survival in hypermutant (red) versus non-hypermutant (blue) alkylating agent treated patients amongst IDHwt (left, n = 99) and IDHmut-noncodel (right, n = 32) tumors. Log-rank test P-values are shown.
Fig. 2 ∣
Fig. 2 ∣. Quantifying selective pressures during glioma evolution.
a. Schematic depiction of cancer cell fraction (CCF) values during tumor evolution indicating clonality and associated relative timing. b. Comparison of PyClone clusters ranked by CCF in matched initial and recurrent tumors. c. Left: dN/dS ratio for all variants (i.e. global) in initial and recurrent tumors for each subtype. Hypermutators were not included (n = 187). Dots represent the global dN/dS ratio with associated Wald confidence intervals. Right: global dN/dS ratios for variant fractions per subtype. d. Cumulative distribution of subclonal mutations by their inverse variant allele frequency. Mutations were separated by timepoint, variant fraction, and glioma subtype. Deviation from a linear relationship, significant Kolmogorov-Smirnov P-values and R2 below 0.98 indicate selection. e. Sankey plot indicating the breakdown of SubClonalSelection evolutionary modes by subtype and therapy (n = 104). The sizes of the bands reflect sample sizes and band colors highlight the glioma subtype. Gray coloring reflects instances when treatment information was not available. f. Kaplan-Meier curve showing survival differences between IDHwt recurrent tumors demonstrating selection (n = 39) compared with neutrally evolving tumors (n = 44). Log-rank P-value is indicated.
Fig. 3 ∣
Fig. 3 ∣. Patterns of glioma driver frequencies over time.
a. Driver dynamics for SNVs nominated by the dNdScv and CNVs nominated by GISTIC (n = 222). Each column represents a single patient at two separate time points stratified by subtype and ordered left-to-right by the number of driver alterations. The degree of aneuploidy difference (recurrence – initial) offers a summary metric for increases (> 0) or decreases (< 0) in aneuploidy at recurrence. Variants are marked and different shapes indicate whether a variant was shared or private. The variant type is depicted by its color. Stacked bar plots accompanying each gene/arm provide cohort-level proportions for whether the alteration was shared, lost, or acquired. b. Aneuploidy comparison in matching initial and recurrent IDHmut-noncodel tumors. c. Within-sample CCF comparison of CDKN2A homozygous deletion (homdel) to genome-wide CCF as a proxy for aneuploidy. A relative higher CCF indicates temporal precedence. Wilcoxon signed-rank test P-value is indicated. d. Kaplan-Meier curve comparing survival in IDHmut-noncodel tumors with an alteration in the cell cycle, acquired aneuploidy, or both (shades of red) versus unaltered IDHmut-noncodel tumors (blue). Log-rank P-value is shown.
Fig. 4 ∣
Fig. 4 ∣. Neoantigen selection during tumor progression.
a. Mean proportion of coding mutations giving rise to neoantigens (neoantigens/nonsynonymous) stratified by glioma subtype and timepoint (n = 222). Error bars represent standard deviation. b. Boxplot depicting the distribution of observed to expected neoantigen ratios in the GLASS cohort stratified by glioma subtype. P-value was calculated using the Wilcoxon rank-sum test. Each box spans quartiles, with the lines representing the median ratio for each group. Whiskers represent absolute range, excluding outliers. c. Scatterplot depicting the association between the observed-to-expected neoantigen ratio in a patient’s initial versus recurrent tumor. Each point represents a single patient. R represents Pearson correlation coefficient. Panels b and c only include samples with at least 3 neoantigens in the initial and recurrent tumors (n = 131, 63, and 24 for IDHwt, IDHmut-noncodel, and IDHmut-codel, respectively). d. Ladder plot depicting the difference in observed-to-expected neoantigen ratio between a tumor’s clonal and subclonal neoantigens. Each set of points connected by a line represents one tumor. Tumors are stratified by whether they were a patient’s initial or recurrent tumor. Lines are colored by each patient’s glioma subtype. Panel d only includes samples with at least 3 clonal neoantigens and at least 3 subclonal neoantigens in both the initial and recurrent tumors (n = 35, 20 and 9 for IDHwt, IDHmut-noncodel, and IDHmut-codel, respectively). P-value was calculated using a paired two-sided t-test. Colors in each panel represent the glioma subtype and are denoted at the bottom of the figure.

Comment in

References

    1. Barthel FP, Wesseling P & Verhaak RGW Reconstructing the molecular life history of gliomas. Acta Neuropathol 135, 649–670, doi:10.1007/s00401-018-1842-y (2018). - DOI - PMC - PubMed
    1. Sturm D et al. Paediatric and adult glioblastoma: multiform (epi)genomic culprits emerge. Nat Rev Cancer 14, 92–107, doi:10.1038/nrc3655 (2014). - DOI - PMC - PubMed
    1. Bettegowda C et al. Mutations in CIC and FUBP1 contribute to human oligodendroglioma. Science 333, 1453–1455, doi:10.1126/science.1210557 (2011). - DOI - PMC - PubMed
    1. Zheng S et al. A survey of intragenic breakpoints in glioblastoma identifies a distinct subset associated with poor survival. Genes Dev 27, 1462–1472, doi:10.1101/gad.213686.113 (2013). - DOI - PMC - PubMed
    1. Cancer Genome Atlas Research, N. Comprehensive genomic characterization defines human glioblastoma genes and core pathways. Nature 455, 1061–1068, doi:10.1038/nature07385 (2008). - DOI - PMC - PubMed

Publication types

Substances