. 2019 Nov;575(7784):652-657.
doi: 10.1038/s41586-019-1765-3. Epub 2019 Nov 20.

Genetic predisposition to mosaic Y chromosome loss in blood

Deborah J Thompson  1 Giulio Genovese  2   3   4 Jonatan Halvardson  5 Jacob C Ulirsch  3   6 Daniel J Wright  7   8 Chikashi Terao  9   10   11   12 Olafur B Davidsson  13 Felix R Day  7   14 Patrick Sulem  13 Yunxuan Jiang  15 Marcus Danielsson  5 Hanna Davies  5 Joe Dennis  1 Malcolm G Dunlop  16 Douglas F Easton  1 Victoria A Fisher  17 Florian Zink  13 Richard S Houlston  18 Martin Ingelsson  19 Siddhartha Kar  20 Nicola D Kerrison  7 Ben Kinnersley  18 Ragnar P Kristjansson  13 Philip J Law  18 Rong Li  21 Chey Loveday  18 Jonas Mattisson  5 Steven A McCarroll  2   3   4 Yoshinori Murakami  22 Anna Murray  23 Pawel Olszewski  24 Edyta Rychlicka-Buniowska  5   24 Robert A Scott  7 Unnur Thorsteinsdottir  13   25 Ian Tomlinson  26 Behrooz Torabi Moghadam  5 Clare Turnbull  18   27 Nicholas J Wareham  7 Daniel F Gudbjartsson  13   28 International Lung Cancer Consortium (INTEGRAL-ILCCO)Breast Cancer Association ConsortiumConsortium of Investigators of Modifiers of BRCA1/2Endometrial Cancer Association ConsortiumOvarian Cancer Association ConsortiumProstate Cancer Association Group to Investigate Cancer Associated Alterations in the Genome (PRACTICAL) ConsortiumKidney Cancer GWAS Meta-Analysis ProjecteQTLGen ConsortiumBiobank-based Integrative Omics Study (BIOS) Consortium23andMe Research TeamYoichiro Kamatani  9   12   29 Eva R Hoffmann  30 Steve P Jackson  31   32 Kari Stefansson  13   25 Adam Auton  15 Ken K Ong  7 Mitchell J Machiela  17 Po-Ru Loh  3   33 Jan P Dumanski  5   24 Stephen J Chanock  17 Lars A Forsberg #  5   34 John R B Perry #  35   36
Affiliations

Genetic predisposition to mosaic Y chromosome loss in blood

Deborah J Thompson et al. Nature. 2019 Nov.

Abstract

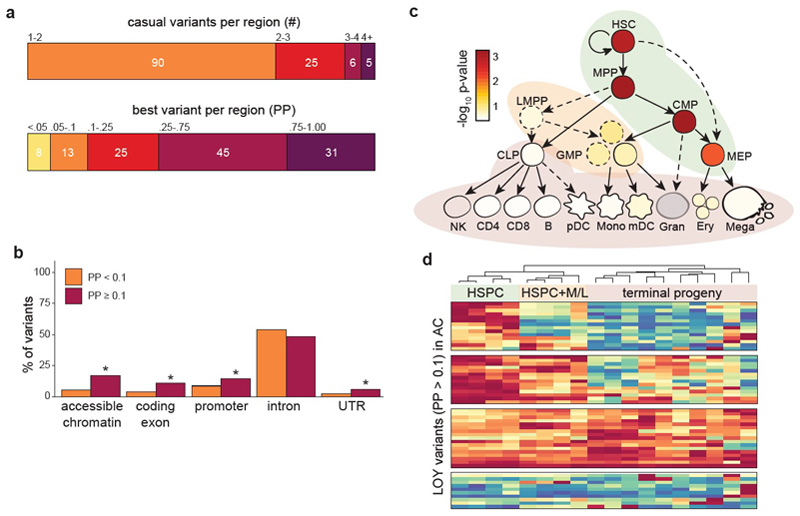
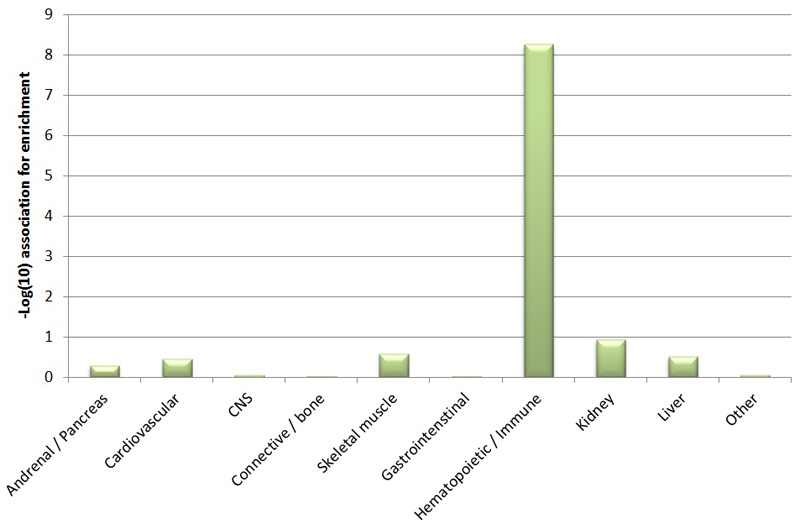
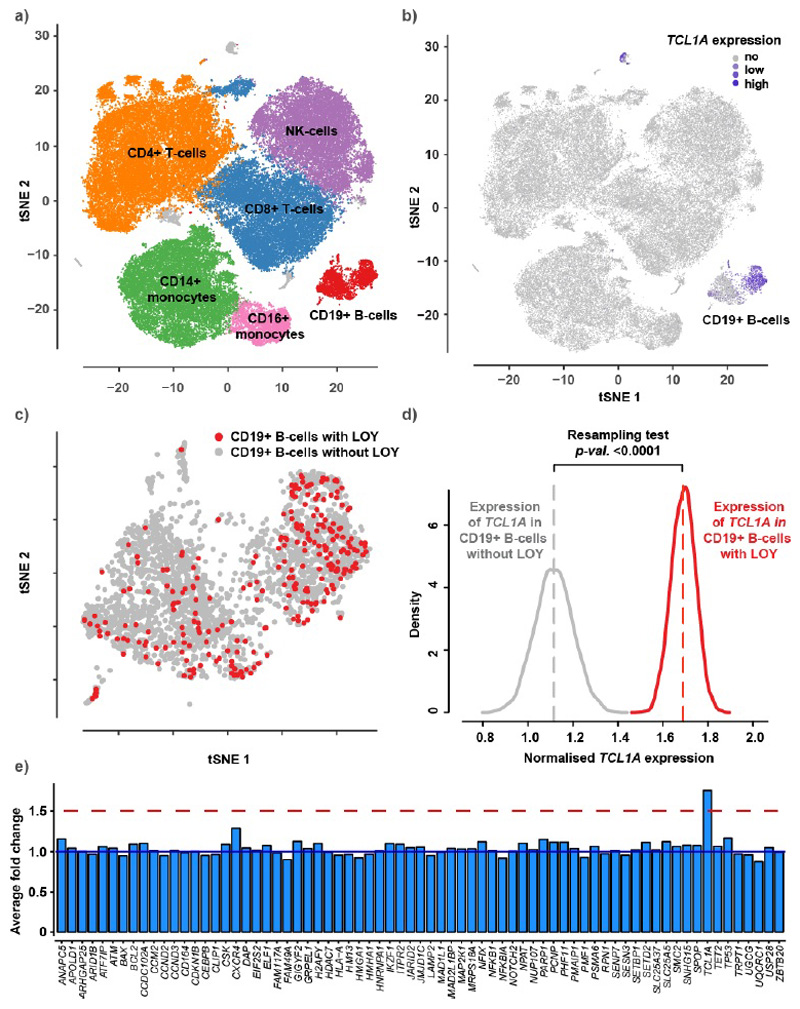
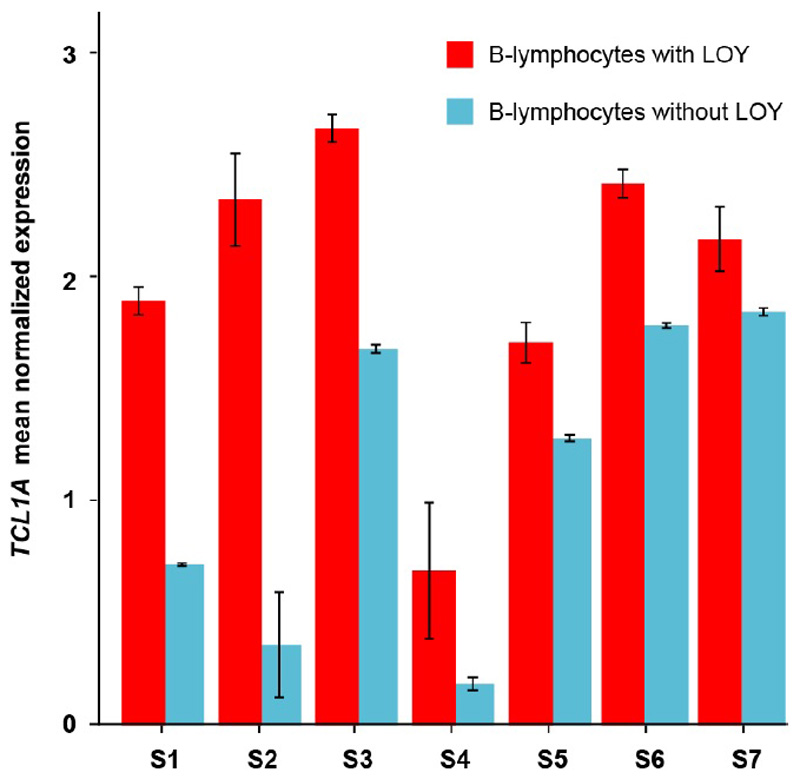
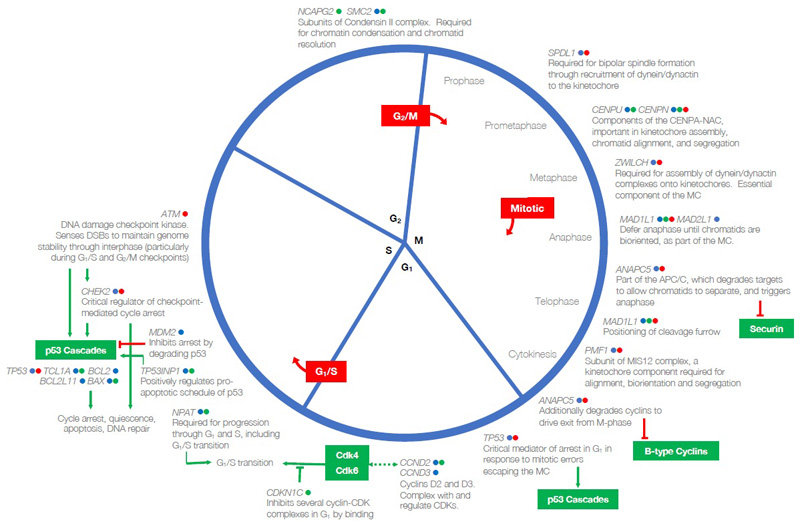
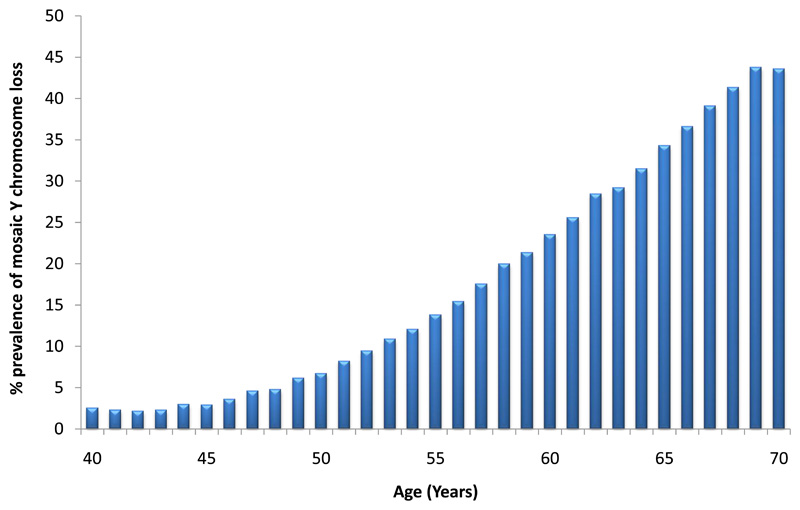
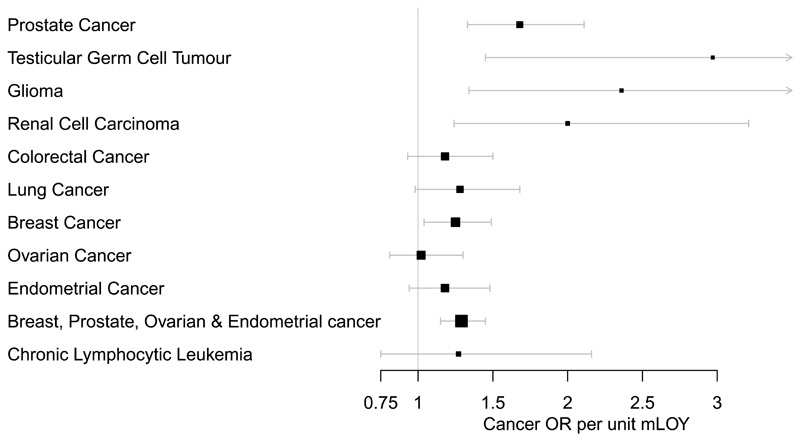
Mosaic loss of chromosome Y (LOY) in circulating white blood cells is the most common form of clonal mosaicism1-5, yet our knowledge of the causes and consequences of this is limited. Here, using a computational approach, we estimate that 20% of the male population represented in the UK Biobank study (n = 205,011) has detectable LOY. We identify 156 autosomal genetic determinants of LOY, which we replicate in 757,114 men of European and Japanese ancestry. These loci highlight genes that are involved in cell-cycle regulation and cancer susceptibility, as well as somatic drivers of tumour growth and targets of cancer therapy. We demonstrate that genetic susceptibility to LOY is associated with non-haematological effects on health in both men and women, which supports the hypothesis that clonal haematopoiesis is a biomarker of genomic instability in other tissues. Single-cell RNA sequencing identifies dysregulated expression of autosomal genes in leukocytes with LOY and provides insights into why clonal expansion of these cells may occur. Collectively, these data highlight the value of studying clonal mosaicism to uncover fundamental mechanisms that underlie cancer and other ageing-related diseases.


Conflict of interest statement

Conflicts of interest

L.A.F. and J.P.D. are cofounders and shareholders in Cray Innovation AB

Figures

Extended Data Figure 1
Extended Data Figure 1. Liability-scale heritability explained vs chromosome size.
The number of genotyped variants on each chromosome is used as a proxy measure for chromosome size.
Extended Data Figure 2
Extended Data Figure 2. Distribution of allele frequency and effect size for the 156 identified LOY loci.
Individual SNP effect estimates are taken from the UK Biobank discovery sample.
Extended Data Figure 3
Extended Data Figure 3. SNP beta estimate comparison for the 156 LOY loci in discovery analyses including or excluding cancer cases.
Effect estimates were compared between a LOY discovery GWAS analysis either including cancer cases (analysed N=205,011) or excluding cancer cases (analysed N=187,953). Squared Pearson correlation co-efficient is shown.
Extended Data Figure 4
Extended Data Figure 4. The impact of sample size and Y chromosome PAR1 / Non-PAR ratio on PAR-LOY power over mLRR-Y.
Extended Data Figure 5
Extended Data Figure 5. Results from fine-mapping analyses.
All analyses were performed on genome-wide summary statistic data from the UKBB discovery analysis (N=205,011). Two-tailed p-values for enrichment were calculated using GoShifter. Panel a shows the posterior expected number of causal variants (top) as well as the best fine-mapped variant (bottom) in each region. Genomic enrichments for variants stratified by posterior probability are shown in panel b. Fine-mapped variants were enriched for accessible chromatin in hematopoiesis, as well as in exons, promoters, and UTRs of protein coding genes, but not for introns. Panel c shows g-chromVAR cell-type enrichments across the hematopoietic tree for LOY. HSCs, MPPs, and CMPs meet Bonferroni threshold (α = 0.05 / 18). Developmental patterns of accessible chromatin for variants with posterior probability > 10% are shown in panel d, revealing that 14 variants are fully restricted to acting within HSPCs, 14 variants can also have regulatory effects in myeloid and lymphocyte progenitors, and 17 variants are capable of acting across the majority of hematopoiesis. K-means clustering (k = 4 determined by the gap statistic) was used to identify patterns of accessibility, and cell types were hierarchically clustered. HSC, hematopoietic stem cell; MPP, multi-potent progenitor; CMP, common myeloid progenitor; HSPC, hematopoietic stem and progenitor cell; M/L, myeloid and lymphoid; PP, posterior probability; AC, accessible chromatin; UTR, untranslated region; PChiC, promoter capture Hi-C; eQTL, expression quantitative trait locus; corr, ATAC/chromatin-RNA correlations.
Extended Data Figure 6
Extended Data Figure 6. Cell and tissue type enrichment estimated using LDSC-SEG
Extended Data Figure 7
Extended Data Figure 7. Single-cell RNA sequencing results.
Panel a shows clustering and identification of cell types using a tSNE plot generated from a pooled dataset of PBMC’s (cell N=86,160) isolated from peripheral blood in 19 male donors. The TCL1A gene was expressed in the B-lymphocytes as indicated by blue color in panel b. Analysis of LOY status in the B-lymphocytes identified 277 cells with LOY, plotted in red color in panel c. Panel d displays the result from a resampling test performed to compare the expression of TCL1A in LOY B-lymphocytes (N=277) with its expression in non-LOY B-lymphocytes (N=2,459). The grey and red curves in panel d represent the resampled distribution of TCL1A expression in non-LOY and LOY cells, respectively. The resampling test established an increased expression of TCL1A in B-lymphocytes with LOY (fold change=1.68, two-sided p<0.0001). Panel e display fold changes in gene expression between LOY and non-LOY B-lymphocytes for 71 selected genes from the list of genes mapping to the 156 index variants. Genes expressed in >5% of the investigated B-lymphocytes were included. The blue line at fold change 1 in panel e represents no differential expression and the red line shows the level of 50% overexpression in LOY cells.
Extended Data Figure 8
Extended Data Figure 8. Differential expression of the TCL1A gene in B-lymphocytes with (N=2,459) and without (N=277) the Y chromosome within individual subjects.
Error bars indicate the 95% confidence interval of the mean normalized expression of TCL1A within each group. To avoid stochastic effects that might occur in estimations using a small number of cells, results are shown for individuals with LOY in at least 10% of the B-lymphocytes and with LOY in more than five individual B-lymphocytes. Within each of the seven individuals (S1-S7) meeting this criteria, TCL1A showed a higher expression in the LOY cells compared to normal cells. This suggests that the observed TCL1A overexpression in B-lymphocytes without a Y chromosome is independent from the individual genotypes at the lead GWAS-SNP (rs2887399).
Extended Data Figure 9
Extended Data Figure 9. Many LOY-associated genes converge on mechanistic and regulatory aspects of the cell cycle.
All genes shown have been prioritized as potentially functional genes at our reported GWAS loci; gene symbols may be shown more than once. Coloured indicators next to each gene symbol specify the type of evidence on which it has been prioritized at its respective locus: blue, nearest protein-coding gene; green, eQTL; red, contains a highly correlated non-synonymous variant. Red boxes indicate each of the three known cell cycle checkpoints. Red inhibition connectors denote that a target is inhibited by degradation, green by binding. Green arrows indicate a signaling cascade and its effector or final physiological effect. Bidirectional dashed green arrows indicate the formation of a complex between the products of the two connected genes. Excepting p53, proteins contained within green boxes have not been implicated in this GWAS, but are important interactors of implicated genes. CENPA-NAC, CENPA nucleosome-associated complex; APC/C, anaphase-promoting complex/cyclosome; MC, mitotic checkpoint; CDK, cyclin-dependent kinase.
Figure 1
Figure 1. Prevalence of mosaic Y chromosome loss by age in UK Biobank study participants (N=205,011).
Figure shows the full age distribution of all male UK Biobank study participants at baseline.
Figure 2
Figure 2. The impact of genetic susceptibility to LOY on cancer outcomes.
The genetic risk score is comprised of the 156 LOY-associated loci identified in the UKBB discovery analysis (N=205,011). The error bars denote the 95% confidence intervals around the point estimate odds-ratio effect, with the value 1 denoting no effect.

Comment in

  • Getting wise about lost Ys.
    Clyde D. Clyde D. Nat Rev Genet. 2020 Feb;21(2):70. doi: 10.1038/s41576-019-0202-7. Nat Rev Genet. 2020. PMID: 31796887 No abstract available.

References

    1. Jacobs PA, Brunton M, Court Brown WM, Doll R, Goldstein H. Change of human chromosome count distribution with age: evidence for a sex differences. Nature. 1963;197:1080–1081. - PubMed
    1. Jacobs PA, Court Brown WM, Doll R. Distribution of human chromosome counts in relation to age. Nature. 1961;191:1178–1180. - PubMed
    1. Zhou W, et al. Mosaic loss of chromosome Y is associated with common variation near TCL1A. Nat Genet. 2016;48:563–568. - PMC - PubMed
    1. Wright DJ, et al. Genetic variants associated with mosaic Y chromosome loss highlight cell cycle genes and overlap with cancer susceptibility. Nat Genet. 2017;49:674–679. - PMC - PubMed
    1. Forsberg LA, Gisselsson D, Dumanski JP. Mosaicism in health and disease - clones picking up speed. Nat Rev Genet. 2017;18:128–142. - PubMed

Publication types

Substances