. 2019 Nov 5:10:2475.
doi: 10.3389/fmicb.2019.02475. eCollection 2019.

Genomic Signatures for Sedimentary Microbial Utilization of Phytoplankton Detritus in a Fast-Flowing Estuary

Affiliations

Genomic Signatures for Sedimentary Microbial Utilization of Phytoplankton Detritus in a Fast-Flowing Estuary

Maria W Smith et al. Front Microbiol. .

Abstract

In fast-flowing, river-dominated estuaries, "hotspots" of microbial biogeochemical cycling can be found within areas of extended water retention. Lateral bays located off of the North and South channels of the Columbia River estuary are proposed to be such hotspots. Previous metagenomic studies on water samples indicated that these regions function both as sources and sinks of biogenic particles, with potential to impact organic matter fluxes in the estuary. To extend this work, we analyzed 11 sediment metagenomes from three disparate bays: the freshwater Cathlamet Bay, and the brackish Youngs Bay and more saline Baker Bay located nearer the mouth to the south and north of the main channel, respectively. Samples were collected from upper layers of sediments in August of 2011 and 2013 for DNA extraction and metagenome sequencing. All metagenomes were dominated by bacterial sequences, although diatom sequences as high as 26% of the total annotated sequences were observed in the higher salinity samples. Unsupervised 2D hierarchical clustering analysis resulted in the eleven metagenome samples clustered into four groups by microbial taxonomic composition, with Bacteroides, diatom, and phage levels driving most of the grouping. Results of functional gene clustering further indicated that diatom bloom degradation stage (early vs. late) was an important factor. While the Flavobacteriia and Cytophagia classes were well represented in metagenomes containing abundant diatoms, taxa from the Bacteroidia class, along with certain members of the Sphingobacteriia class, were particularly abundant in metagenomes representing later stages of diatom decomposition. In contrast, the sediment metagenomes with low relative abundance of diatom and Bacteroidetes sequences appeared to have a metabolic potential biased toward microbial growth under nutrient limitation. While differences in water salinity clearly also influenced the microbial community composition and metabolic potential, our results highlight a central role for allochthonous labile organic matter (i.e., diatom detritus), in shaping bacterial taxonomic and functional properties in the Columbia River estuary lateral bay sediments. These results suggest that in fast-flowing, river-dominated estuaries, sediment microbial communities in areas of extended water retention, such as the lateral bays, may contribute disproportionately to estuarine organic matter degradation and recycling.

Keywords: Bacteroidetes; bacteriophage; estuarine sediments; metagenomics; microbial community; phytoplankton.


Figures

FIGURE 1
FIGURE 1
Contour map of the lower Columbia River estuary. The locations of nine sediment sampling sites are shown as red circles. The sampling site names are as the following: BBB, Baker Bay boat launch; BBI, Baker Bay Ilwaco Harbor; BBC, Baker Bay Chinook; BBA, Baker Bay airport; YBM, Youngs Bay mouth; YBB, Youngs Bay back; CBA, Cathlamet Bay site A; CBC, Cathlamet Bay site C; CBK, Cathlamet Bay Knappa. The white triangles show locations of the SATURN monitoring stations providing continuous flow-through physical and biogeochemical data. This figure was modified from Figure 1 of Baptista et al. (2015). © Higher Education Press and Springer-Verlag Berlin Heidelberg 2015.
FIGURE 2
FIGURE 2
(A) A plot of daily calculations of the Coastal Upwelling Index (at 45° North). Values above zero indicate coastal upwelling. (B) Continuous flow-through measurements of chlorophyll a (chl a) concentrations (Y-axis, μg/L) at SATURN endurance stations from August 1 to August 23, 2013 (X-axis, time in days). Chl a values are colored by water salinity (the color scale is shown at the bottom). The presented chl a data have not been cross-calibrated using laboratory measurements in collected water samples, thus, they cannot be directly compared between sensors, however, we used them to examine the temporal trends at each station. Red arrows indicate time of sampling.
FIGURE 3
FIGURE 3
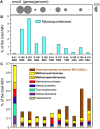
Assessment of the archaeal community composition and metabolic potential using the abundance of (A) the functional gene category of archaeal ammonia monooxygenase subunit A (amoA) (Pfam12942) with the values expressed as the number of genes per genome; (B) the Nitrosopumilaceae family; and (C) all other archaeal taxa (with the three most abundant taxa shown in bold lettering), and values expressed as the percentages of the corresponding genes relative to total predicted archaeal, bacterial and viral genes (% total ABV). The predicted taxonomic gene annotations were based on ≥60% identity over ≥70% of the alignment length. The abundance values for amoA are proportionate to the bubble width, and the scale is indicated with a half-bubble to the right with the genes/genome value indicated by a number. Metagenome names are composed of the sample name (BBB, Baker Bay boat launch; BBI, Baker Bay Ilwaco Harbor; BBC, Baker Bay Chinook; BBA, Baker Bay airport; YBM, Youngs Bay mouth, YBB, Youngs Bay back; CBA, Cathlamet Bay site A; CBC, Cathlamet Bay site C; CBK, Cathlamet Bay Knappa) and the database sample number.
FIGURE 4
FIGURE 4
Taxonomic composition of Bacteria from predicted gene annotations in the assembled sediment metagenomes. Predicted peptides were annotated using the cutoff of ≥30% identity over ≥70% of the alignment length. Relative taxon abundances are expressed as percentages of the corresponding genes to total predicted archaeal, bacterial and viral genes (% total ABV). (A) Classes from the top two most abundant bacterial phyla, Proteobacteria and Bacteroidetes; (B) next 11 most abundant bacterial phyla. Metagenome names are described in Figure 3.
FIGURE 5
FIGURE 5
(A) 2D Hierarchical clustering (Spearman correlation, average linkage) of bacterial families (X-axis) in metagenomes (Y-axis). In total, 160 bacterial families were selected, each representing ≥0.35% of all annotated prokaryotic genes across metagenomes. For each family, abundance was calculated as the percentage of all corresponding genes (annotated using ≥60% sequence identity over >70% of the alignment length) to total annotated bacterial, archaeal and viral genes in the corresponding metagenome. Abundance values are shaded from white to black on a scale indicating percentages from low to high, respectively, as shown on the scale below the plot. (B) Functional gene categories (pfam), with the abundances expressed as numbers of genes per effective genome equivalent (genes/genome). One thousand three hundred and eighty-three genes were selected as having average abundance ≥1 gene/genome. Metagenome names are described in Figure 3.
FIGURE 6
FIGURE 6
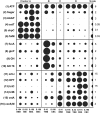
(A) Families of potential bloom-utilizing bacteria abundant in Cluster A metagenomes together with the bacteriophage order Caudovirales. (B) Bacteroidetes families/genera abundant in cluster B metagenomes (in S.43_YBM in particular). Abundance values are expressed as percentages of the corresponding genes relative to the total annotated archaeal, bacterial and viral genes in a given metagenome (% of total ABV). All annotations are based on ≥60% identity over ≥70% of the alignment length. The abundance values are proportionate to the bubble width. The scale for each row is indicated with a half-bubble to the right, and its diameter corresponds to a percentage value indicated by a number. The metagenomes are grouped into four clusters (A, B, C, and D) corresponding to those shown in Figure 5.
FIGURE 7
FIGURE 7
Functional gene categories enriched in particular metagenome clusters (genes/genome). The abundance values are proportionate to the bubble width. The scale for each row is indicated with a half-bubble to the right, and its diameter corresponds to genes/genome values shown with a number. The metagenomes are grouped into four clusters (A, B, C, and D) corresponding to those shown in Figure 5. The following gene categories are shown: (1) ATP, H(+)-transporting two-sector ATPase (EC:3.6.3.14); (2) Sugar, sugar transporters MFS (PF00083); (3) AAAP, transmembrane amino acid transporter protein (PF01490); (4) sstT, serine/threonine transporter (K07862); (5) chpC, chemosensory pili system protein (KO:K06598); (6) folM, dihydromonapterin reductase/dihydrofolate reductase (KO:K13938); (7) fucA, alpha-L-fucosidase (EC:3.2.1.51); (8) glcP, fucose permease (COG0738); (9) GH, glycosyl hydrolase families GH 49,9,43,2,65 (PF03718 + 14498 + 00759 + 04616 + 00703); (10) GH 78, bacterial alpha-L-rhamnosidase (PF05592); (11) LIV-I, branched-chain amino acid transporters (PF02653 + 12399); (12) OPT, oligopeptide transporter (PF03169); (13) tctC, tripartite tricarboxylate transporter family receptor (PF03401); (14) tctB, tripartite tricarboxylate transporter B (PF07331); (15) cstA, carbon starvation protein (PF02554 + 13722); (16) coxS,M, carbon-monoxide dehydrogenase (KO:K03518 + 3519).
FIGURE 8
FIGURE 8
(A) Functional gene categories associated with sulfur and nitrogen cycle gene pathways, with abundance expressed as genes/genome. The abundance values are proportionate to the bubble width. The scale for each row is indicated with a half-bubble to the right, and its diameter corresponds to genes/genome values indicated by a number. The metagenomes are grouped in four clusters (A, B, C, and D) corresponding to those shown in Figure 5. The following gene categories are shown: (1) cox, cytochrome-c oxidase (EC:1.9.3.1), a gene involved in oxidative phosphorylation; (2) dsr(A, B), dissimilatory sulfite reductases (desulfoviridins, COG2221); (3) nif, nitrogenase involved in nitrogen fixation (EC:1.18.6.1, K02585, K02586, K02587, K02588, K02591); (4) nrfA, nitrite reductase (cytochrome c-552, ammonia-forming) involved in dissimilatory nitrate reduction to ammonia (DNRA) (EC:1.7.2.2, KO:K03385); (5) nirB and nirD, nitrite reductases (NADH) involved in dissimilatory nitrate reduction (DNRA) (EC:1.7.1.15, K00362, K00363); (6) narK, nitrate/nitrite transporter involved in nitrate assimilation (KO:K02575); (7) nirK, nitrite reductase (NO-forming) involved in denitrification (EC:1.7.2.1, K00368); (8) norB, nitric-oxide reductase (cytochrome c) involved in denitrification (EC:1.7.2.5, K04561). (B) Functional genes associated with manganese and potassium transport and response to osmotic stress (genes/genome). The following gene categories are shown: (9) mntH, manganese transport protein (K03322); (10) kup, K+ uptake protein (K03549); (11) kefA, K+ efflux system protein (K05802); (12) proV-W, glycine betaine/proline transport system (K02000-2001). (C) Mn concentrations from bulk chemistry measurements of sediment samples. The sediments correspond to the metagenome labels shown above the bars (B).
FIGURE 9
FIGURE 9
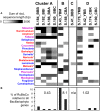
(A) 1D hierarchical clustering (correlation uncentered, average linkage) performed to identify co-occurring families of diatoms across metagenomes. The heat map shows phylogenetic composition of Bacillariophyta genes from the functional gene category KO:K01601 (EC 4.1.1.39), ribulose-bisphosphate carboxylase (RuBisCO). In depth annotations were generated for RuBisCo genes ≥ 500 bp length. Colors indicate the diatom genus origin: blue, freshwater; red, marine; purple, both habitats. Indicate the genera (9 out of 20) that were observed microscopically in the Columbia River lateral bays previously (Simenstad et al., 1984). (B) Percentages of RuBisCO genes relative to all predicted Bacillariophyta genes with ENZYME (EC) annotations. Numbers indicate median percentage values for each cluster. The metagenomes are grouped into the four clusters (A, B, C, and D) corresponding to those shown in Figure 5.
FIGURE 10
FIGURE 10
Abundances of functional gene categories involved in regulation of bacteriophage life cycle (lysogenization and lytic induction). COG2915, negative regulator of phage lambda lysogenization hflD encoded in bacterial genomes; COG3617, COG3645, PF02498, phage/prophage antirepressor genes encoded by bacteriophage genomes. Abundance values are proportionate to the bubble width. The scale for each row is indicated with a half-bubble to the right, and its diameter corresponds to genes/genome values indicated by a number. The metagenomes are grouped into four clusters (A, B, C, and D) corresponding to those shown in Figure 5.

References

    1. Armbrust E. V., Berges J. A., Bowler C., Green B. R., Martinez D., Putnam N. H., et al. (2004). The genome of the diatom Thalassiosira pseudonana: ecology, evolution, and metabolism. Science 306 79–86. 10.1126/science.1101156 - DOI - PubMed
    1. Avlund M., Dodd I. B., Sneppen K., Krishna S. (2009). Minimal gene regulatory circuits that can count like bacteriophage Lambda. J. Mol. Biol. 394 681–693. 10.1016/j.jmb.2009.09.053 - DOI - PubMed
    1. Baker B. J., Lazar C. S., Teske A. P., Dick G. J. (2015). Genomic resolution of linkages in carbon, nitrogen, and sulfur cycling among widespread estuary sediment bacteria. Microbiome J. 3 1–12. 10.1186/s40168-015-0077-6 - DOI - PMC - PubMed
    1. Banuelos M. A., Klein R. D., Alexander-Bowman S. J., Rodriguez-Navarro A. (1995). A potassium transporter of the yeast Schwanniomyces occidentalis homologous to the Kup system of Escherichia coli has a high concentrative capacity. EMBO J. 14 3021–3027. 10.1002/j.1460-2075.1995.tb07304.x - DOI - PMC - PubMed
    1. Baptista A. M., Seaton C., Wilkin M. P., Riseman S. F., Needoba J. A., Maier D., et al. (2015). Infrastructure for collaborative science and societal applications in the Columbia River estuary. Front. Earth Sci. 9 659–682. 10.1007/s11707-015-0540-5 - DOI

LinkOut - more resources