. 2019 Oct 30:10:2487.
doi: 10.3389/fimmu.2019.02487. eCollection 2019.

The NF-κB RelA Transcription Factor Is Critical for Regulatory T Cell Activation and Stability

Affiliations

The NF-κB RelA Transcription Factor Is Critical for Regulatory T Cell Activation and Stability

Emilie Ronin et al. Front Immunol. .

Abstract

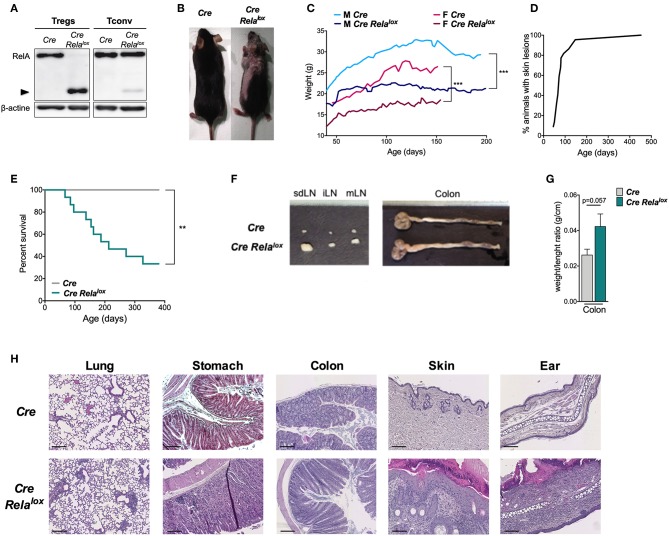
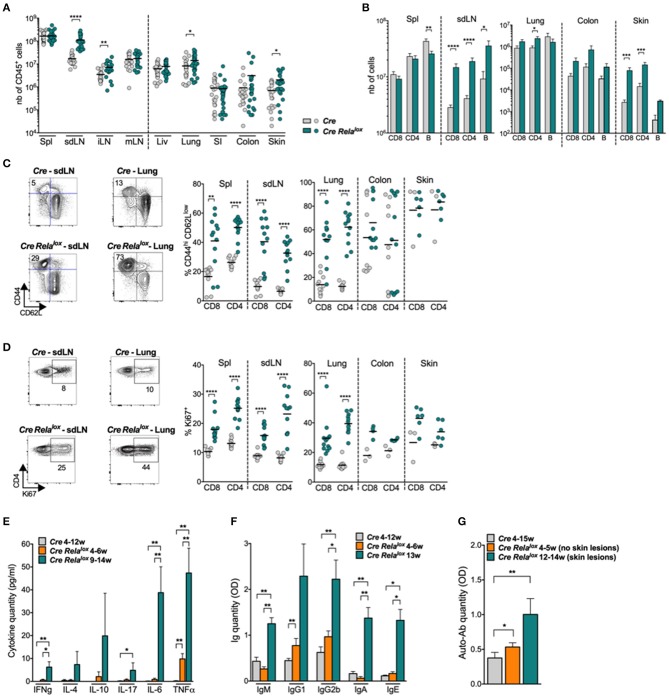
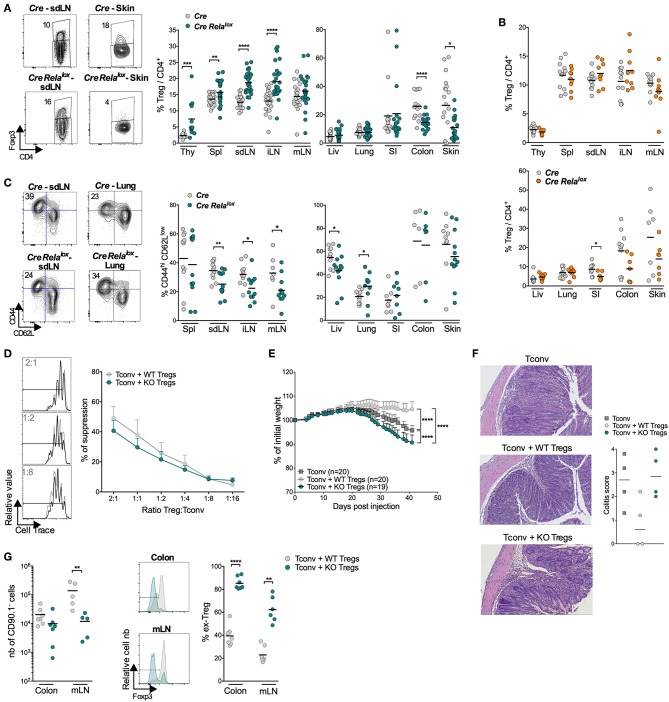
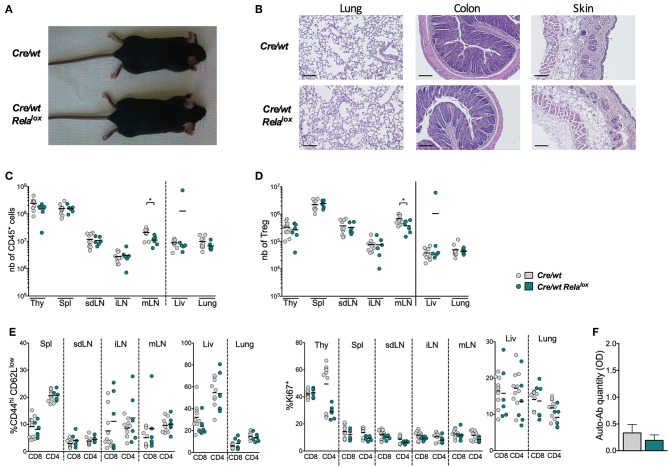
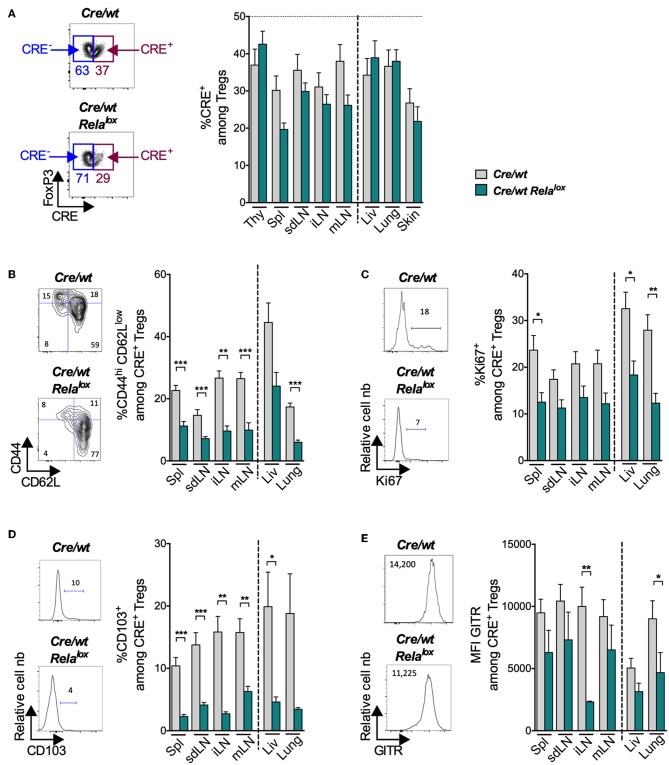
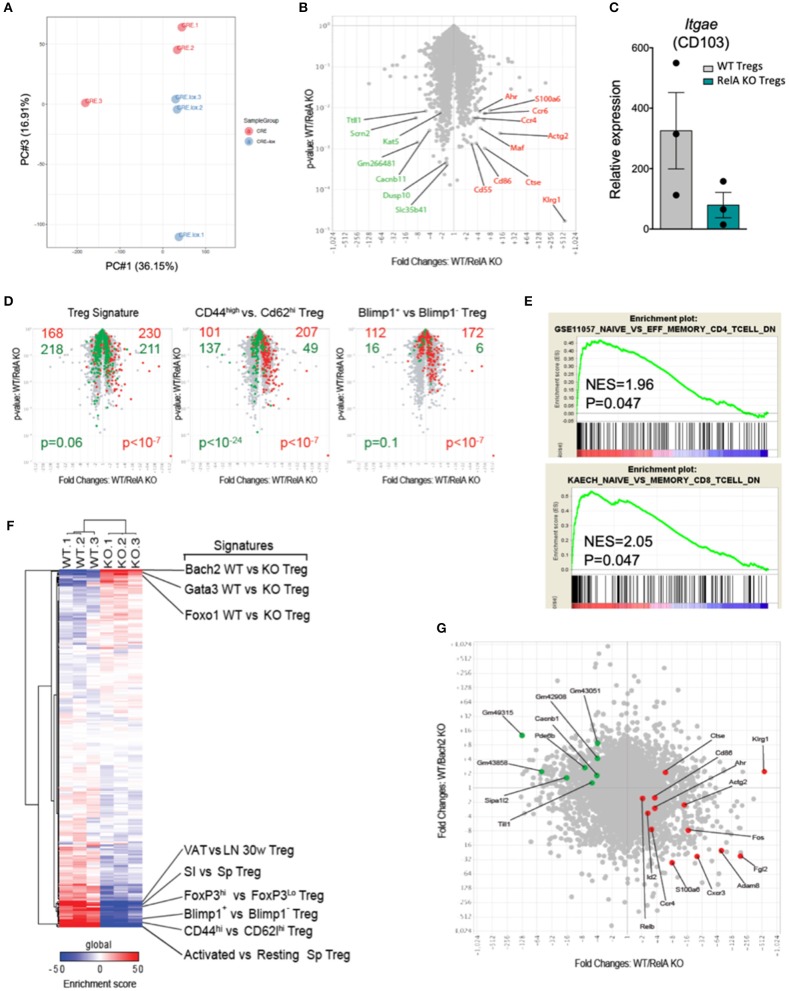
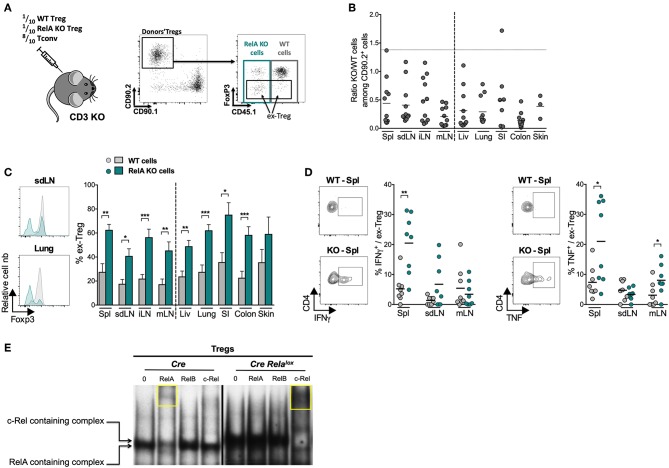
Regulatory T cells (Tregs) play a major role in immune homeostasis and in the prevention of autoimmune diseases. It has been shown that c-Rel is critical in Treg thymic differentiation, but little is known on the role of NF-κB on mature Treg biology. We thus generated mice with a specific knockout of RelA, a key member of NF-κB, in Tregs. These mice developed a severe autoimmune syndrome with multi-organ immune infiltration and high activation of lymphoid and myeloid cells. Phenotypic and transcriptomic analyses showed that RelA is critical in the acquisition of the effector Treg state independently of surrounding inflammatory environment. Unexpectedly, RelA-deficient Tregs also displayed reduced stability and cells that had lost Foxp3 produced inflammatory cytokines. Overall, we show that RelA is critical for Treg biology as it promotes both the generation of their effector phenotype and the maintenance of their identity.

Keywords: NF-κB; activation; autoimmunity; regulatory T cells; relA; stability.


Figures

Figure 1
Figure 1
Mice with RelA deficient Tregs develop systemic inflammation. (A) Western blot analysis of RelA expression in Tregs and CD4+ conventional T cells (Tconv) isolated from Foxp3Cre (Cre) and Foxp3Cre Relalox (Cre Relalox) mice. (B) Representative pictures of 12 week-old Foxp3Cre and Foxp3Cre Relalox mice. (C) Body weight monitoring of Foxp3Cre and Foxp3Cre Relalox males and females. (D) Percentages of Foxp3Cre Relalox mice with skin lesions. (E) Survival monitoring of Foxp3Cre Relalox mice. (F) Representative pictures from 20 mice of the LN and colon of 12 week-old Foxp3Cre and Foxp3Cre Relalox mice. (G) Weight/length ratio of colon of 12 week-old Foxp3Cre and Foxp3Cre Relalox mice. (H) Representative histology from 12 week-old mice of the lung, stomach, colon, skin, and ear of Foxp3Cre and Foxp3Cre Relalox. Scale bars represent 200 μm (lung, Foxp3Cre stomach, colon), 150 μm (Foxp3Cre Relalox stomach), and 100 μm (skin, ear). Data are representative of independent experiments. Bars show the means and error bars represent SEM. For mouse and experiment numbers, see Supplementary Table 1. Statistical significance was determined using a log-rank (Mantel- Cox) test for the mouse survival data. The two-tailed unpaired non-parametric Mann–Whitney U-test was used. **p < 0.01, ***p < 0.001.
Figure 2
Figure 2
High activation of T and B lymphocytes in Foxp3Cre Relalox mice. (A,B) Number of CD45+ (A), CD8+, CD4+, and B cells (B) in the indicated organs (spl, spleen; liv, liver; SI, small intestine) of 12 week-old Foxp3Cre (Cre) and Foxp3Cre Relalox (Cre Relalox) mice. (C,D) Representative dot plots and proportion of CD44hi CD62Llow (C) and Ki67+ (D) among CD8+ and CD4+ Tconv in the indicated organs of 12 week-old Foxp3Cre and Foxp3Cre Relalox mice. (E) Cytokine quantification in the serum of 4–12 week-old Foxp3Cre, and 4–6 week-old and 9–14 week-old Foxp3Cre Relalox mice. (F) Immunoglobulin quantification in the serum of 4–12 week-old Foxp3Cre mice, and 4–6 week-old and 13 week-old Foxp3Cre Relalox mice. (G) Anti-DNA antibody quantification in the serum of 4–15 week-old Foxp3Cre mice, and 4–12 week-old and 12–14 week-old Foxp3Cre Relalox mice. Each dot represents a mouse, lines and bars show the means of pooled independent experiments. Error bars represent SEM. For mouse and experiment numbers, see Supplementary Table 1. The two-tailed unpaired non-parametric Mann–Whitney U-test was used for data not following a normal distribution and the t-test was used for data following a normal distribution. *p < 0.05, **p < 0.01, ***p < 0.001, ****p < 0.0001.
Figure 3
Figure 3
Tregs in Foxp3Cre Relalox mice appear to be less stable. (A) Representative density plot and proportion of Tregs among the CD4+ T cells in the indicated organs (thy, thymus; spl, spleen; liv, liver; SI, small intestine) of 12 week-old Foxp3Cre (Cre) and Foxp3Cre Relalox (Cre Relalox) mice. (B) Proportion of Tregs among CD4+ cells in 5 week-old Foxp3Cre and Foxp3Cre Relalox mice. (C) Representative density plots and proportions of CD44hi CD62Llow among the Tregs of 12 week-old Foxp3Cre and Foxp3Cre Relalox mice. Each dot represents a mouse and lines show the means of pooled independent experiments. (D) In vitro suppressive activity of Treg cells from Foxp3Cre (WT Tregs) and Foxp3Cre Relalox (KO Tregs) 5–6 week-old mice. Representative data at 2:1, 1:2 and 1:8 (left) and different (right) Treg:Tconv ratios of independent experiments. (E–G) In vivo suppressive activity of Treg cells from Foxp3Cre (WT Tregs, 6 week-old mice) and Foxp3Cre Relalox (KO Tregs, 6 week-old mice) mice, determined in a colitis model stopped at 6 weeks for analyses. (E) Percentage of initial body weight pooled from independent experiments. Error bars represent SEM. (F) Representative histology of the colon and colitis scores. (G) Numbers of recovered Tregs (CD90.1 cells), representative histograms and proportions of ex-Treg in the mLN and colon. Each dot represents a mouse and lines show the means of pooled independent experiments. For mouse and experiment numbers, see Supplementary Table 1. The two-tailed unpaired non-parametric Mann–Whitney U test was used for data not following a normal distribution and the t-test was used for data following a normal distribution. *p < 0.05, **p < 0.01, ***p < 0.001, ****p < 0.0001.
Figure 4
Figure 4
Heterozygous Foxp3Cre/wt Relalox do not develop systemic inflammation. (A) Representative pictures of 8 week-old mice. (B) Representative histology of lung, colon and skin of 8 week-old. Scale bars represent 100 μm. Number of CD45+ (C), of Tregs among CD4+ T cells (D), and proportion of CD44hiCD62Llow and Ki67+ among CD8+ and CD4+ conventional T cells (E) in different tissues (thy, thymus; spl, spleen; liv, liver; SI, small intestine) of 8 week-old Foxp3Cre/wt (Cre/wt) and Foxp3Cre/wt Relalox (Cre/wt Relalox) mice. Each dot represents a mouse and lines show the means of pooled independent experiments. (F) Anti-DNA auto-antibodies quantification in the serum of 8 week-old Foxp3Cre/wt and Foxp3Cre/wt Relalox mice. Bars show the means of pooled independent experiments and error bars represent SEM. For mouse and experiment numbers, see Supplementary Table 1. The two-tailed unpaired non-parametric Mann–Whitney U test was used *p < 0.05.
Figure 5
Figure 5
Reduced expression of activation markers in RelA-deficient Tregs at steady state. Analyses in the indicated organs (thy, thymus; spl, spleen; liv, liver) of 8 week-old Foxp3Cre/wt (Cre/wt – gray bars) and Foxp3Cre/wt Relalox (Cre/wt Relalox–green bars) mice. (A) Representative density plots among CD4+ cells to define Tregs expressing CRE (CRE+) and percentages of CRE+ among total Tregs in sdLN. Representative density plots and proportions of CD44hi CD62Llow (B), Ki67+ (C), CD103+ (D) and MFI of GITR (E) among CRE+ Tregs of sdLN. Bars show the means of pooled independent experiments and error bars represent SEM. For mouse and experiment numbers, see Supplementary Table 1. The two-tailed unpaired nonparametric Mann–Whitney U-test was used. *p < 0.05, **p < 0.01, ***p < 0.001.
Figure 6
Figure 6
RelA-deficient Tregs have identity and activation defects. (A) PCA analysis of WT and RelA KO Tregs. (B) Volcano plot of WT vs. RelA KO Tregs. Red and green indicate transcripts up- and down-regulated, respectively, by WT Tregs cells. (C) Relative expression of Itgae (CD103) expressed in counts per million in WT and RelA KO Tregs. (D) WT vs. RelA KO Tregs (as in A) overlaid with various Tregs signatures. Red and green indicate genes up- and down-regulated, respectively, in each signature (chi-squared test for p-value). (E) GSEA plots of RelA-deficient Tregs compared with indicated set of genes up-regulated in effector memory CD4 (upper panel) and memory CD8 conventional T cells (lower panel) (32). (F) Heatmap for the enrichment score of each gene signature (VAT, visceral adipose tissue; LN, lymph nodes; SI, small intestine; Sp, spleen). (G) Fold change-fold change plot of WT vs. RelA KO Tregs (x-axis) and WT iTregs vs. WT Bach2 KO iTregs [y-axis, from published data (7)]. Red and green transcripts from (A). For mouse and experiment numbers, see Supplementary Table 1.
Figure 7
Figure 7
RelA-deficient Tregs are unstable and turn pathogenic. (A–D) Adoptive transfer of a 1:1:8 ratio of a mix of CRE-expressing Tregs from Foxp3Cre/wt (CD45.1/2 CD90.2 WT Tregs), Foxp3Cre/wt Relalox (CD45.2 CD90.2 RelA KO Tregs) mice and CD4+ conventional T cells (CD90.1 Tconv) into CD3 KO mice and analysis of donor cells 16 days later. (A) Experimental scheme and representative gating strategy from sdLN staining. (B) Ratio of RelA KO to WT Tregs in the indicated organs (spl, spleen; liv, liver; SI, small intestine) among CD90.2+ donor cells. The horizontal dot line represents the initial ratio (in the syringe). (C) Representative histograms and proportion of ex-Tregs from injected WT cells and RelA KO cells in different tissues. (D) Representative density plots and proportions of IFNγ+ and TNF+ cells among WT ex-Tregs and RelA KO ex-Tregs. Each dot represents a mouse, lines and bars show the means of pooled independent experiments. Error bars represent SEM. (E) EMSA combined with supershift assay analysis of NF-κB subunits activation in Tregs isolated from Foxp3Cre (Cre) and Foxp3Cre Relalox (Cre Relalox) mice. The yellow squares point out the supershift of RelA or c-Rel containing complexes. The results are representative of independent experiments. For mouse and experiment numbers, see Supplementary Table 1. The two-tailed unpaired non-parametric Mann–Whitney U-test was used for data not following a normal distribution and the t-test was used for data following a normal distribution *p < 0.05, **p < 0.01, ***p < 0.001.

References

    1. Sakaguchi S, Ono M, Setoguchi R, Yagi H, Hori S, Fehervari Z, et al. . Foxp3+CD25+CD4+ natural regulatory T cells in dominant self-tolerance and autoimmune disease. Immunol Rev. (2006) 212:8–27. 10.1111/j.0105-2896.2006.00427.x - DOI - PubMed
    1. Isomura I, Palmer S, Grumont RJ, Bunting K, Hoyne G, Wilkinson N, et al. . C-Rel is required for the development of Thymic Foxp3+ CD4 regulatory T cells. J Exp Med. (2009) 206:3001–14. 10.1084/jem.20091411 - DOI - PMC - PubMed
    1. Long M, Park S-G, Strickland I, Hayden MS, Ghosh S. Nuclear factor-κB modulates regulatory T cell development by directly regulating expression of Foxp3 transcription factor. Immunity. (2009) 31:921–31. 10.1016/j.immuni.2009.09.022 - DOI - PubMed
    1. Wu Y, Borde M, Heissmeyer V, Feuerer M, Lapan AD, Stroud JC, et al. . FOXP3 controls regulatory T cell function through cooperation with NFAT. Cell. (2006) 126:375–87. 10.1016/j.cell.2006.05.042 - DOI - PubMed
    1. Ono M, Yaguchi H, Ohkura N, Kitabayashi I, Nagamura Y, Nomura T, et al. . Foxp3 controls regulatory T-cell function by interacting with AML1/Runx1. Nature. (2007) 446:685–9. 10.1038/nature05673 - DOI - PubMed

Publication types

LinkOut - more resources