. 2019 Oct 23:10:2494.
doi: 10.3389/fimmu.2019.02494. eCollection 2019.

Maturation of Gut Microbiota and Circulating Regulatory T Cells and Development of IgE Sensitization in Early Life

Affiliations

Maturation of Gut Microbiota and Circulating Regulatory T Cells and Development of IgE Sensitization in Early Life

Terhi Ruohtula et al. Front Immunol. .

Abstract

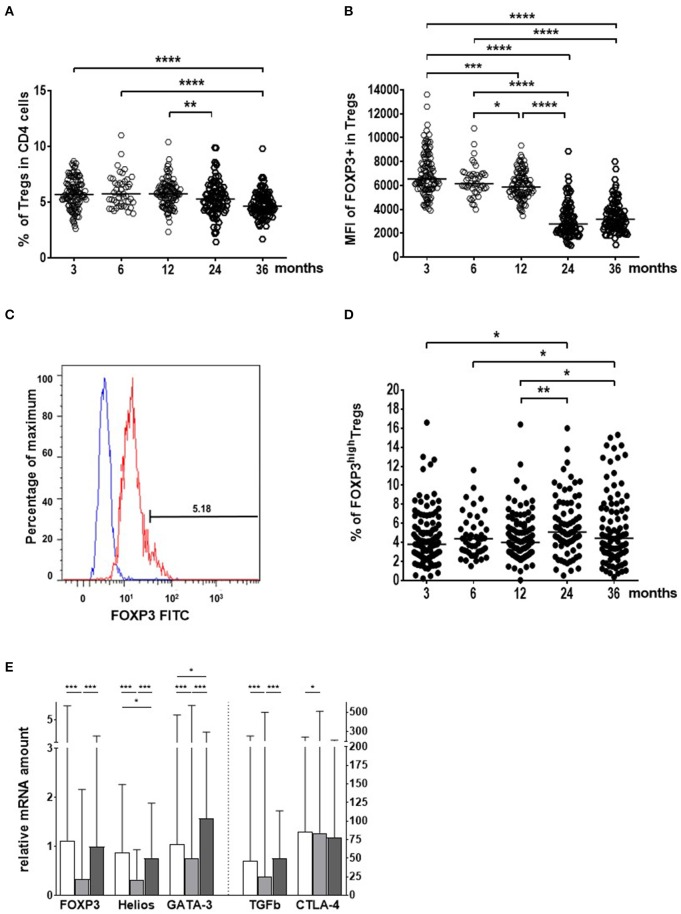
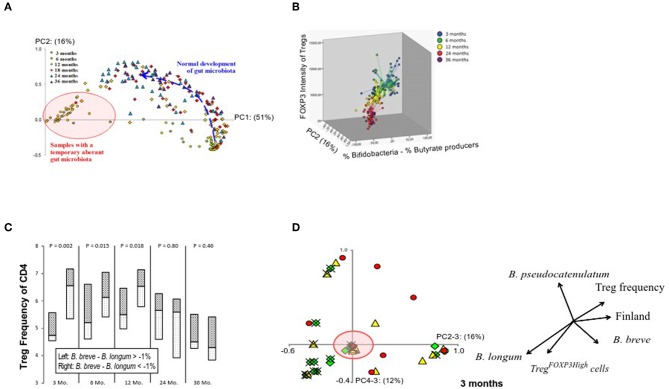
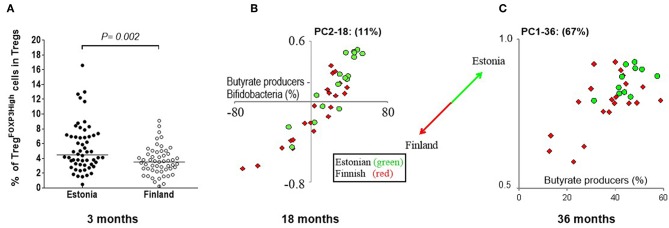
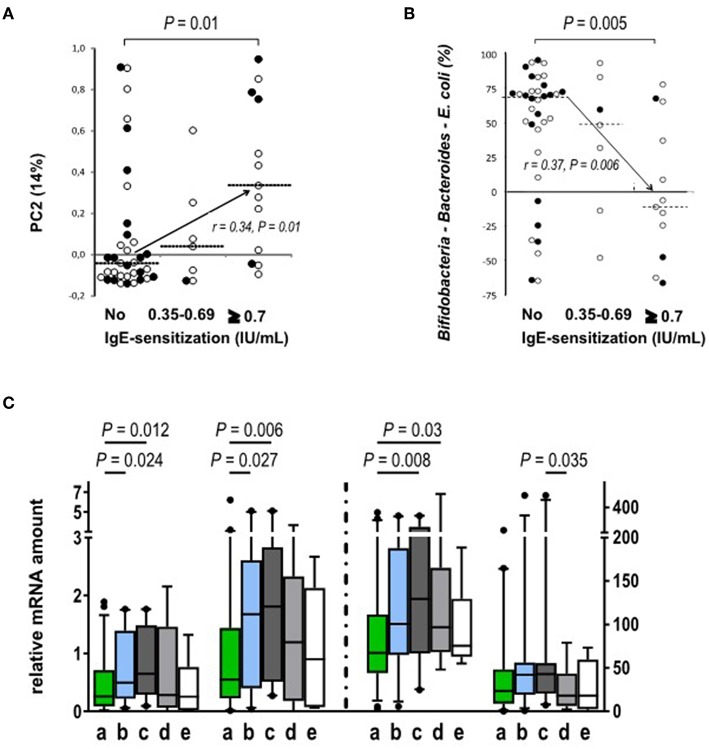
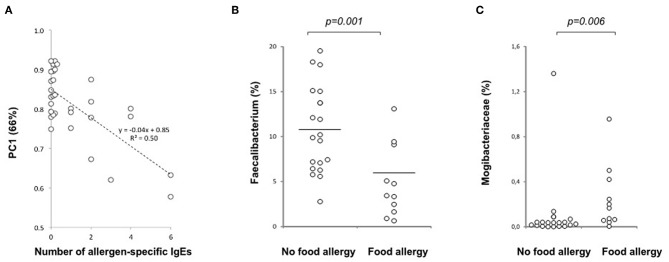
Recent studies suggest that the cross-talk between the gut microbiota and human immune system during the first year of life is an important regulator of the later development of atopic diseases. We explored the changes in the gut microbiota, blood regulatory T cells, and atopic sensitization in a birth-cohort of Estonian and Finnish children followed from 3 to 36 months of age. We describe here an infant Treg phenotype characterized by high Treg frequency, the maturation of Treg population characterized by a decrease in their frequency accompanied with an increase in the highly activated Treg cells. These changes in Treg population associated first with the relative abundance of Bifidobacterium longum followed by increasing colonization with butyrate producing bacteria. High bifidobacterial abundance in the neonatal microbiota appeared to be protective, while colonization with Bacteroides and E. coli was associated with later risk of allergy. Estonian children with lower risk of IgE mediated allergic diseases than Finnish children showed an earlier maturation of the gut microbiota, detected as earlier switch to an increasing abundance of butyrate-producing bacteria, combined with an earlier maturation of Treg cell phenotype and total IgE production. The children with established allergic diseases by age 3 showed a decreased abundance of butyrate producing Faecalibacterium. These results suggest that as well as the maintenance of a bifidobacterial dominated gut microbiota is important during the first weeks of life, the overtake by butyrate producing bacteria seems to be a beneficial shift, which should not be postponed.

Keywords: IgE; atopic diseases; bifidobacteria; gut microbiome; regulatory T-cells.


Figures

Figure 1
Figure 1
Age-related changes in the blood regulatory T cell (Treg) population from the age of 3 to 36 months in Estonian and Finnish children. (A) The frequency (%) of Treg cells in the CD4+ cell population. (B) FOXP3 expression as the median fluorescence intensities (MFI) in Treg cells. (C) The gating for the identification of TregFOXP3High cells. (D) The proportion (%) of TregFOXP3High cells in the Treg population. Sample sizes for figures (A,B,D) are n = 111 at 3 mo; n = 45 at 6 mo; n = 100 at 12 mo; n = 84 at 24 mo; and n = 92 at 36 months of age. Medians are shown as horizontal lines (E). The expression of Treg activation markers (mRNA) in Treg cells in all children studied. The columns are showing the medians with ranges. White columns indicate 6 month, light gray columns 18 month, and dark gray columns 36 month samples. The vertical dotted line indicates the use of two different scales on the y-axis. The age of the children (months), are marked on the x-axes in (A,B,D) and the different activation markers in (E) (n = 33 at 6 mo; n = 96 at 18 mo; and n = 80 at 36 months of age). Wilcoxon test (two-sided) was used for comparisons. P-values in the figure are shown as ****p < 0.0001; ***p < 0.001; **p < 0.01 and *p < 0.05.
Figure 2
Figure 2
Relation between the maturation of the gut microbiota composition and Treg phenotype. (A) Principal component analysis on all samples on the genus level shows the age-related maturation of gut microbiome. Principal component 1 on the x-axis (from 0 to 1) accounts for 51% of the variation in the data while principal component 2 on the y-axis accounts for 16%. Samples at 3 and 6 months are either found in the lower right corner (normal bifidobacteria-dominated microbiota) or in the left (red circle) representing an aberrant microbiota largely devoid of bifidobacteria and instead replaced by a combination of Escherichia coli, Bacteroides, Ruminococcus gnavus, and/or clostridia (pink circle). The normal bifidobacteria-dominated microbiota (lower right corner) usually is the basis for future development (blue arrow) into a more complex adult-like configuration. (B) A graphical representation of FOXP3 expression levels in the whole Treg population in relation to the gut microbiota development. (C) A graphical representation of the influence of the bifidobacteria composition at 3 months of age on Treg numbers at 3, 6, 12, 24, and 36 months. Children with a Bifidobacterium breveBifidobacterium longum abundance lower than −1% at 3 months are depicted on the left of each column and those with scores higher than −1% are depicted on the right, with median as a horizontal line in the boxes. P-values (top) were not based on the binary division of 1% but on the actual B. breveB. longum abundance per sample and their corresponding Treg-value using a Spearman rho's correlation test. The value of −1% was chosen to specifically showcase those children who have B. longum in a non-insignificant amount and have more of it than B. breve. (D) The number of Treg cells with high expression of FOXP3 shows association with PC4, which is described by the relative abundances of B. longum and B. pseudocatenulatum at the age of 3 months and accounts for 12% of the variation. The arrows in the image are a direct representation of the Spearman correlation coefficient of each of the indicated factors with the respective principal components. The green diamonds (♢) represent TregFOXP3High frequencies >4.5%; yellow triangles (▴) 3% < TregFOXP3High >4.5%; and red circles (•) TregFOXP3High frequencies <3%. Estonian children are marked with an (×). The red circle indicates samples, which represent an aberrant microbiota composition, and hardly contain bifidobacteria as also illustrated in (A).
Figure 3
Figure 3
The differences in Treg cells at 3 months and gut microbiome between Estonian and Finnish children at 18 and 36 months of age. (A) The frequencies of TregFOXP3high cells in the Treg population is higher at 3 months in Estonian (n = 56) than Finnish children (n = 55). Median values are shown with a horizontal line. The P-value was calculated with Mann-Whitney U (two-sided). (B) PC2 at 18 months is mostly driven by the amount of butyrate produces minus the amount of bifidobacteria (X-axis), as can be seen by the strong positive correlation. Estonian children score higher on PC2 (18 month samples) than Finnish children, which indicates that Estonians have more butyrate producers at 18 months than the Finnish children, while the Finnish children have more bifidobacteria. At 36 months (C) another pattern is seen, this time described by PC1 (67%). Estonian children on average score higher on PC1 (Y-axis), which in turn is driven mostly by the abundance of butyrate producers in the 36 month samples (X-axis). Estonian children have on average more butyrate producers than then Finnish at 36 months. The circles (•) show Estonian and diamonds (♢) Finnish children in these principal component plots.
Figure 4
Figure 4
Relation between atopic sensitization and the gut microbiota composition and Treg phenotype. (A) PC2, as derived from the genus level at 3 months of age, correlates positively with atopic sensitization during the study period (p = 0.01, rs = 0.34; No sensitization n = 35; sensitization between 0.35 and 0.69 n = 7; sensitization ≥0.7 n = 13). (B) The abundances of Bacteroides and E. coli. are individually significantly associated with the development of atopic sensitization while bifidobacteria are protective. When both Gram negative groups are subtracted from the abundance of bifidobacteria the resulting association inversely mirrors the association of PC2 with atopic sensitization (p = 0.005; rs = 0.37; No sensitization n = 33; Allergen specific IgE level between 0.35 and 0.69 n = 7; Allergen specific IgE level ≥ 0.7 n = 12). Open circles show Finnish (°) and black circles show Estonian (•) infants. (C) The expression (mRNA) of activation markers FOXP3, GATA-3, and CTLA-4 is increased in blood derived Treg cell population at the age of 18 months in the children with IgE sensitization but without clinical allergy. The children were classified into four groups based on their clinical allergy diagnosis and allergen-specific IgE values: (a) No signs of allergy (no clinical diagnosis, no allergen-specific IgE responses, n = 46 for FOXP3 and TGFb-1 and n = 45 for GATA-3 and CTLA-4); (b) IgE-sensitization developed during the study period (no clinical allergy diagnosis, at least one allergen specific IgE response ≥0.35 IU/mL, n = 28); (c) IgE-sensitized at the time of follow-up point (no clinical allergy diagnosis, at least one allergen specific IgE response ≥0.35 IU/mL, n = 20 for all other and n = 21 for TGFb-1); (d) clinical non-IgE allergy (clinical diagnosis of allergy, no allergen specific IgE response 45, n = 16); and (e) clinical IgE allergy (clinical diagnosis of allergy and a specific IgE response to the allergen related to the symptoms, n = 6). The different activation markers are marked on the x-axes. The vertical dotted line indicates the use of two different scales on the y-axis. Medians are marked with a horizontal line. Mann-Whitney U-test (two-sided) was used for comparisons.
Figure 5
Figure 5
Relation of the gut microbiota composition and allergy at 36 months of age. (A) A negative correlation is seen between PC1 and the number of allergen-specific IgEs at 36 months of age (p < 0.001, n = 30), (B) Decreased abundance of the butyrate producer Faecalibacterium prausnitzii in children with food allergy at 36 months of age (p = 0.001; No food allergy n = 19, Food allergy n = 11). (C) Increased abundance of Mogibacteriaceae in children with food allergy at the age of 36 months (p = 0.006, n = 19 and 11, respectively). Medians are marked with a horizontal line.

References

    1. Bjorksten B, Naaber P, Sepp E, Mikelsaar M. The intestinal microflora in allergic Estonian and Swedish 2-year-old children. Clin Exp Allergy. (1999) 29:342–6. 10.1046/j.1365-2222.1999.00560.x - DOI - PubMed
    1. Bjorksten B, Sepp E, Julge K, Voor T, Mikelsaar M. Allergy development and the intestinal microflora during the first year of life. J Allergy Clin Immunol. (2001) 108:516–20. 10.1067/mai.2001.118130 - DOI - PubMed
    1. Kalliomaki M, Kirjavainen P, Eerola E, Kero P, Salminen S, Isolauri E. Distinct patterns of neonatal gut microflora in infants in whom atopy was and was not developing. J Allergy Clin Immunol. (2001) 107:129–34. 10.1067/mai.2001.111237 - DOI - PubMed
    1. Abrahamsson TR, Jakobsson HE, Andersson AF, Bjorksten B, Engstrand L, Jenmalm MC. Low gut microbiota diversity in early infancy precedes asthma at school age. Clin Exp Allergy. (2014) 44:842–50. 10.1111/cea.12253 - DOI - PubMed
    1. Arrieta MC, Stiemsma LT, Dimitriu PA, Thorson L, Russell S, Yurist-Doutsch S, et al. . Early infancy microbial and metabolic alterations affect risk of childhood asthma. Sci Transl Med. (2015) 7:307ra152. 10.1126/scitranslmed.aab2271 - DOI - PubMed

Publication types

Substances