Clinical Trial
. 2019 Oct 31:10:2547.
doi: 10.3389/fimmu.2019.02547. eCollection 2019.

Phenotypic Analysis of Human Lymph Nodes in Subjects With New-Onset Type 1 Diabetes and Healthy Individuals by Flow Cytometry

Affiliations
Clinical Trial

Phenotypic Analysis of Human Lymph Nodes in Subjects With New-Onset Type 1 Diabetes and Healthy Individuals by Flow Cytometry

Jennie H M Yang et al. Front Immunol. .

Abstract

Background: Ultrasound guided sampling of human lymph node (LN) combined with advanced flow cytometry allows phenotypic analysis of multiple immune cell subsets. These may provide insights into immune processes and responses to immunotherapies not apparent from analysis of the blood. Methods: Ultrasound guided inguinal LN samples were obtained by both fine needle aspiration (FNA) and core needle biopsy in 10 adults within 8 weeks of diagnosis of type 1 diabetes (T1D) and 12 age-matched healthy controls at two study centers. Peripheral blood mononuclear cells (PBMC) were obtained on the same occasion. Samples were transported same day to the central laboratory and analyzed by multicolour flow cytometry. Results: LN sampling was well-tolerated and yielded sufficient cells for analysis in 95% of cases. We confirmed the segregation of CD69+ cells into LN and the predominance of CD8+ Temra cells in blood previously reported. In addition, we demonstrated clear enrichment of CD8+ naïve, FOXP3+ Treg, class-switched B cells, CD56bright NK cells and plasmacytoid dendritic cells (DC) in LNs as well as CD4+ T cells of the Th2 phenotype and those expressing Helios and Ki67. Conventional NK cells were virtually absent from LNs as were Th22 and Th1Th17 cells. Paired correlation analysis of blood and LN in the same individuals indicated that for many cell subsets, especially those associated with activation: such as CD25+ and proliferating (Ki67+) T cells, activated follicular helper T cells and class-switched B cells, levels in the LN compartment could not be predicted by analysis of blood. We also observed an increase in Th1-like Treg and less proliferating (Ki67+) CD4+ T cells in LN from T1D compared to control LNs, changes which were not reflected in the blood. Conclusions: LN sampling in humans is well-tolerated. We provide the first detailed "roadmap" comparing immune subsets in LN vs. blood emphasizing a role for differentiated effector T cells in the blood and T cell regulation, B cell activation and memory in the LN. For many subsets, frequencies in blood, did not correlate with LN, suggesting that LN sampling would be valuable for monitoring immuno-therapies where these subsets may be impacted.

Keywords: autoimmunity; biomarker; immune monitoring; lymph node; type 1 diabetes.


Figures

Figure 1
Figure 1
Cells from blood and iLN biopsies display distinct immune profiles. Unbiased Hierarchical clustered heatmap analysis of cell population frequencies (n = 61) in peripheral blood (PB), fine needle aspirates (FNA), and core biopsies (Core) from all control and T1D subjects (n = 12 and n = 10, respectively). The frequency of each population was normalized to the mean frequency from all subjects and tissues and values represent the fold change from mean for each individual sample. Control subjects or those with T1D are indicated with white and black symbols, respectively. Samples from PB, Core and FNA biopsies are depicted by red, light green and dark green symbols, respectively. Individual sample identifiers are shown on the right of the plot indicating cohort group, subject number and biopsy type. Tn, naïve T cells; Tcm, central memory T cells; Tem, effector memory T cells; Temra, Terminally differentiated T cells; Tscm, stem-cell memory-like T cells; rTreg, resting Treg; mTreg, memory Treg; aTreg, activated Treg; Tfh, follicular helper cells; MNC, mononuclear cells; NK, natural killer cells; DC, dendritic cells. Frequencies of cell populations were derived from the cell subset indicated in parentheses.
Figure 2
Figure 2
Immune profiles in blood and iLN biopsies differ but cells from FNA and core biopsies are similar. Principle component analysis (PCA) was performed on leukocyte subpopulation frequencies (n = 61) in peripheral blood (PB) and iLN biopsies. (A) Plot showing the two major principle components of leukocyte subpopulation frequencies from blood, LN fine needle aspirates (FNA) and core biopsies (Core) from all control and T1D subjects (n = 12 and n = 10, respectively). Individual samples identifiers are as explained in Figure 1. Shaded areas represent 95% confidence ellipses of the mean for each tissue. (B) Loading plot indicating how strongly and in which direction each individual variables affect the two major principle components (PC1 and PC2). The top 27 variables contributing to PC1 and PC2 are displayed and their relative influence expressed as a percentage (low% = orange, high% = blue) based on the average contribution of all variables to the PC.
Figure 3
Figure 3
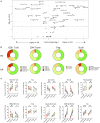
Differences in immune cell subsets between blood and iLN in control and T1D subjects. (A) Volcano plot showing fold difference in the frequency of cell populations on the x-axis and significance of the difference on the y-axis (-Log10 p-values) for blood and combined iLN from pooled control and T1D subjects. P-values were calculated adjusting for multiple comparisons using the Holm-Sidak method. (B) Doughnut plots showing the distribution of naïve and memory CD8+ and CD4+ T cells, Treg and B cells in blood and iLN from pooled control and T1D subjects. Significance is calculated as described for panel A. (C) Paired frequencies of key individual cell populations showing different frequencies in blood and iLN from control and T1D subjects. Student's t-test or Wilcoxon signed-rank test was used. *p < 0.05, **p < 0.01, ***p < 0.001, ****p < 0.0001, ns, not significant; sw, switched.
Figure 4
Figure 4
Differences in chemokine receptor expression on memory CD4+ T cells between blood and iLN. (A–F) Paired frequencies of CD4+ helper T cell populations in blood and iLN from control and T1D subjects. Frequencies of each cell type are expressed as a percentage of total memory CD4+ conventional T cells (i.e., FOXP3 CD4+ T cells). Student's t-test or Wilcoxon signed-rank test was used. *p < 0.05, **p < 0.01, ***p < 0.001, ns, not significant.
Figure 5
Figure 5
T cell subsets in iLN show enhanced expression of markers associated with activation, proliferation and tissue retention compared to blood. (A–I) Paired frequencies of CD4+ helper T cell populations in blood and iLN from control and T1D subjects. Frequencies of each cell type are expressed as a percentage of total T cell subtype. Student's t-test or Wilcoxon signed-rank test was used. *p < 0.05, **p < 0.01, ***p < 0.001, ns, not significant.
Figure 6
Figure 6
Some cell populations show strong correlation between frequency in blood and iLN, others show no correlation. (A) Within individual correlation of cell population frequencies between blood and iLN was calculated using data from all individuals by Spearman's rank correlation. Points are colored based on p-values with those showing significant correlation (p < 0.05) shown in yellow-red symbols and those with no significant correlation shown in shades of green. (B–D) Example correlation for individual cell subsets showing a high (B), medium (C), and no significant correlation (D) between frequencies in the blood and iLN.
Figure 7
Figure 7
Subtle alterations in the balance of T cell subpopulations between T1D and control individuals are evident in iLN but not in blood. Individual frequencies of (A) naïve/memory Treg cell subsets (B), T helper-like Treg subsets (C), conventional helper T cell subsets, and (D) proliferation and activation marker on T cell subsets in blood and iLN from control and T1D subjects. Frequencies of each cell type are expressed as a percentage of total T cell subtype. Error bars represent median and inter quartile ranges for each population. ANOVA or Kruskal-Wallis test was used. *p<0.05. ns, not significant.

References

    1. Atkinson MA, Eisenbarth GS, Michels AW. Type 1 diabetes. Lancet. (2014) 383:69–82. 10.1016/S0140-6736(13)60591-7 - DOI - PMC - PubMed
    1. Roep BO, Tree TI. Immune modulation in humans: implications for type 1 diabetes mellitus. Nat Rev Endocrinol. (2014) 10:229–42. 10.1038/nrendo.2014.2 - DOI - PubMed
    1. Arif S, Leete P, Nguyen V, Marks K, Nor NM, Estorninho M, et al. . Blood and islet phenotypes indicate immunological heterogeneity in type 1 diabetes. Diabetes. (2014) 63:3835–45. 10.2337/db14-0365 - DOI - PMC - PubMed
    1. Baker C, Chang L, Elsegood KA, Bishop AJ, Gannon DH, Narendran P, et al. . Activated T cell subsets in human type 1 diabetes: evidence for expansion of the DR+ CD30+ subpopulation in new-onset disease. Clin Exp Immunol. (2007) 147:472–82. 10.1111/j.1365-2249.2006.03307.x - DOI - PMC - PubMed
    1. Ferreira RC, Simons HZ, Thompson WS, Cutler AJ, Dopico XC, Smyth DJ, et al. . IL-21 production by CD4+ effector T cells and frequency of circulating follicular helper T cells are increased in type 1 diabetes patients. Diabetologia. (2015) 58:781–90. 10.1007/s00125-015-3509-8 - DOI - PMC - PubMed

Publication types