. 2020 Feb;50(2):198-212.
doi: 10.1111/cea.13538. Epub 2019 Dec 9.

Eosinophil cytolysis on Immunoglobulin G is associated with microtubule formation and suppression of rho-associated protein kinase signalling

Affiliations

Eosinophil cytolysis on Immunoglobulin G is associated with microtubule formation and suppression of rho-associated protein kinase signalling

Stephane Esnault et al. Clin Exp Allergy. 2020 Feb.

Abstract

Background: The presence of eosinophils in the airway is associated with asthma severity and risk of exacerbations. Cell-free eosinophil granules are found in tissues in eosinophilic diseases, including asthma. This suggests that eosinophils have lysed and released cellular content, likely harming tissues.

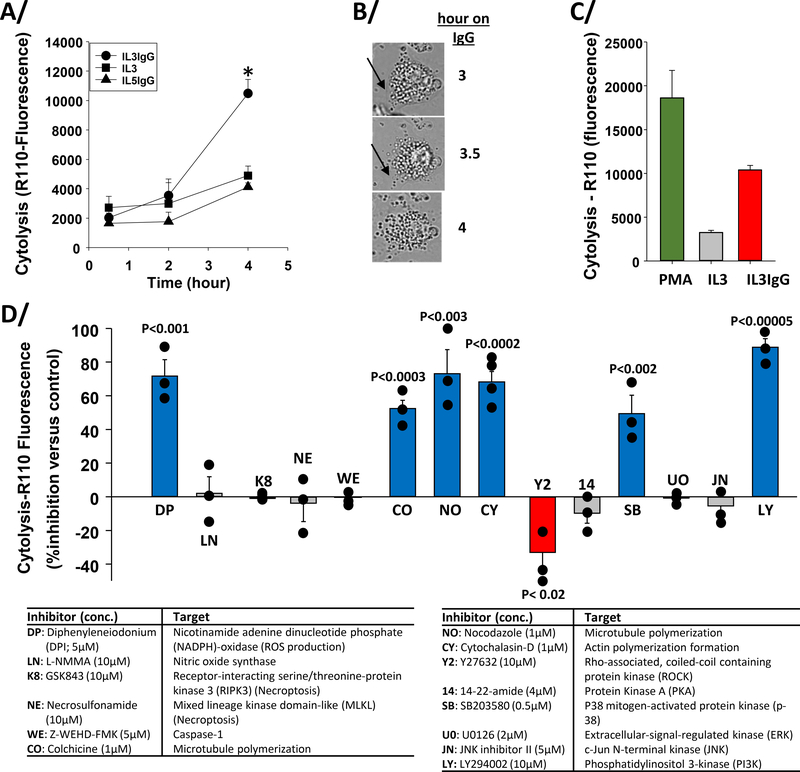
Objective: The present study explores the mechanism of CD32- and αMß2 integrin-dependent eosinophil cytolysis of IL3-primed blood eosinophils seeded on heat-aggregated immunoglobulin G (HA-IgG).

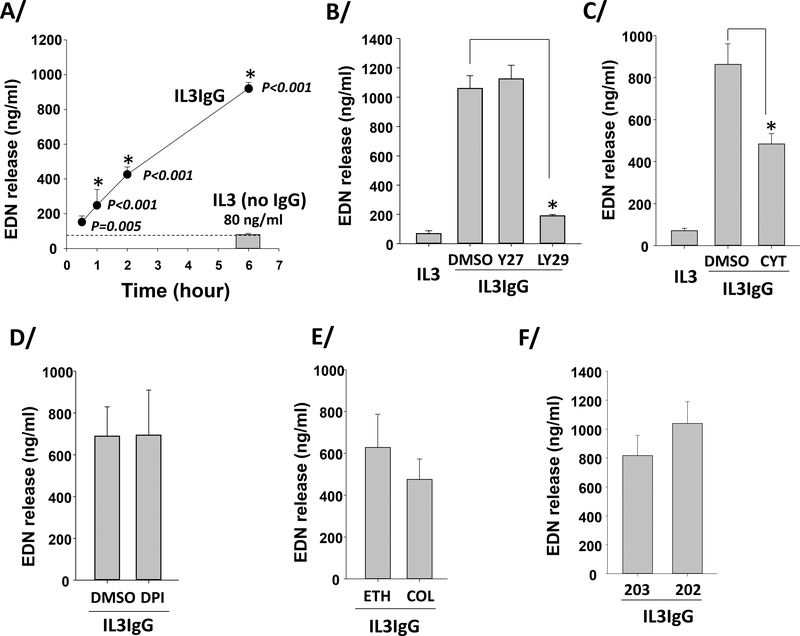
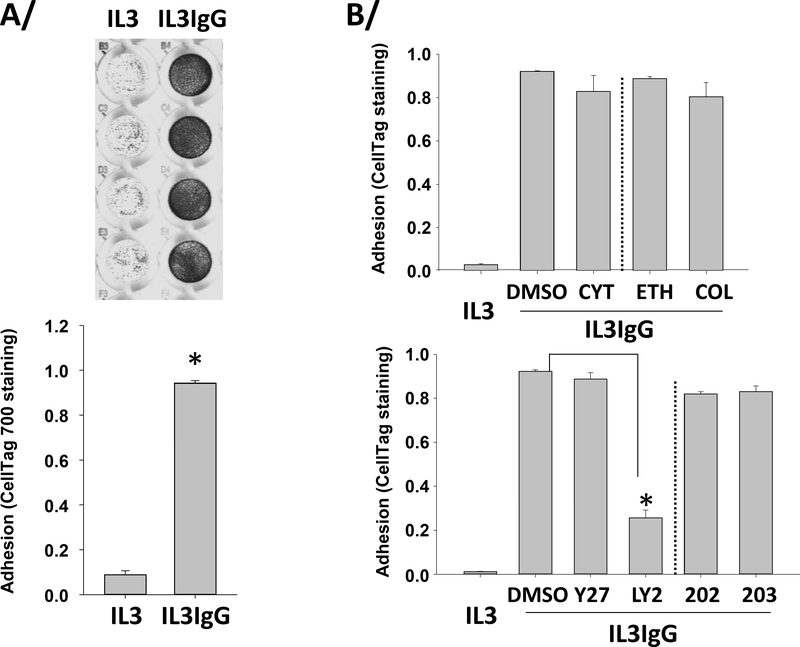
Methods: Cytoskeletal events and signalling pathways potentially involved in cytolysis were assessed using inhibitors. The level of activation of the identified events and pathways involved in cytolysis was measured. In addition, the links between these identified pathways and changes in degranulation (exocytosis) and adhesion were analysed.

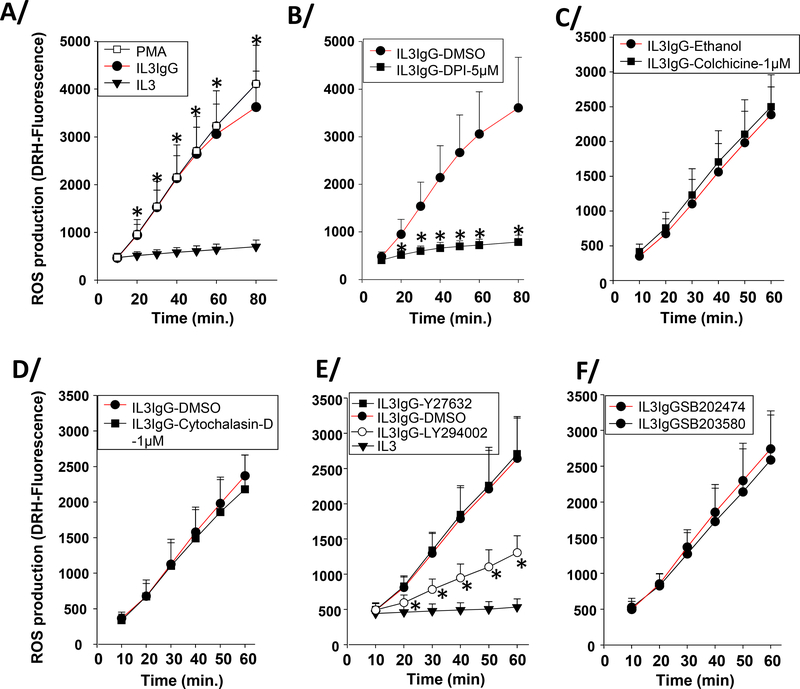
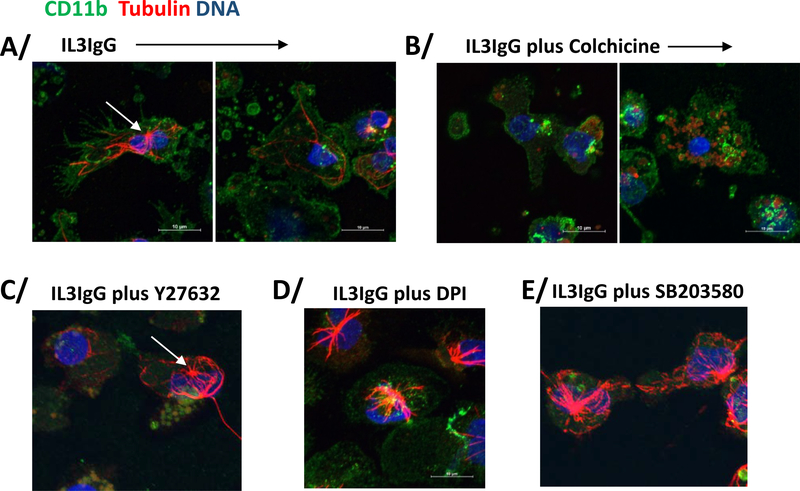
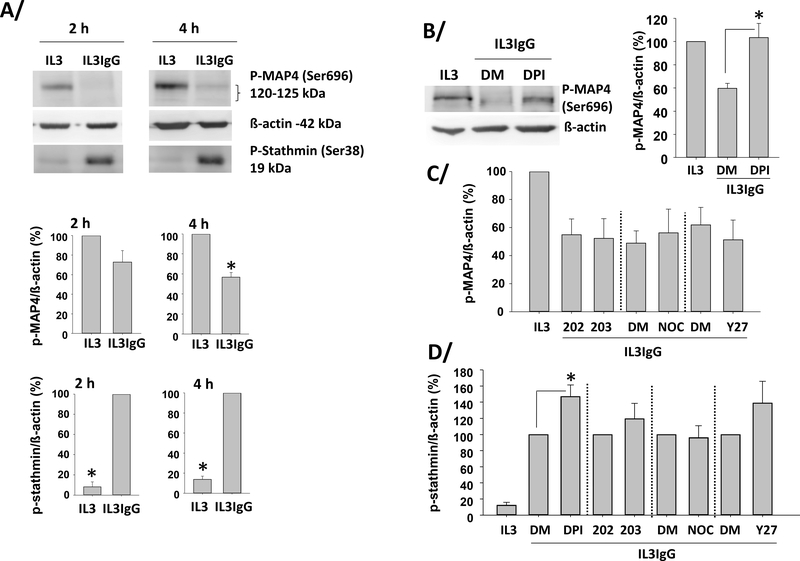
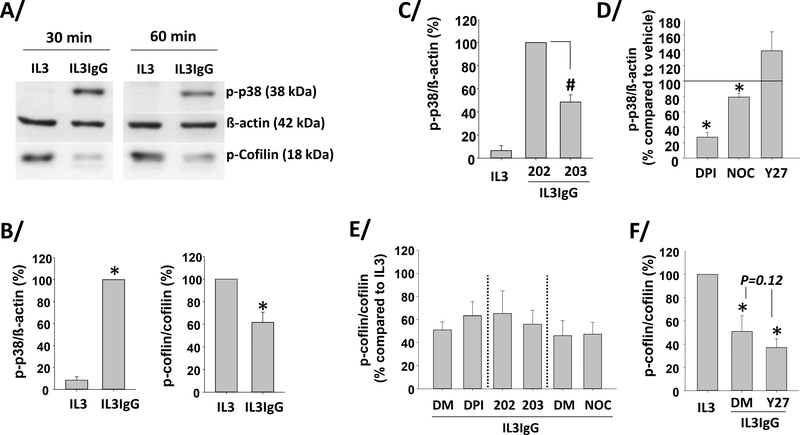
Results: Cytolysis of IL3-primed eosinophils was dependent on the production of reactive oxygen species (ROS) and downstream phosphorylation of p-38 MAPK. In addition, formation of microtubule (MT) arrays was necessary for cytolysis and was accompanied by changes in MT dynamics as measured by phosphorylation status of stathmin and microtubule-associated protein 4 (MAP4), the latter of which was regulated by ROS production. Reduced ROCK signalling preceded cytolysis, which was associated with eosinophil adhesion and reduced migration.

Conclusion and clinical relevance: In this CD32- and αMß2 integrin-dependent adhesion model, lysing eosinophils exhibit reduced migration and ROCK signalling, as well as both MT dynamic changes and p-38 phosphorylation downstream of ROS production. We propose that interfering with these pathways would modulate eosinophil cytolysis and subsequent eosinophil-driven tissue damage.

Keywords: Eosinophil; IL3; adhesion; cytolysis; degranulation; immunoglobulin G; microtubule; priming.


Figures

Figure 1.
Figure 1.. Inhibitor screens indicate that cytolysis of IL3-primed eosinophils on IgG requires ROS production, microtubule and actin polymerization, p38, and PI3K activity, and is favored by reduction of ROCK signaling.
Eosinophils were primed with IL3 and with IL5 (2 ng/ml) for 20 hours and seeded on heat-aggregated IgG (IL3IgG and IL5IgG) or without IgG (IL3) for the indicated times. A/ Bis-AAF-R110 substrate was then added for 30 minutes and fluorescence was measured at 485nmEx/520nmEm. Cytolysis was significantly induced on IgG versus no IgG (IL3) at 4 hours (* t-test, p=0.003, n=4, IL3 versus IL3IgG). B/ Images from time-lapse microscopy of IL3-primed eosinophils on IgG for the indicated times. Black arrow shows apparently intact cytoplasmic membrane at 3 hours and cytoplasmic membrane disruption starting at 3.5 hours. C/ Eosinophil cytolysis at 4 hours under IL3IgG and IL3 conditions were compared to maximum cytolysis using PMA (100 ng/ml) for 4 hours. There was a statistically significant difference among the three conditions (ANOVA, p<0.002, n=6). A/ and C/ means ± standard error of the mean (SEM) are shown. D/ Eosinophils were primed with IL3 (2 ng/ml) for 20 hours and were treated with the indicated inhibitors for 15 minutes before seeding on IgG for 5 h. Bis-AAF-R110 substrate was then added for 30 min and fluorescence was measured. Data are presented as percentage (%) inhibition of cytolysis versus each respective inhibitor vehicle or analog (mean ± SEM). Treatments with unadjusted statistically significant changes compared to their specific control are colored (blue and red) and p values are indicated on the graph (n=3 to 4 subjects per condition). Inhibitor names, final concentrations (conc.) and targets are shown in table below the graph.
Figure 2.
Figure 2.. IL3-primed eosinophils degranulate early and continuously on IgG, independently of ROS production, microtubule polymerization, and ROCK and p38 signaling.
Eosinophils were primed with IL3 (2 ng/ml) for 20 hours and were seeded on IgG (IL3IgG) or without IgG (IL3). EDN released from eosinophils (degranulation) was measured by ELISA. A/ EDN release at the different time-points on IgG (IL3IgG) were compared to EDN release when eosinophils were not on IgG for 6 hours (IL3, no IgG; mean=80 ng/ml, n=6). ANOVA was performed and p values are indicated on the graph for each time-point. *indicates that EDN release is statistically different from the release at 0.5 hour on IgG (n=6 for all time-points, ANOVA). Means ± SEM are shown. B/C/D/E/F/ Eosinophils were primed with IL3 (2 ng/ml) for 20 hours and were treated with the indicated inhibitors, and vehicles or an analog control, (as used in Figure 1D) 15 min before seeded on IgG (IL3IgG). EDN released was measured after 4–5 h on IgG. Y27632 (Y27), LY294002 (LY29), cytochalasin-D (CYT) or diphenyleneiodonium (DPI) was compared to treatment with dimethyl sulfoxide (DMSO). Colchicine (COL) was compared to its vehicle, ethanol (ETH), and SB203850 (203) was compared to its analog control, SB202474 (202). *indicates that treatment is statistically significant from its vehicle (t test, p<0.05, n=3–4).
Figure 3.
Figure 3.. IL3-primed eosinophils adhere to IgG-coated surface in the presence of inhibitors of ROS production, microtubule formation, actin polymerization, or ROCK or p38 signaling.
Eosinophils were primed with IL3 (2 ng/ml) for 20 hours and were seeded on IgG (IL3IgG) or without IgG (IL3) for 2 hours. Then, eosinophils were stained using a non-specific cell stain, CellTag 700 Stain, to quantify the number of adherent cells. Non-adherent cells were washed away and fluorescence from the adherent cells was measured. A/ On the top, representative wells in quadruplicate are shown for both IL3 and IL3IgG conditions. On the bottom, graph shows means ± SEM of quantified fluorescence from four experiments. Adhesion under IL3IgG and IL3 conditions was compared using paired t test (p<0.001, n=4). B/ Eosinophils were primed with IL3 for 20 hours and treated with the indicated inhibitors for 15 minutes before seeding on IgG for 2 hours. Actin polymerization and ROCK inhibitors, cytochalasin-D (CYT) and Y27632 (Y27) did not affect adhesion compared to DMSO. The microtubule polymerization inhibitor, colchicine (COL) did not affect adhesion compared to its vehicle, ethanol (ETH). The p-38 inhibitor, SB203850 did not affect adhesion compared to its analog control, SB202474. Conversely, the PI3K inhibitor, LY294002 blocked adhesion. *indicates that adhesion is statistically different from DMSO (p<0.001, n=3; ANOVA).
Figure 4.
Figure 4.. IL3-primed eosinophils produce ROS on IgG-coated surface in the presence of inhibitors of microtubule formation, actin polymerization, or ROCK or p38 signaling.
Eosinophils were primed with IL3 (2 ng/ml) for 20 hours. In the last hour of priming, eosinophils were incubated with dihydrorhodamine (DRH)-123 (5μM). Then, cells were seeded on IgG (IL3IgG) or without IgG (IL3). Intracellular ROS production was measured by fluorescence (485nmEx/520nmEm) at the indicated time-points. A/ ROS was measured under IL3 and IL3IgG conditions from 10 to 80 minutes. As a positive control for ROS production, IL3-primed eosinophils were treated with PMA (100 ng/ml) for the indicated times. *indicates statistically significant differences (p<0.05) between IL3IgG and IL3 at the indicated time points (paired t test, n=4). B/C/D/E/F Eosinophils were treated with inhibitors or vehicle only or analog control 15 minutes before seeding on IgG. B/ * indicates that diphenyleneiodonium (DPI; 5μM) inhibits ROS production at each time-point compared to vehicle alone (IL3IgG-DMSO) (paired t test, p<0.05, n=3). ROS production was independent of colchicine (C) and cytochalasin-D (D) treatments. E/ * indicates that LY294002 treatment inhibited ROS production at each time-point (paired t test, p<0.05, n=3). ROS production is independent of Y27632 (E) and SB203580 (F) treatments.
Figure 5.
Figure 5.. IL3-primed eosinophils display microtubule arrays on IgG-coated surface in the presence of inhibitors of ROCK, ROS production or p38 signaling.
Eosinophils were primed with IL3 (2 ng/ml) for 20 hours, treated with inhibitors or vehicle alone, and seeded on IgG for 4 hours. Eosinophils were stained for a membrane marker (CD11b; green), α-tubulin (red) and DNA (blue). A/ Microtubule organization center (MTOC) is indicated by a white arrow. In the IL3IgG condition, two images are shown depicting two apparently different stages of eosinophil toward cytolysis. In the left image, the eosinophil appears spreading and still intact, and displays microtubule arrays. On the right, the eosinophil loses its microtubule arrays and its intact membrane. B/ Colchicine treatment blocks microtubule array formation. C/D/E/ Microtubule array formation was not inhibited by Y27632, DPI (ROS production) or SB203580 treatments.
Figure 6.
Figure 6.. IL3-primed eosinophils display stathmin phosphorylation and MAP4 dephosphorylation on IgG.
Eosinophils were primed with IL3 (2 ng/ml) for 20 hours and were seeded on IgG (IL3IgG) or without IgG (IL3) for the indicated times. A/ representative blots are shown and graphs represent the mean ± SEM of the indicated ratios after 2 and 4 hours on IgG, with IL3 for phospho-MAP4/ß-actin and IL3IgG for phospho-stathmin/ß-actin fixed at 100. *indicates statistical differences p<0.002 to p<0.00003 between IL3 and IL3IgG for n=3 to 4 different eosinophil donors (paired t test). B/C/D after IL3 priming, eosinophils were treated with the indicated inhibitors (DPI, SB203580 (203), nocodazole (NOC), and Y27632 (Y27)) or their respective vehicle (DMSO; DM) or analog control (SB202474; 202) for 10 minutes before seeding on IgG for 3.75 hours. B/ a representative blot is shown for inhibition of ROS production (DPI) and graph represents the mean ± SEM using eosinophils from 3 different subjects with IL3 fixed at 100. *indicates that DPI treatment increases MAP4 phosphorylation compared to DMSO (p<0.03, paired t test). C/ No other inhibitor changed MAP4 phosphorylation status (n=3). D/ *DPI increased stathmin phosphorylation compared to DMSO (p<0.05, paired t test, n=3).
Figure 7.
Figure 7.. IL3-primed eosinophils display ROS-dependent increased p-38 phosphorylation, and dephosphorylation of cofilin on IgG.
Eosinophils were primed with IL3 (2 ng/ml) for 20 hours and were seeded (IL3IgG) or not (IL3) on IgG for the indicated times. Phosphorylation of p-38 (p-p38) and cofilin (p-cofilin) were analyzed by western-blot. A/ representative blots. B/ graphs represent the mean ± SEM of the indicated ratios after 60 minutes on IgG, with IL3IgG for p-p38/ß-actin and IL3 for p-cofilin/cofilin fixed at 100. *indicates statistical differences between IL3 and IL3IgG (p-p38/ß-actin, p<0.00005, n=4; and p-cofilin/cofilin, p<0.007, n=5, paired t test). C/D/E/F/ the indicated inhibitors or their specific vehicle only or analog control was added after IL3 priming and 10 minutes before cells were seeded on IgG for 60 minutes. C/ #SB203580 (203) inhibited IgG-induced p-p38 compared to its analog control, SB202474 fixed at 100 (ANOVA, p<0.001, n=3). D/ DPI, nocodazole (NOC), and Y27632 effects on p-p38 were compared to their respective vehicles used as control and fixed at 100. *indicates statistical significant change compared to control (paired t test, p<0.05, n=3). E/ DPI, SB203580 (203) and nocodazole (NOC) did not affect cofilin phosphorylation compare to DMSO (DM) or the analog, SB202474 (202) fixed at 100 (paired t test, n=3). F/ *indicates cofilin dephosphorylation compared to IL3, which is fixed at 100 (no IgG) (ANOVA, p<0.02 for DMSO only (DM) and p<0.007 for Y27632 (Y27), n=3).

References

    1. Busse W, Chupp G, Nagase H, Albers FC, Doyle S, Shen Q, Bratton DJ, Gunsoy NB, Anti-IL-5 treatments in patients with severe asthma by blood eosinophil thresholds: Indirect treatment comparison. J Allergy Clin Immunol 2019;143: 190–200 e20. - PubMed
    1. Evans MD, Esnault S, Denlinger LC, Jarjour NN, Sputum cell IL-1 receptor expression level is a marker of airway neutrophilia and airflow obstruction in asthmatic patients. J Allergy Clin Immunol 2018;142: 415–23. - PMC - PubMed
    1. Wilson TM, Maric I, Shukla J, Brown M, Santos C, Simakova O, Khoury P, Fay MP, Kozhich A, Kolbeck R, Metcalfe DD, Klion AD, IL-5 receptor alpha levels in patients with marked eosinophilia or mastocytosis. J Allergy Clin Immunol 2011;128: 1086–92 e1–3. - PMC - PubMed
    1. Yasruel Z, Humbert M, Kotsimbos TC, Ploysongsang Y, Minshall E, Durham SR, Pfister R, Menz G, Tavernier J, Kay AB, Hamid Q, Membrane-bound and soluble alpha IL-5 receptor mRNA in the bronchial mucosa of atopic and nonatopic asthmatics. Am J Respir Crit Care Med 1997;155: 1413–18. - PubMed
    1. Miyajima A, Mui AL, Ogorochi T, Sakamaki K, Receptors for granulocyte macrophage colony stimulating factor, interleukin-3, and interleukin-5. Blood 1993;82: 1960–74. - PubMed

Publication types

MeSH terms