. 2019 Nov 21;4(24):e132975.
doi: 10.1172/jci.insight.132975.

Mitochondrial arginase-2 is a cell‑autonomous regulator of CD8+ T cell function and antitumor efficacy

Affiliations

Mitochondrial arginase-2 is a cell‑autonomous regulator of CD8+ T cell function and antitumor efficacy

Adrià-Arnau Martí i Líndez et al. JCI Insight. .

Abstract

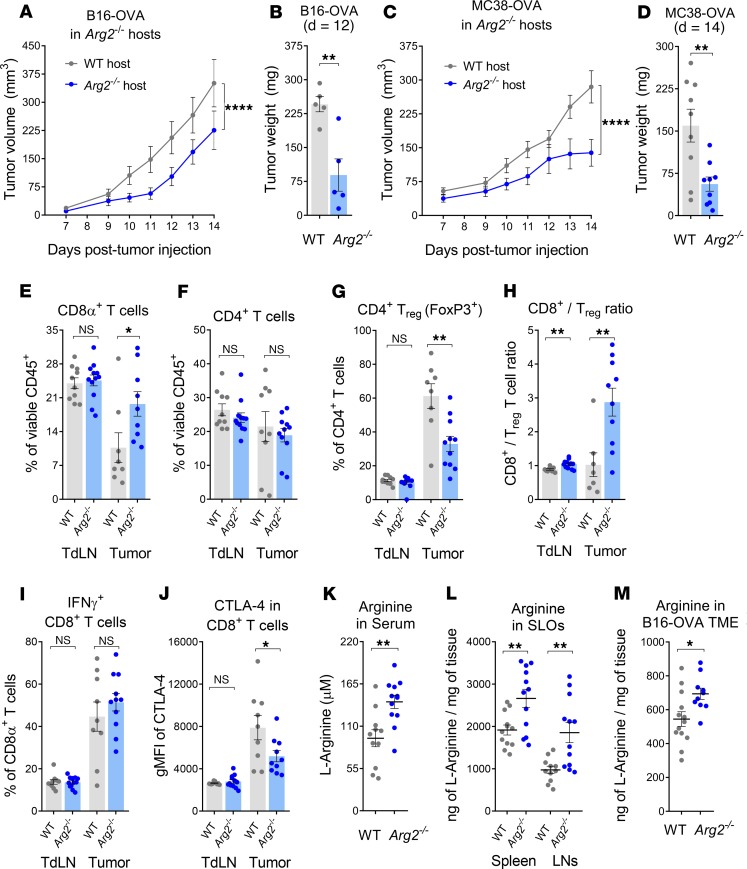
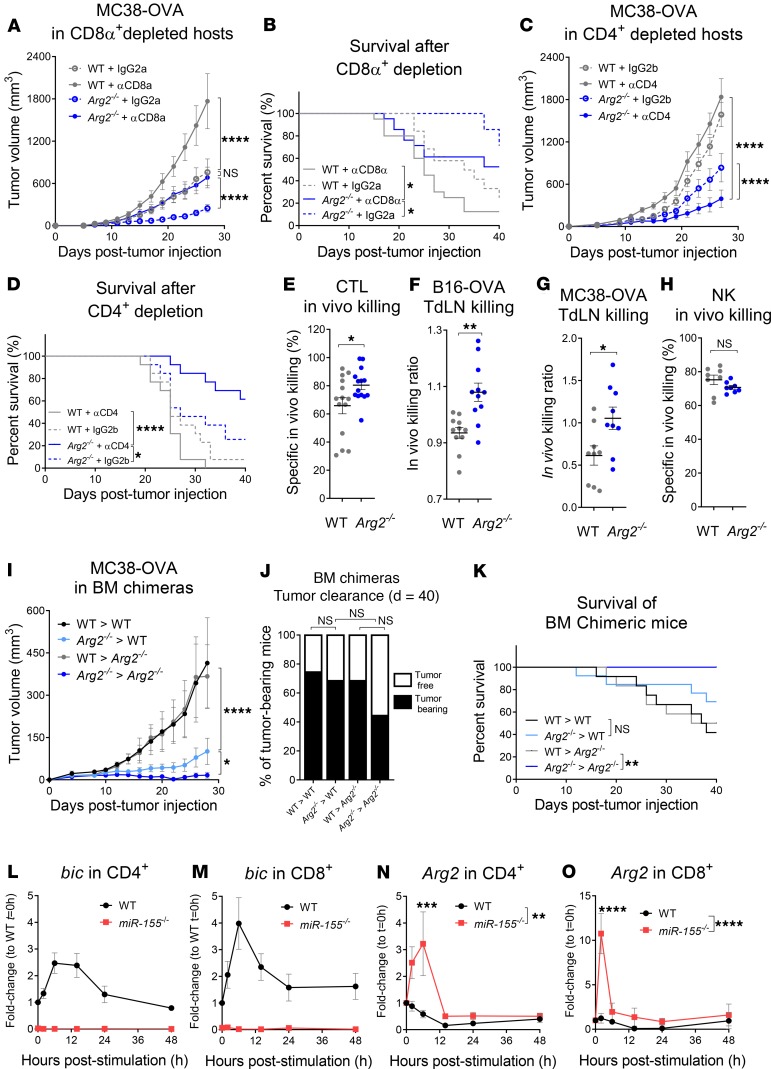
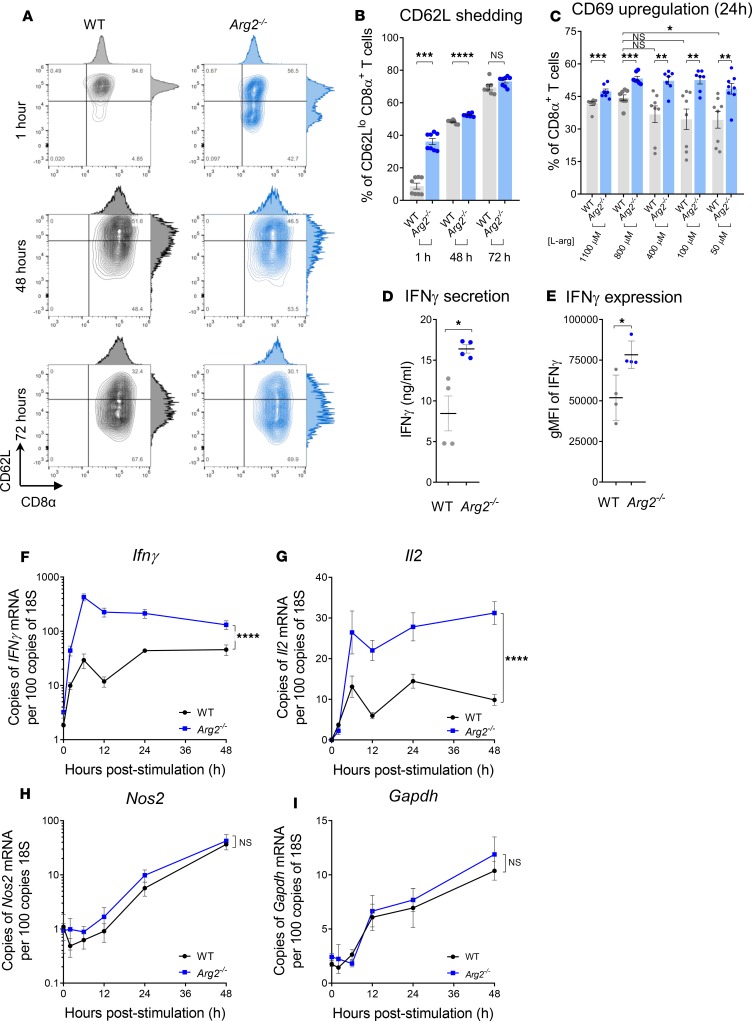
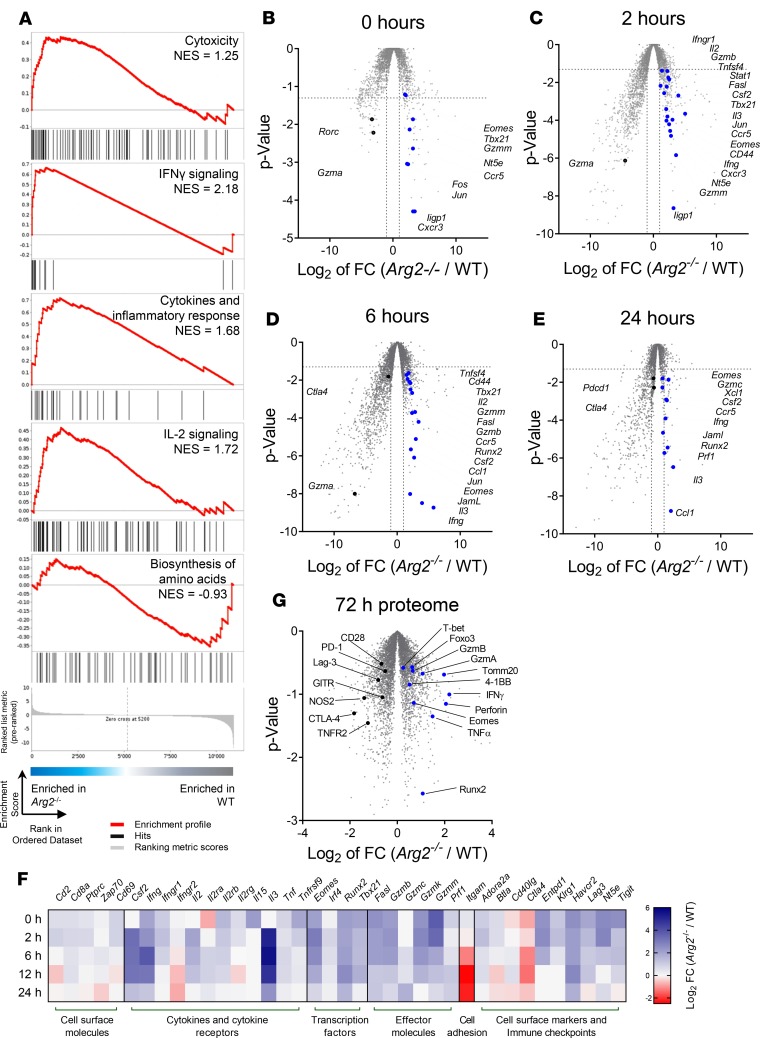
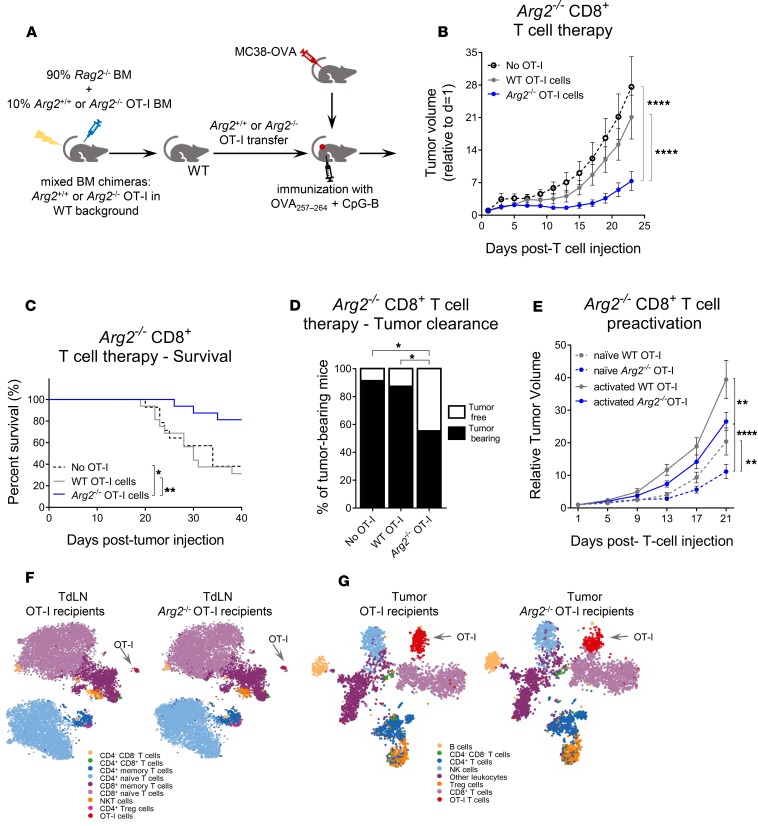
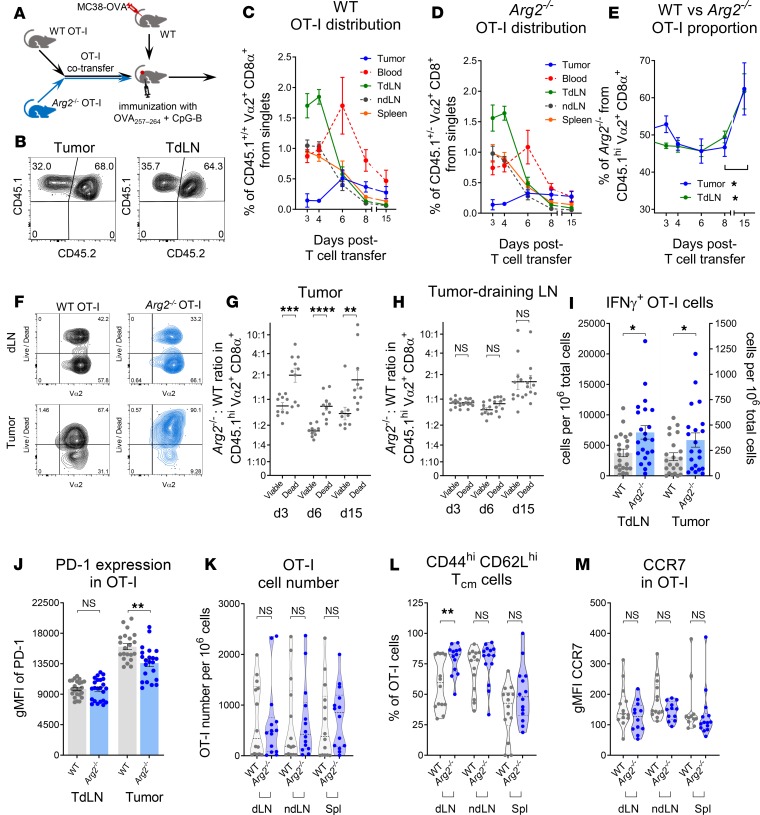
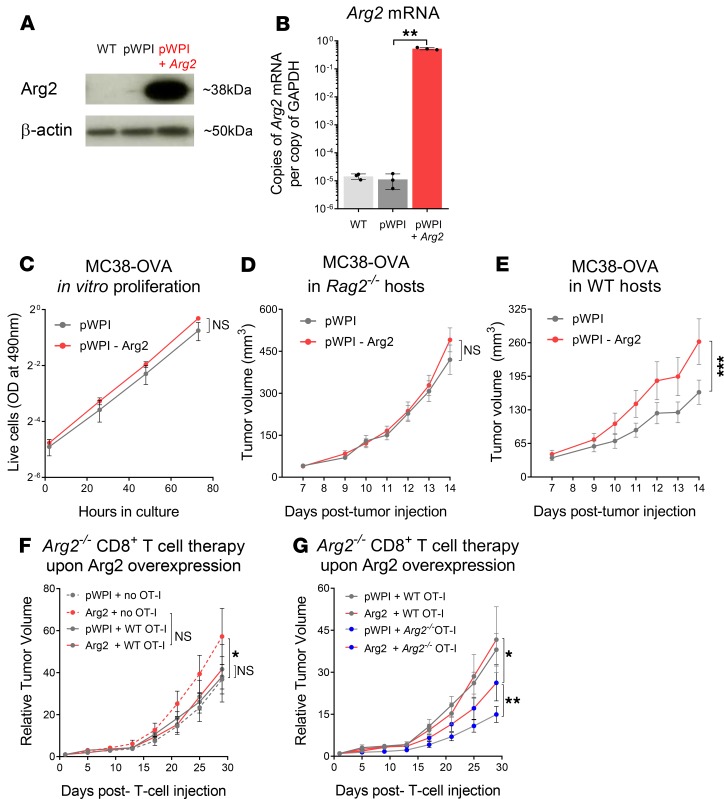
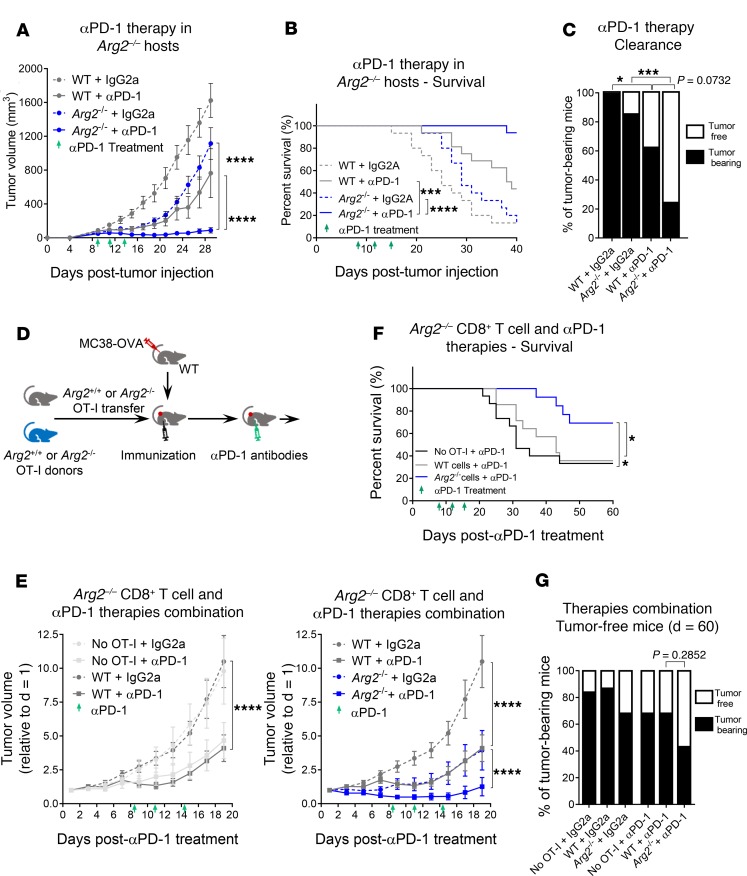
As sufficient extracellular arginine is crucial for T cell function, depletion of extracellular arginine by elevated arginase 1 (Arg1) activity has emerged as a hallmark immunosuppressive mechanism. However, the potential cell-autonomous roles of arginases in T cells have remained unexplored. Here, we show that the arginase isoform expressed by T cells, the mitochondrial Arg2, is a cell-intrinsic regulator of CD8+ T cell activity. Both germline Arg2 deletion and adoptive transfer of Arg2-/- CD8+ T cells significantly reduced tumor growth in preclinical cancer models by enhancing CD8+ T cell activation, effector function, and persistence. Transcriptomic, proteomic, and high-dimensional flow cytometry characterization revealed a CD8+ T cell-intrinsic role of Arg2 in modulating T cell activation, antitumor cytoxicity, and memory formation, independently of extracellular arginine availability. Furthermore, specific deletion of Arg2 in CD8+ T cells strongly synergized with PD-1 blockade for the control of tumor growth and animal survival. These observations, coupled with the finding that pharmacologic arginase inhibition accelerates activation of ex vivo human T cells, unveil Arg2 as a potentially new therapeutic target for T cell-based cancer immunotherapies.

Keywords: Amino acid metabolism; Cancer immunotherapy; Immunology; Mitochondria; Oncology.


Conflict of interest statement

Conflict of interest: The technology transfer office (UNITEC) of the University of Geneva applied for a patent related to the inhibition of ARG2 in immune cells in the context of cancer therapy (WO/2019/145453). AAML, IDS, TDS, and WR are inventors on this patent application.

Figures

Figure 1
Figure 1. Deletion of Arg2 reduces tumor growth and increases arginine availability.
(A–D) Analysis of tumor growth (A) for B16-OVA (n = 10) and (C) for MC38-OVA (n = 13) and tumor weight at (B) day 12 or (D) day 14 tumors in WT or Arg2–/– hosts. (E–I) T cell frequencies in tumor-draining lymph nodes (TdLN) and tumors in 9-day MC38-OVA tumor-bearing WT and Arg2–/– mice: (E) CD8+ T cells; (F) CD4+ T cells; (G) FoxP3+ Tregs; (H) CD8+/FoxP3+ T cell ratio; (I) IFN-γ+CD8+ T cells. (J) Analysis of CTLA-4 expression by CD8+ T cells. (K–M) HPLC-MS quantification of arginine in (K) serum, (L) secondary lymphoid organs (SLO), and (M) B16-OVA tumors 12 days after tumor implantation in WT or Arg2–/– mice. Results were pooled from 2 or 3 independent experiments (A, C, E–M) or are representative of 3 independent experiments (B and D). Data is represented as mean ± SEM throughout. *P < 0.05, **P < 0.01, and ****P < 0.0001 (A and C: 2-way ANOVA) (B, D–M: 2-tailed Student’s t test).
Figure 2
Figure 2. Arg2–/– mice control tumor growth more efficiently via enhanced cytotoxic CD8+ T cell function.
(A) Tumor growth and (B) mouse survival in MC38-OVA tumor-bearing WT or Arg2–/– mice treated with CD8+ T cell–depleting (αCD8α) or isotype control (IgG2a) antibodies (n = 18–21). (C) Tumor growth and (D) mouse survival were analyzed in MC38-OVA tumor-bearing WT or Arg2–/– mice treated with CD4+ T cell depleting (αCD4) or isotype control (IgG2b) antibodies (n = 11–12). (A–D) Mice received 4 mg/kg doses of depleting or control antibody at days –3, –1, 1, 4, 8, 11, 15, and 18 relative to tumor injection. (E) WT and Arg2–/– mice that had been immunized 6 days earlier with OVA257–264 and CpG-B were implanted with CTVlo control or CTVhi OVA257–264–loaded syngeneic splenocytes, and target cell clearance was evaluated in the spleens after 24 hours. (F and G) CTVlo control or CTVhi OVA257–264–loaded syngeneic splenocytes were transferred into 11-day (F) B16-OVA or (G) MC38-OVA tumor-bearing WT or Arg2–/– mice, and target cell clearance was evaluated after 24 hours in the tumor-draining lymph nodes (TdLNs) and contralateral nondraining lymph nodes (ndLNs). Target cell clearance in the TdLNs is expressed as killing ratio relative to the control cells and was normalized relative to the killing ratio in the ndLNs. (H) Naive WT or Arg2–/– mice received CTVlo control or CTVhi β2m–/– syngeneic splenocytes, and target cell clearance was evaluated in spleen after 24 hours. Target cell clearance is expressed as killing ratio relative to the control cells. (I) Tumor growth, (J) tumor clearance rates at day 40, and (K) mouse survival were assessed in the indicated 4 groups of BM chimeric mice (n = 11–12). (L–O) miR155 (bic RNA) or Arg2 mRNA were quantified by real-time PCR over a 48-hour time course in ex vivo WT or miR155–/– CD4+ (L and N) or CD8+ (M and O) T cells activated with αCD3ε and αCD28 antibodies (n = 6). (A–O) Results were pooled from 2 or 3 independent experiments. Data is represented as mean ± SEM throughout. *P < 0.05, **P < 0.01, ***P < 0.001, and ****P < 0.0001 (A, C, I, L–O: 2-way ANOVA) (E–G: 2-tailed Student’s t test) (B, D, K: log-rank Mantel-Cox test) (J: Fisher’s exact test).
Figure 3
Figure 3. Arg2–/– CD8+ T cells exhibit enhanced activation dynamics and cytokine production.
In all panels, CD8+ T cells isolated from naive WT or Arg2–/– OT-I mice were activated in vitro with αCD3ε and αCD28 antibodies. (A) The representative contour dot plots show FACS analyses of CD62L expression after 1 hour, 2 days, and 3 days of activation. (B) The bar graphs show the percentage of CD62Llo cells at indicated time points. (C) The bar graphs show the percentage of CD69hi cells after 24 hours of activation in medium containing the indicated concentrations of L-arginine. (D) IFN-γ was quantified by ELISA in cell supernatants after 24 hours of stimulation. (E) Expression of IFN-γ was assessed after 24 hours of activation by intracellular FACS staining. (F–I) Time-course qPCR experiments were performed to quantify the induction of (F) Ifng, (G) Il2, (H) Nos2, and (I) Gapdh mRNAs (n = 4). Results were (B and C) pooled from 2 independent experiments or (D and I) are representative of 3 independent experiments. Data is represented as mean ± SEM throughout. *P < 0.05, **P < 0.01, ***P < 0.001, and ****P < 0.0001 (B–E: 2-tailed Student’s t test) (F–I: 2-way ANOVA).
Figure 4
Figure 4. Activated Arg2–/– CD8+ T cells exhibit faster and stronger upregulation of key genes implicated in CD8+ T cell function.
WT or Arg2–/– OT-I CD8+ T cells were activated in vitro with αCD3ε and αCD28 antibodies, and their transcriptomes were characterized by RNA-seq after 0, 2, 6, 12, and 24 hours of activation. (A) The graphs show the results of a GSEA performed for the indicated gene sets in cells activated for 6 hours. The normalized enrichment score (NES) is indicated. (B–E) The volcano plots represent the comparisons between the transcriptomes of WT and Arg2–/– CD8+ T cells at the indicated time points: fold-change (FC) in mRNA expression in Arg2–/– relative to WT cells is plotted as a function of the P value (Wald test, GLM in edgeR). Dots corresponding to mRNAs for key functionally relevant genes are indicated. (F) The heatmap represents the FC in mRNA expression in Arg2–/– relative to WT cells, in all time points analyzed, for selected genes grouped according to the indicated functionally relevant categories. (G) WT or Arg2–/– OT-I CD8+ T cells were activated in vitro with αCD3ε and αCD28 antibodies, and the proteome was analyzed after 72 hours by LC-MS. The volcano plot represents comparisons between the proteomes of WT and Arg2–/– CD8+ T cells: FC in protein expression in Arg2–/– relative to WT cells is plotted as a function of the P value (2- tailed Welch t test). Dots corresponding to key functionally relevant proteins are indicated. P values have been adjusted using the Benjamini-Hochberg procedure.
Figure 5
Figure 5. Endogenous Arg2 in CD8+ T cells is a cell-intrinsic regulator of their antitumor function.
(A) The scheme illustrates the experimental setting used in panels B–D, F, and G. Five days prior to adoptive T cell transfer, 0.5 × 10⁶ MC38-OVA cells were implanted s.c. into WT host. At day 0, 1 × 10⁶ to 1.5 × 10⁶ CD8+ T cells isolated from naive WT or Arg2–/– mixed BM chimeric mice were adoptively transferred into the tumor-bearing mice. Control mice received no T cells. One day after T cell transfer, mice were immunized s.c. with OVA257–264 and CpG-B. (B) Tumor growth, (C) mouse survival, and (D) tumor clearance rates at day 40 were assessed (n = 12–15). (E) Tumor growth was assessed using a setting identical to that in A, except that tumor-bearing mice received naive or 6-day preactivated CD8+ T cells derived from WT or Arg2–/– OT-I mice (n = 11–12). Only mice transferred with naive cells were primed in vivo by s.c. immunization with CpG-B and OVA257–264. (F and G) t-SNE plots showing the FlowSOM-guided metaclustering gated on (F) TCRb+ T cells present in the TdLNs or gated on (G) CD45+ cells infiltrating the tumors of WT tumor-bearing mice having received WT (left) or Arg2–/– (right) OT-I cells. (B–E) Results were pooled from 2 or 3 independent experiments. Data is represented as mean ± SEM throughout. *P < 0.05, **P < 0.01, and ****P < 0.0001 (B and E: 2-way ANOVA) (C: log-rank Mantel-Cox test) (D: Fisher’s exact test).
Figure 6
Figure 6. Arg2 deletion enhances the persistence of antitumor CD8+ T cell responses and increases differentiation into Tcm cells.
(A) The scheme illustrates the experimental setting used in panels B–H. The approach was similar to that in Figure 5A, except that tumor-bearing mice were adoptively transferred with a 1:1 mix of naive WT and Arg2–/– cells (1 × 10⁶ to 1.3 × 10⁶ total cells). (B) The representative contour plots illustrate the approach used in C and D to use CD45.1 staining to discriminate between WT CD45.1+/+ and Arg2–/– CD45.1+/– CD8+ OT-I cells. (C and D) The graphs summarize the spatiotemporal distribution of adoptively transferred WT (C) or Arg2–/– (D) CD8+ OT-I cells during the course of the antitumor response (n = 10). (E) The graphs show the percentage of Arg2–/– cells within the total transferred OT-I cell populations found at the indicated time points in the TdLNs and tumors (n = 10). (F) The representative contour plots illustrate how viable and dead fractions were quantified 15 days after transfer within the cotransferred WT and Arg2–/– CD8+ OT-I cell populations in the TdLNs (top) and tumor infiltrates (bottom). (G and H) The graphs summarize the Arg2–/– versus WT CD8+ OT-I cell ratios found at different time points within the viable and dead cell fractions in tumors (G) or in TdLNs (H). (I and J) In the setting illustrated in Figure 5A, flow cytometry was used 8 days after transfer to quantify the frequencies of IFN-γ+ cells in WT and Arg2–/– OT-I cell populations (I) or the expression of PD-1 by WT and Arg2–/– OT-I cells (J) in TdLNs and tumor infiltrates. (K–M) WT CD45.1+/+ or Arg2–/– CD45.1+/– CD8+ OT-I cells were adoptively transferred into naive WT hosts, which were immunized with CpG-B and OVA257–264 24 hours later. Cell frequency (K), central/effector memory differentiation (L), and CCR7 (M) were analyzed by flow cytometry in OT-I cells found in spleen (Spl), draining (dLN), and nondraining lymph nodes (ndLN) 28 days after immunization. Violin plots (K, L, M) show the median and quartiles. (C–E and G–M) Results were pooled from 2 or 3 independent experiments. *P < 0.05, **P < 0.01, and ***P < 0.001 (G–M: 2-tailed Student’s t test) (E: 2-tailed Welch’s t tests)
Figure 7
Figure 7. Arg2–/– CD8+ T cells are partially protected against an immunosuppressive TME induced by overexpression of arginase 2 in tumor cells.
Quantification by (A) Western blot of Arg2 protein and (B) qPCR of Arg2 mRNA abundance in control (parental or pWPI-vector transduced) and Arg2-overexpressing MC38-OVA cells. (C) An MTS-based assay was used to compare the in vitro proliferation of control (pWPI-transduced) and Arg2-overexpressing tumor cells (n = 3). (D and E) Growth of control (pWPI-transduced) and Arg2-overexpressing tumors was compared in (D) Rag2–/– (n = 10–11) or (E) WT hosts (n = 15–16). (F and G) WT mice were implanted with control (pWPI-transduced) or Arg2-ovexpressing tumors; when tumors were palpable (after 5 days), WT or Arg2–/– OT-I cells were adoptively transferred, and mice were immunized the next day with CpG-B and OVA257–264 (n = 14). Tumor-bearing mice receiving no OT-I cells were used as controls. To improve visualization, tumor growth curves are shown separately for (F) groups having received no cells or WT OT-I cells and (G) groups having received WT or Arg2–/– OT-I cells. (B) Results are representative of 2 independent experiments or (C–G) were pooled from 2 or 3 independent experiments. (C) Statistical analysis was performed using 2-way ANOVA. Data is represented as (B) mean ± SD or (D–G) as mean ± SEM. *P < 0.05, **P < 0.01, and ***P < 0.001 (B: 2-tailed Student’s t test) (C–G: 2-way ANOVA).
Figure 8
Figure 8. Tumor growth is inhibited synergistically by PD-1 blockade and either germline or CD8+ T cell–intrinsic deletion of Arg2.
(A–C) MC38-OVA cells were implanted s.c. into WT or Arg2–/– hosts, which were then treated with 200 μg i.p. injections of isotype control (IgG2a) or anti–PD-1 antibodies after 8, 11, and 14 days (green arrows). The results show (A) tumor growth, (B) mouse survival, and (C) tumor clearance rates at day 40 after tumor injection (n = 14–16). (D) The scheme illustrates the experimental setting used in panels E and F. WT mice were implanted with MC38-OVA cells; when tumors were palpable (after 5 days), WT or Arg2–/– OT-I cells were adoptively transferred, and mice were immunized the following day with OVA257–264 and CpG-B. Finally, the mice were treated with 200 μg i.p. injections of isotype control (IgG2a) or anti–PD-1 antibodies at days 8, 11, and 14 after T cell transfer (green arrows). Mice receiving no OT-I cells were used as controls. The results show (E) tumor growth, (F) mouse survival, and (G) tumor clearance rates at day 60 after tumor injection (n = 14–16). Isotype control data not shown in F, and in E, data were split into 2 graphs for clarity. (AF) Results were pooled from 2 independent experiments. (A and E) Statistical analysis was performed using 2-way ANOVA. (A and E) Data is represented as mean ± SEM. *P < 0.05, ***P < 0.001, and ****P < 0.0001 (A and E: 2-way ANOVA) (B and F: log-rank Mantel-Cox test) (C and G: Fisher’s exact test).

References

    1. Rodriguez PC, Zea AH, Culotta KS, Zabaleta J, Ochoa JB, Ochoa AC. Regulation of T cell receptor CD3zeta chain expression by L-arginine. J Biol Chem. 2002;277(24):21123–21129. doi: 10.1074/jbc.M110675200. - DOI - PubMed
    1. Park KG, Hayes PD, Garlick PJ, Sewell H, Eremin O. Stimulation of lymphocyte natural cytotoxicity by L-arginine. Lancet. 1991;337(8742):645–646. doi: 10.1016/0140-6736(91)92456-C. - DOI - PubMed
    1. Barbul A, Sisto DA, Wasserkrug HL, Efron G. Arginine stimulates lymphocyte immune response in healthy human beings. Surgery. 1981;90(2):244–251. - PubMed
    1. Barbul A, et al. Intravenous hyperalimentation with high arginine levels improves wound healing and immune function. J Surg Res. 1985;38(4):328–334. doi: 10.1016/0022-4804(85)90045-9. - DOI - PubMed
    1. Barbul A, Wasserkrug HL, Yoshimura N, Tao R, Efron G. High arginine levels in intravenous hyperalimentation abrogate post-traumatic immune suppression. J Surg Res. 1984;36(6):620–624. doi: 10.1016/0022-4804(84)90149-5. - DOI - PubMed

Publication types

MeSH terms