. 2019 Nov 21;13(11):e0007814.
doi: 10.1371/journal.pntd.0007814. eCollection 2019 Nov.

Vaccination strategies to control Ebola epidemics in the context of variable household inaccessibility levels

Affiliations

Vaccination strategies to control Ebola epidemics in the context of variable household inaccessibility levels

Gerardo Chowell et al. PLoS Negl Trop Dis. .

Abstract

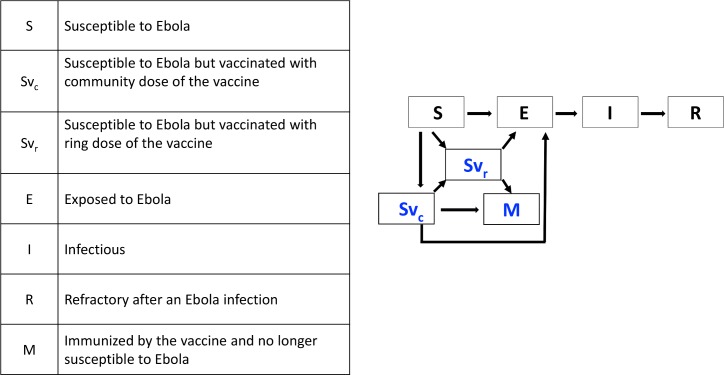
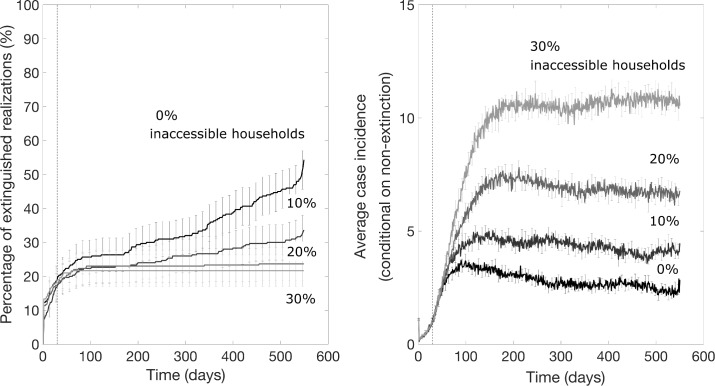
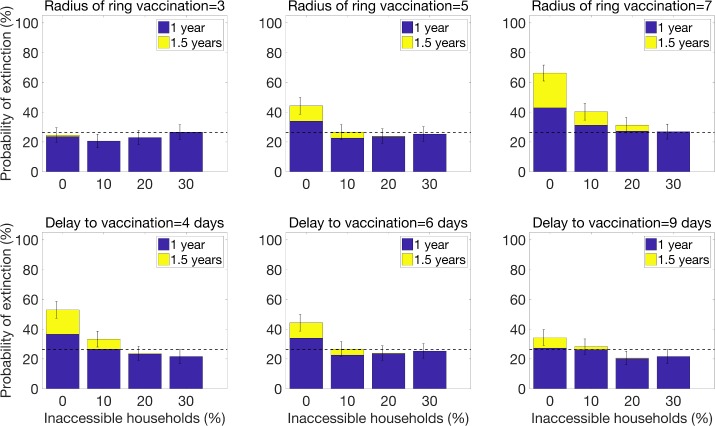
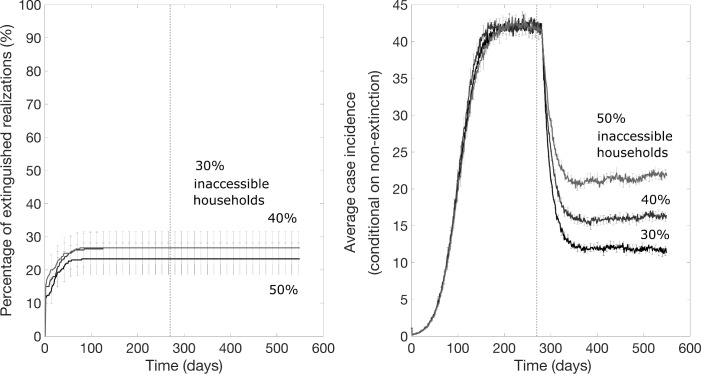
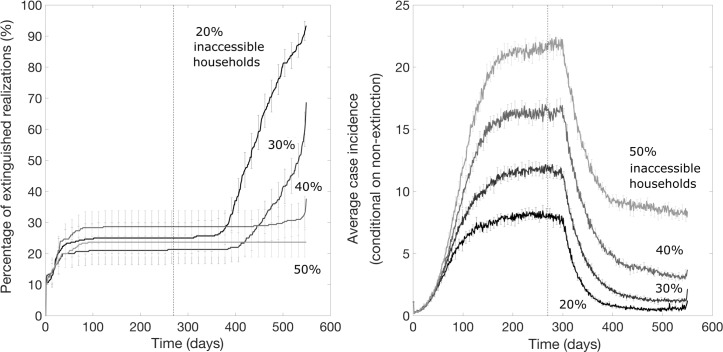
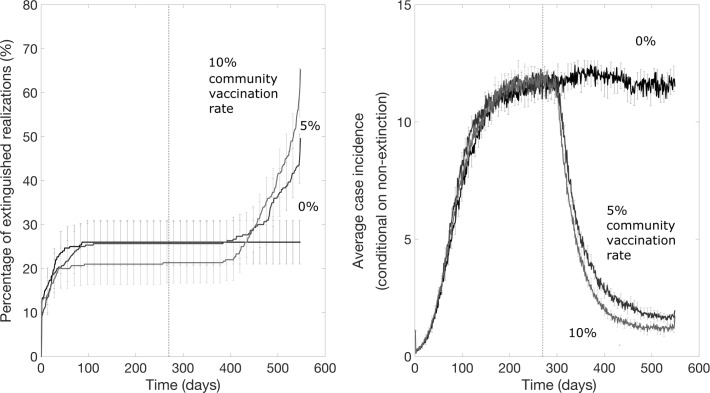
Despite a very effective vaccine, active conflict and community distrust during the ongoing DRC Ebola epidemic are undermining control efforts, including a ring vaccination strategy that requires the prompt immunization of close contacts of infected individuals. However, in April 2019, it was reported 20% or more of close contacts cannot be reached or refuse vaccination, and it is predicted that the ring vaccination strategy would not be effective with such a high level of inaccessibility. The vaccination strategy is now incorporating a "third ring" community-level vaccination that targets members of communities even if they are not known contacts of Ebola cases. To assess the impact of vaccination strategies for controlling Ebola epidemics in the context of variable levels of community accessibility, we employed an individual-level stochastic transmission model that incorporates four sources of heterogeneity: a proportion of the population is inaccessible for contact tracing and vaccination due to lack of confidence in interventions or geographic inaccessibility, two levels of population mixing resembling household and community transmission, two types of vaccine doses with different time periods until immunity, and transmission rates that depend on spatial distance. Our results indicate that a ring vaccination strategy alone would not be effective for containing the epidemic in the context of significant delays to vaccinating contacts even for low levels of household inaccessibility and affirm the positive impact of a supplemental community vaccination strategy. Our key results are that as levels of inaccessibility increase, there is a qualitative change in the effectiveness of the vaccination strategy. For higher levels of vaccine access, the probability that the epidemic will end steadily increases over time, even if probabilities are lower than they would be otherwise with full community participation. For levels of vaccine access that are too low, however, the vaccination strategies are not expected to be successful in ending the epidemic even though they help lower incidence levels, which saves lives, and makes the epidemic easier to contain and reduces spread to other communities. This qualitative change occurs for both types of vaccination strategies: ring vaccination is effective for containing an outbreak until the levels of inaccessibility exceeds approximately 10% in the context of significant delays to vaccinating contacts, a combined ring and community vaccination strategy is effective until the levels of inaccessibility exceeds approximately 50%. More broadly, our results underscore the need to enhance community engagement to public health interventions in order to enhance the effectiveness of control interventions to ensure outbreak containment.


Conflict of interest statement

The authors have declared that no competing interests exist.

Figures

Fig 1
Fig 1. The seven epidemiological states for individuals in the population and the transitions between states.
Susceptible (S) and individuals vaccinated with either the ring or community dose of vaccine (Svr, SVc) may become exposed (E). Once exposed, individuals eventually become infectious and then refractory. Vaccinated individuals that do not become exposed eventually become immunized (M).
Fig 2
Fig 2. Description of the contact network.
A) The contact network is initialized with a single infectious individual (red node) and that individual’s community. For this illustrative schematic, the household size H = 5 and the community size is small with C = 25. The accessibility (white nodes) or inaccessibility (gray nodes) of a household is assigned randomly during the construction of the contact network. The index case happens to be in an inaccessible household: the first case of the simulation does not supply a contact list, and no contacts are vaccinated. B) After several timesteps, the infectious index case exposes another member of their household (blue node in the hith household) and a member of their community (blue node at a distance of 8 households). When the community member is exposed in the hi+8th household, the total contact network is extended by 8 households to include their community (the hi+8th community is outlined with a black rectangle). C) The hi+8th household is accessible, so once the exposed individual becomes infectious a contact list is provided (green nodes) of households within a radius Rv = 2. One household within this radius is excluded since it is inaccessible. The members of this household are not included on contact lists, do not participate in vaccination, and/or are not geographically accessible to the vaccination teams, etc.
Fig 3
Fig 3. Community transmission profiles and steady states in the absence of vaccination.
Transmission rates as a function of distance from an infectious individual for an inverse transmission profile (left) and exponential transmission profile (right) with community reproductive number R0C = 0.7 for both profiles. The inverse distance function is g(η)=1η0.93 and the exponential distance function is f(η) = e−0.02η for the community size C = 401. B). For this community size and transmission profile parameters, a steady state incidence comparable to that of the 2014–16 Ebola epidemic in Liberia is achieved when simulating epidemics in the absence of vaccination (see Fig 4).
Fig 4
Fig 4. Probability of epidemic extinction and the baseline mean daily incidence curves in the absence of interventions for the exponential and gravity transmission profiles that define transmission rates as a function of the distance from an infectious individual (see also Fig 3).
For each transmission profile, the model was calibrated by choosing the community size for each transmission profile by assuming that the ongoing Ebola outbreak in North Kivu would be similar in size to the 2014–16 Ebola outbreak in Liberia in the absence of vaccination. Outbreaks propagate through the population as spatial waves with an endemic state. The average number of cases for the nth day is averaged only for the number of simulations that have not yet extinguished by day n. The error bars show the 95% confidence intervals for the mean daily incidence.
Fig 5
Fig 5. The impact of ring vaccination that starts 30 days after epidemic onset on the probability of outbreak extinction and the mean daily incidence curves for various percentage levels of inaccessible households, which do not participate in vaccination and do not provide contacts lists as explained in the text.
These simulations were generated using the exponential transmission profile, but similar results were obtained using the gravity transmission profile described in the main text. The vertical dashed line indicates the timing of start of the ring vaccination program.
Fig 6
Fig 6. The probability of epidemic control for a ring vaccination strategy as a function of the radius of the ring and the delay to vaccinating contacts.
The baseline parameter value for the radius of ring vaccination is the intermediate value of RVR = 5, and the baseline parameter value for the delay to vaccination is the intermediate value of τ = 6 days. Baseline parameter values for other parameters not varied in this figure are given in Table 1.
Fig 7
Fig 7. The impact of ring vaccination on an established epidemic wave (after a delay of 270 days) on the probability of outbreak extinction and the mean daily incidence curves for various percentage levels of household inaccessibility.
These simulations were generated using the exponential transmission profile, but similar results were obtained using the gravity transmission profile described in the main text. The vertical dashed line indicates the timing of start of the ring vaccination program.
Fig 8
Fig 8. Mean daily case incidence when a community vaccination rate of 10% per day supplements a ring vaccination strategy 9 months later for different levels of household inaccessibility.
The vertical dashed line indicates the timing of start of the supplemental community vaccination efforts. These simulations were generated using the exponential transmission profile, but similar results were obtained using the gravity transmission profile described in the main text.
Fig 9
Fig 9. Probability of epidemic extinction over time and the mean daily case incidence when different community vaccination rates supplement a ring vaccination strategy for a 30% level of household inaccessibility and community vaccination starts 9 months after epidemic onset.
The vertical dashed line indicates the timing of start of community vaccination. These simulations were generated using the exponential transmission profile, but similar results were obtained using the gravity transmission profile described in the main text.
Fig 10
Fig 10. Supplemental effect of community vaccination on the probability of epidemic extinction for populations with different household inaccessibility levels ranging from 0 to 50%.
Bars show the probability of epidemic extinction after 1.5 years for increasing vaccination measures: i) ring vaccination alone (blue bars), ii) ring vaccination with supplemental community vaccination with a rate of 5% community vaccination per day (light blue bars) and iii) ring vaccination with supplemental community vaccination with a rate of 10% vaccination per day. The horizontal line indicates the mean probability of extinction for the baseline scenario in the absence of vaccination. Timing was chosen to resemble the scenario for the DRC Ebola epidemic, with ring vaccination applied after 7 days and community vaccination applied after 9 months. These simulations were generated using the exponential transmission profile, but qualitatively similar results were obtained using the gravity transmission profile described in the main text.

Similar articles

Cited by

References

    1. Yong E. (2019). The WHO Finally Sounds Its Loudest Alarm Over Ebola in the Congo. The Atlantic. Science.
    1. Frontieres M. S. (2019). Ebola outbreak in Democratic Republic of Congo Fighting an epidemic in a conflict zone. MSF Doctors Without Borders.
    1. 2014 Ebola Outbreak in West Africa—Reported Cases Graphs 2016 [cited 2017 March 23]. Available from: https://www.cdc.gov/vhf/ebola/outbreaks/2014-west-africa/cumulative-case....
    1. Pandey A, Atkins KE, Medlock J, Wenzel N, Townsend JP, Childs JE, et al. Strategies for containing Ebola in west Africa. Science. 2014;346(6212):991–5. 10.1126/science.1260612 - DOI - PMC - PubMed
    1. Olu OO, Lamunu M, Nanyunja M, Dafae F, Samba T, Sempiira N, et al. contact Tracing during an Outbreak of ebola Virus Disease in the Western area Districts of sierra leone: lessons for Future ebola Outbreak response. Frontiers in Public Health. 2016;4. - PMC - PubMed

Publication types