. 2019 Nov 21;14(11):e0225183.
doi: 10.1371/journal.pone.0225183. eCollection 2019.

Population productivity of shovelnose rays: Inferring the potential for recovery

Affiliations

Population productivity of shovelnose rays: Inferring the potential for recovery

Brooke M D'Alberto et al. PLoS One. .

Abstract

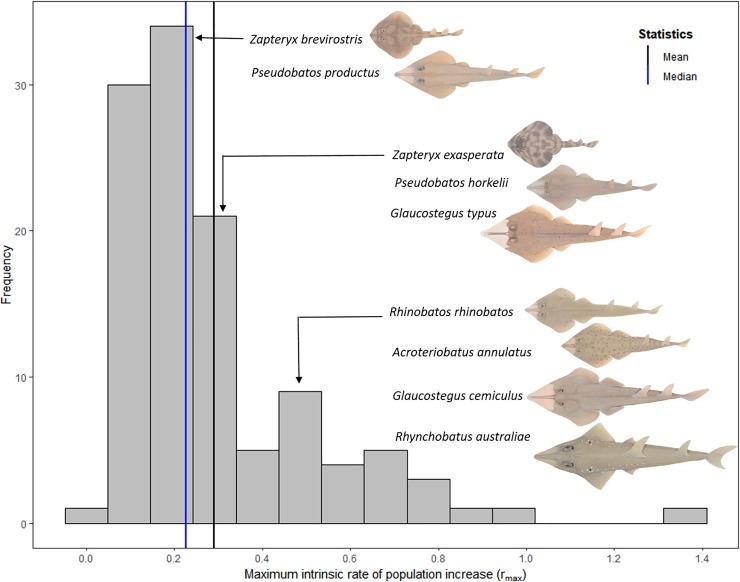
There is recent evidence of widespread declines of shovelnose ray populations (Order Rhinopristiformes) in heavily fished regions. These declines, which are likely driven by high demand for their fins in Asian markets, raises concern about their risk of over-exploitation and extinction. Using life-history theory and incorporating uncertainty into a modified Euler-Lotka model, the maximum intrinsic rates of population increase (rmax) were estimated for nine species from four families of Rhinopristiformes, using four different natural mortality estimators. Estimates of mean rmax, across the different natural mortality methods, varied from 0.03 to 0.59 year-1 among the nine species, but generally increased with increasing maximum size. Comparing these estimates to rmax values for other species of chondrichthyans, the species Rhynchobatus australiae, Glaucostegus typus, and Glaucostegus cemiculus were relatively productive, while most species from Rhinobatidae and Trygonorrhinidae had relatively low rmax values. If the demand for their high-value products can be addressed then population recovery for some species is likely possible, but will vary depending on the species.


Conflict of interest statement

The authors have declared that no competing interests exist.

Figures

Fig 1
Fig 1. Incorporating uncertainty in the model parameters when predicting values of rmax (year-1) for nine shovelnose rays species.
When including uncertainty in age at maturity (αmat, first/orange boxplot), annual reproductive output (b, middle/blue boxplot), and reciprocal of the lifespan natural mortality estimator (M, last/grey boxplot). Species are (A) R. australiae, (B), G. cemiculus, (C) G. typus, (D) A. annulatus, (E) P. horkelii, (F) P. productus, (G) R. rhinobatos, (H) Z. brevirostris, and (I) Z. exasperata. Boxes indicate median, 25 and 75% quantiles, whereas the lines encompass 95% of the values (2.5 and 97.5% quantiles). For plots incorporating uncertainty with other natural mortality methods, see S2 Appendix.
Fig 2
Fig 2. Values of rmax (year-1) for nine shovelnose ray species vary with different methods of estimating natural mortality.
Which are Jensen’s First Estimator (red), modified Hoeing & Hewitt’s Estimator (yellow), Frisk’s Estimator (green), and Reciprocal of lifespan (blue). Means (triangle) and standard deviation (black line) are presented for each method. Species are (A) R. australiae, (B), G. cemiculus, (C) G. typus, (D) A. annulatus, (E) P. horkelii, (F) P. productus, (G) R. rhinobatos, (H) Z. brevirostris, and (I) Z. exasperata. Values below the black dashed line indicate implausible rmax estimates.
Fig 3
Fig 3
Predicted value of rmax for the nine species of shovelnose rays in relation to their (A) age at maturity (amat, years) and (B) annual reproduction rate of females (b). The black lines encompass 95% of the values (2.5 and 97.5% quantiles). The reciprocal of lifespan natural mortality estimator to estimate rmax. The shapes represent the four families; black circles represents the giant guitarfishes, Family Glaucostegidae; black triangles signifies the wedgefishes, Family Rhinidae; black squares represents guitarfishes, Family Rhinobatidae; and black crosses are banjo rays, Family Trygonorrhinidae.
Fig 4
Fig 4
Maximum size(cm TL) for the nine species of shovelnose rays in relation to the (A) median maximum intrinsic rate of population increase (rmax, year-1) using the reciprocal of lifespan to estimate natural mortality, (B) annual reproduction rate of females (b), and (C) size at birth (cm TL). The black lines encompass 95% of the values (2.5 and 97.5% quantiles). The shapes represent the four families; black circles represents the giant guitarfishes, Family Glaucostegidae; black triangles signifies the wedgefishes, Family Rhinidae; black squares represents guitarfishes, Family Rhinobatidae; and black crosses are banjo rays, Family Trygonorrhinidae.
Fig 5
Fig 5. The frequency of the rmax values predicted for 115 chondrichthyans, including the nine shovelnose ray species.
The reciprocal of lifespan natural mortality estimator was used to estimate rmax and species are grouped by their rmax values. Black line denote the mean (rmax = 0.30) and blue line represents the median (rmax = 0.23). The nine shovelnose rays species are displayed on the figure and species illustrations are from Last et al. [75].
Fig 6
Fig 6. Estimates of rmax for 115 chondrichthyans, including the nine shovelnose rays species, compared with life history parameters.
(A) maximum size (cm TL/DW), (B), age at maturity (αmat years), (C) maximum age (αmax, years), (D) annual reproductive output b, (E) the von Bertanlaffy growth coefficient (k, year-1). The nine shovelnose ray species labelled are: RA, R. australiae; GC, G. cemiculus; GT, G. typus; AA, A. annulatus; PH, P. horkelii; PP, P. productus; RR, R. rhinobatos, ZB, Z. brevirostris; ZE, Z. exasperata. The black lines encompass 95% of the values (2.5 and 97.5% quantiles). The median rmax value is reported, using the reciprocal of the lifespan method to estimate natural mortality. All axes are on a logarithmic scale. Species that are listed on CITES Appendix I or II are represented in blue, species listed on CMS Appendix I or II are represented as triangles. Species that are listed on neither CITES or CMS are indicated as grey circles.

References

    1. Dulvy NK, Fowler SL, Musick JA, Cavanagh RD, Kyne PM, Harrison LR, et al. Extinction risk and conservation of the world's sharks and rays. Elife. 2014;3:e00590 Epub 2014/01/23. 10.7554/eLife.00590 - DOI - PMC - PubMed
    1. Ferretti F, Worm B, Britten GL, Heithaus MR, Lotze HK. Patterns and ecosystem consequences of shark declines in the ocean. Ecology Letters. 2010;13(8):1055–71. Epub 2010/06/10. 10.1111/j.1461-0248.2010.01489.x . - DOI - PubMed
    1. Heithaus MR, Frid A, Wirsing AJ, Worm B. Predicting ecological consequences of marine top predator declines. Trends in Ecology & Evolution. 2008;23(4):202–10. - PubMed
    1. Stevens JD, Walker TI, Cook SF, Fordham SV. Threats faced by chondrichthyan fish In: Stevens JC, Simpfendorfer CA, Francis MP, editors. Sharks, rays and chimaeras: the status of the Chondrichthyan fishes: status survey and conservation action plan. Gland, Switzerland: IUCN SSC Shark Specialist Group; 2005. p. 48–54.
    1. Cortés E. Life History Patterns and Correlations in Sharks. Reviews in Fisheries Science. 2000;8(4):299–344. 10.1080/10408340308951115 - DOI

Publication types