. 2019 Nov 18;11(11):2810.
doi: 10.3390/nu11112810.

Genetic Deletion of Syndecan-4 Alters Body Composition, Metabolic Phenotypes, and the Function of Metabolic Tissues in Female Mice Fed A High-Fat Diet

Affiliations

Genetic Deletion of Syndecan-4 Alters Body Composition, Metabolic Phenotypes, and the Function of Metabolic Tissues in Female Mice Fed A High-Fat Diet

Maria De Luca et al. Nutrients. .

Abstract

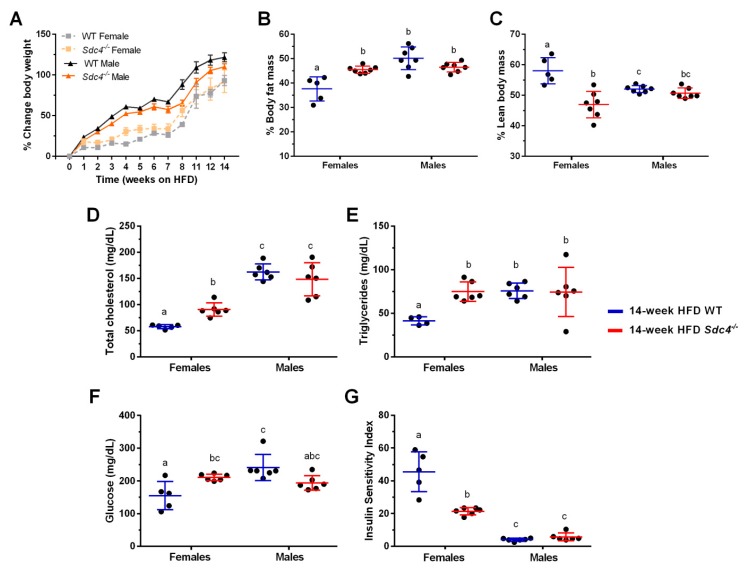
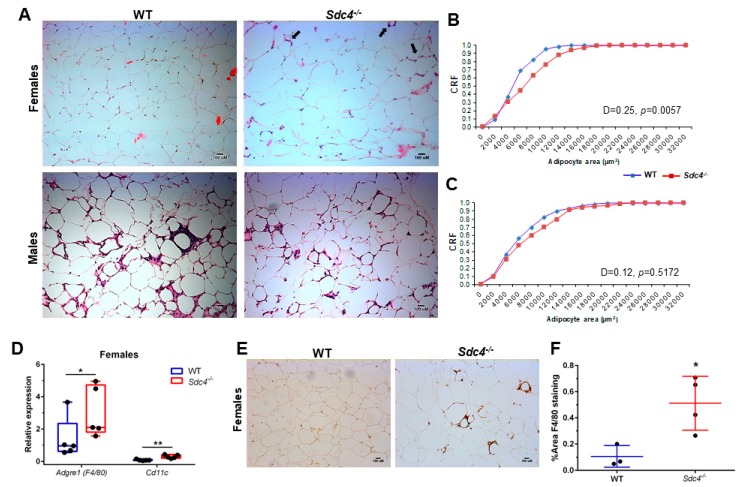
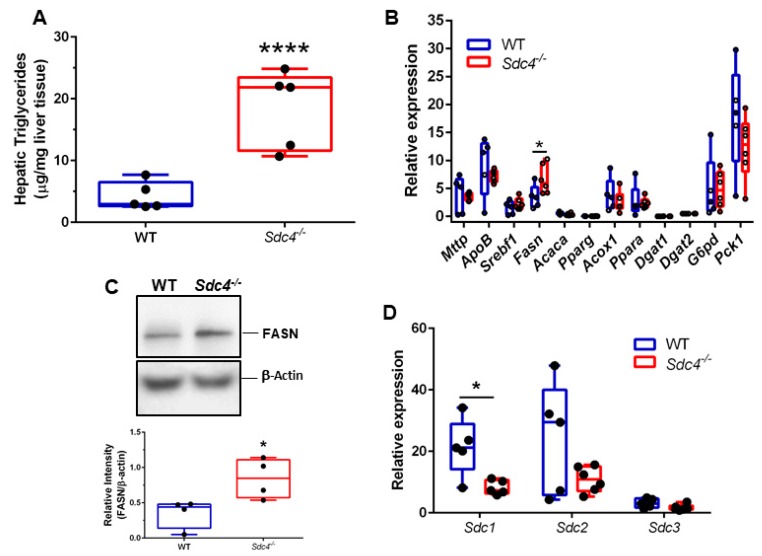
Syndecans are transmembrane proteoglycans that, like integrins, bind to components of the extracellular matrix. Previously, we showed significant associations of genetic variants in the Syndecan-4 (SDC4) gene with intra-abdominal fat, fasting plasma glucose levels, and insulin sensitivity index in children, and with fasting serum triglyceride levels in healthy elderly subjects. An independent study also reported a correlation between SDC4 and the risk of coronary artery disease in middle-aged patients. Here, we investigated whether deletion of Sdc4 promotes metabolic derangements associated with diet-induced obesity by feeding homozygous male and female Sdc4-deficient (Sdc4-/-) mice and their age-matched wild-type (WT) mice a high-fat diet (HFD). We found that WT and Sdc4-/- mice gained similar weight. However, while no differences were observed in males, HFD-fed female Sdc4-/- mice exhibited a higher percentage of body fat mass than controls and displayed increased levels of plasma total cholesterol, triglyceride, and glucose, as well as reduced whole-body insulin sensitivity. Additionally, they had an increased adipocyte size and macrophage infiltration in the visceral adipose tissue, and higher triglyceride and fatty acid synthase levels in the liver. Together with our previous human genetic findings, these results provide evidence of an evolutionarily conserved role of SDC4 in adiposity and its complications.

Keywords: extracellular matrix; heparan sulfate proteoglycans; insulin resistance; lipid profile; obesity; steatosis.


Conflict of interest statement

The authors declare that they have no competing interests.

Figures

Figure 1
Figure 1
Female-specific effects of Sdc4 deficiency on body composition and metabolic phenotypes in high-fat diet (HFD)-induced obesity. (A) Both female and male mice gained weight when fed an HFD for 14 weeks, independent of genotype. (B–G) Compared to WT mice, only female Sdc4-/- mice had more % body fat mass (Panel B), less % lean body mass (Panel C), higher levels of fasting plasma total cholesterol (Panel D), triglycerides (Panel E) and glucose (Panel F), and lower whole body insulin sensitivity (Panel G) following the 14-week diet intervention. Data represent means for n = 5–7 animals of raw data. Error bars represent standard errors. Significant comparisons were determined by post hoc Tukey’s tests at p < 0.05 and are indicated by different letters.
Figure 2
Figure 2
Sdc4 deficiency leads to an increase in visceral adipocyte size and macrophage infiltration in female mice fed an HDF for 14 weeks. (A) Representative haematoxylin and eosin of gonadal WAT (gWAT) sections from mice fed an HFD for 14 weeks. Black arrows in top right panel depict cell infiltration. (B,C) Cumulative relative frequencies (CRF) distribution of adipocyte size from female (Panel B) and male (Panel C) mice (100 cells per animal; n = 3–4). (D) Gene expression levels were measured by qPCR using mRNA isolated from gWAT. Box and whiskers plots denote individual data points, separated by a line representing the group median. Each individual value is plotted as a dot superimposed on the boxplots (n = 5). Transcript levels of each target gene were normalized to Hprt, Actb, and Tbp. (E) Representative images of immunohistochemical staining for F4/80 protein. (F) Data represent means for n = 3–4 animals, with five not overlapping images taken per animal. Error bars represent standard errors. In panels D and F, * p < 0.05 and ** p < 0.01, compared to WT.
Figure 3
Figure 3
Sdc4 deficiency does not affect collagen levels in gonadal WATs isolated from female mice fed an HDF for 14 weeks. (A,B) Representative images of picrosirius red staining (Panel A) with quantification (Panel B). (C,D) Representative images of immunohistochemical staining for Collagen VI, alpha 1 (COL6) (Panel C) with quantification (Panel D). In panels B and D, data represent means for n = 3–4 animals, with five not overlapping images taken per animal. Error bars represent standard errors. (E) Gene expression levels were measured by qPCR using mRNA isolated from gWAT. Box and whiskers plots denote individual data points separated by a line representing the group median. Each individual value is plotted as a dot superimposed on the boxplots. Transcript levels of each target gene were normalized to Hprt, Actb, and Tbp.
Figure 4
Figure 4
Sdc4 deficiency leads to higher levels of hepatic triglycerides and FASN and lower Sdc1 transcript levels in female mice fed an HFD for 14 weeks. (AD) Box and whiskers plots denote individual data points for hepatic triglycerides (Panel A), transcript levels of lipid and glucose metabolism genes (Panel B), FASN protein levels (Panel C), and transcript levels of Sdc genes (Panel D), separated by a line representing the group median. Each individual value is plotted as a dot superimposed on the boxplots. In panel C, representative Western blotting for FASN, with β-actin used as loading control. In panels B and D, transcript levels of each target gene were normalized to Hprt, Actb, and Tbp. In all panels, * indicates. P < 0.05 and **** p < 0.0001 compared to WT mice.

References

    1. Collaborators G.B.D.O., Afshin A., Forouzanfar M.H., Reitsma M.B., Sur P., Estep K., Lee A., Marczak L., Mokdad A.H., Moradi-Lakeh M., et al. Health Effects of Overweight and Obesity in 195 Countries over 25 Years. N. Engl. J. Med. 2017;377:13–27. doi: 10.1056/NEJMoa1614362. - DOI - PMC - PubMed
    1. Sun K., Kusminski C.M., Scherer P.E. Adipose tissue remodeling and obesity. J. Clin. Investig. 2011;121:2094–2101. doi: 10.1172/JCI45887. - DOI - PMC - PubMed
    1. Mariman E.C.M., Wang P. Adipocyte extracellular matrix composition, dynamics and role in obesity. Cell. Mol. Life Sci. 2010;67:1277–1292. doi: 10.1007/s00018-010-0263-4. - DOI - PMC - PubMed
    1. Frantz C., Stewart K.M., Weaver V.M. The extracellular matrix at a glance. J. Cell Sci. 2010;123:4195–4200. doi: 10.1242/jcs.023820. - DOI - PMC - PubMed
    1. Rockey D.C., Bell P.D., Hill J.A., Ben Salem C., Slim R., Fathallah N., Urban M.L., Manenti L., Vaglio A. Fibrosis—A Common Pathway to Organ Injury and Failure. N. Engl. J. Med. 2015;372:1138–1149. doi: 10.1056/NEJMra1300575. - DOI - PubMed

LinkOut - more resources