. 2019 Nov 18;8(11):1454.
doi: 10.3390/cells8111454.

Mitochondrial Mass Assessment in a Selected Cell Line under Different Metabolic Conditions

Affiliations

Mitochondrial Mass Assessment in a Selected Cell Line under Different Metabolic Conditions

Anna Costanzini et al. Cells. .

Abstract

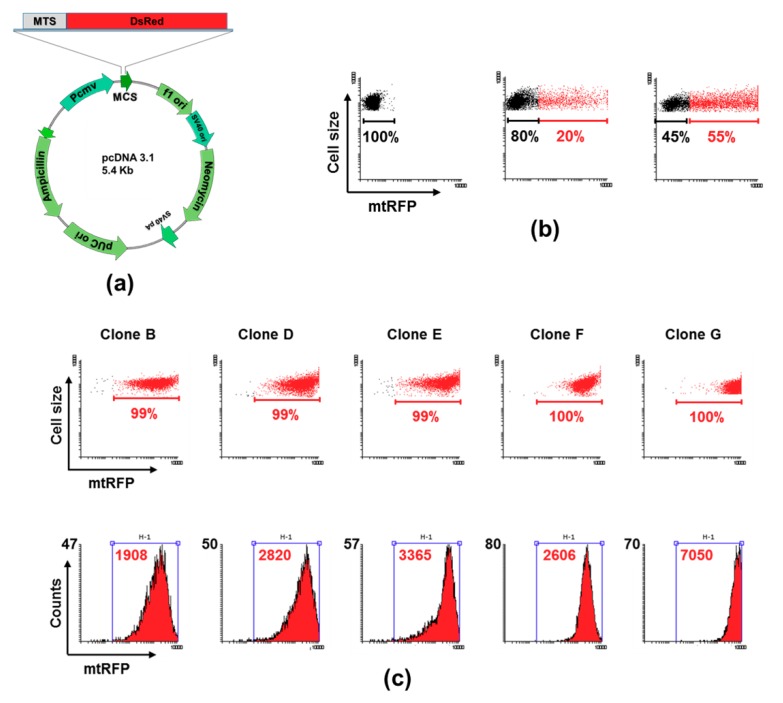
Changes of quantity and/or morphology of cell mitochondria are often associated with metabolic modulation, pathology, and apoptosis. Exogenous fluorescent probes used to investigate changes in mitochondrial content and dynamics are strongly dependent, for their internalization, on the mitochondrial membrane potential and composition, thus limiting the reliability of measurements. To overcome this limitation, genetically encoded recombinant fluorescent proteins, targeted to different cellular districts, were used as reporters. Here, we explored the potential use of mitochondrially targeted red fluorescent probe (mtRFP) to quantify, by flow cytometry, mitochondrial mass changes in cells exposed to different experimental conditions. We first demonstrated that the mtRFP fluorescence intensity is stable during cell culture and it is related with the citrate synthase activity, an established marker of the mitochondrial mass. Incidentally, the expression of mtRFP inside mitochondria did not alter the oxygen consumption rate under both state 3 and 4 respiration conditions. In addition, using this method, we showed for the first time that different inducers of mitochondrial mass change, such as hypoxia exposure or resveratrol treatment of cells, could be consistently detected. We suggest that transfection and selection of stable clones expressing mtRFP is a reliable method to monitor mitochondrial mass changes, particularly when pathophysiological or experimental conditions change ΔΨm, as it occurs during mitochondrial uncoupling or hypoxia/anoxia conditions.

Keywords: cancer cells; flow cytometry; hypoxia; mitochondrial mass; mtRFP; resveratrol.


Conflict of interest statement

The authors declare no conflict of interest.

Figures

Figure 1
Figure 1
Preparation and isolation of mtRFP clones from 143B cells. (a) Scheme of pcDNA3.1 plasmid used to transfect cells, showing the mitochondrial targeting sequence (MTS) of COX VIII attached to a dsRED (RFP) sequence. (b) Representative dot plot graphs, obtained by flow cytometry, displaying the mtRFP fluorescence intensity of untreated (left panel), 24 h (middle panel) and 48 h (right panel) transfected cells. The percentage of mtRFP-positive cells is indicated in red. (c) Analysis of single clones prepared by limiting dilution. Top panel: dot plot analysis showing percent of mtRFP-positive cells (red). Bottom panel: histogram representation of the dot plots analysis showing the cell fluorescence distribution; the mean fluorescence intensity of H1-gated population is indicated in red.
Figure 2
Figure 2
Stability of mtRFP fluorescence intensity in osteosarcoma derived clones. Representative time dependence of the mean fluorescence intensity assayed in mtRFP-positive cells (143B-Clone E) over a month. Linear regression (red line) of the data show that the mean florescence intensity of mtRFP-positive cells was stable.
Figure 3
Figure 3
mtRFP fluorescence intensity and mitochondria mass are directly related. (a) Cell fluorescence distribution of both 143B parental cells and derived mtRFP clones (143B-Clone E and the 143B-Clone G); the mean fluorescence intensity of H1-gated population is indicated in red. (b) Fluorometric measurements of two different amounts of intact and lysed mtRFP-cells.
Figure 4
Figure 4
Oxygen consumption rate of 143B and mtRFP-expressing cells. Cell respiration of the parental 143B (black bar) and mtRFP-expressing cells (red bars) was assayed in intact cells (a) or in digitonin-permeabilized cells under both Complex I-driven state 4 (b) and state 3 (c) respiration rates, expressed as nmol O2/min/mg protein. From b and c, the respiratory control ratio (RCR) was calculated (d). Histograms show the mean ± SD of three different experiments.
Figure 5
Figure 5
Mitochondria mass evaluation of 143B-Clones D and E. (a) mtRFP fluorescence intensity (red lines) and CS activity (blue lines) assayed during 18 days in Clone D (triangles) and Clone E (circles). Points are the mean ± SD of four assays. (b) Mean fluorescence intensity (red bars) and CS activity (blue bars) assayed in Clones D and E cultured in both normoxic (21% O2) and hypoxic conditions (0.5% O2). (c) mtDNA content evaluated in Clone E exposed to both normoxia and hypoxia. Histograms show the mean ± SD of three different experiments. * p < 0.05 and ** p < 0.01 indicate the statistical significance of data. (d) Representative fluorescence microscopy images (magnification 40×) of Clone E cultured 48 h either in hypoxia (bottom panel) or control conditions (top panel).
Figure 6
Figure 6
Mitochondrial mass evaluation in 143B-Clone E cells exposed for 48 h to increasing concentration of RSV. (a) Relationship between the mean fluorescence intensity values (red bars) and the CS activity (blue bars) measured in cells cultured in the absence or in the presence of increasing RSV concentration. (b) Cellular mtDNA content evaluated in the presence of different RSV concentrations. Histograms show the mean ± SD of three different experiments. * p < 0.05 and ** p < 0.01 indicate the statistical significance of data. (c) Representative fluorescence microscopy images (magnification 40×) of cells cultured in either the absence or presence of RSV.

References

    1. Bulthuis E.P., Adjobo-Hermans M.J.W., Willems P., Koopman W.J.H. Mitochondrial morphofunction in mammalian cells. Antioxid. Redox Signal. 2019;30:2066–2109. doi: 10.1089/ars.2018.7534. - DOI - PMC - PubMed
    1. Youle R.J., van der Bliek A.M. Mitochondrial fission, fusion, and stress. Science. 2012;337:1062–1065. doi: 10.1126/science.1219855. - DOI - PMC - PubMed
    1. Malena A., Pantic B., Borgia D., Sgarbi G., Solaini G., Holt I.J., Spinazzola A., Perissinotto E., Sandri M., Baracca A., et al. Mitochondrial quality control: Cell-type-dependent responses to pathological mutant mitochondrial DNA. Autophagy. 2016;12:2098–2112. doi: 10.1080/15548627.2016.1226734. - DOI - PMC - PubMed
    1. Rossignol R., Gilkerson R., Aggeler R., Yamagata K., Remington S.J., Capaldi R.A. Energy substrate modulates mitochondrial structure and oxidative capacity in cancer cells. Cancer Res. 2004;64:985–993. doi: 10.1158/0008-5472.CAN-03-1101. - DOI - PubMed
    1. Nakada K., Inoue K., Ono T., Isobe K., Ogura A., Goto Y.I., Nonaka I., Hayashi J.I. Inter-mitochondrial complementation: Mitochondria-specific system preventing mice from expression of disease phenotypes by mutant mtDNA. Nat. Med. 2001;7:934–940. doi: 10.1038/90976. - DOI - PubMed

Publication types

Substances