

Effects of prostaglandin F2α (PGF2α) on cell-death pathways in the bovine corpus luteum (CL)
- PMID: 31752870
- PMCID: PMC6873574
- DOI: 10.1186/s12917-019-2167-3
Effects of prostaglandin F2α (PGF2α) on cell-death pathways in the bovine corpus luteum (CL)
Abstract
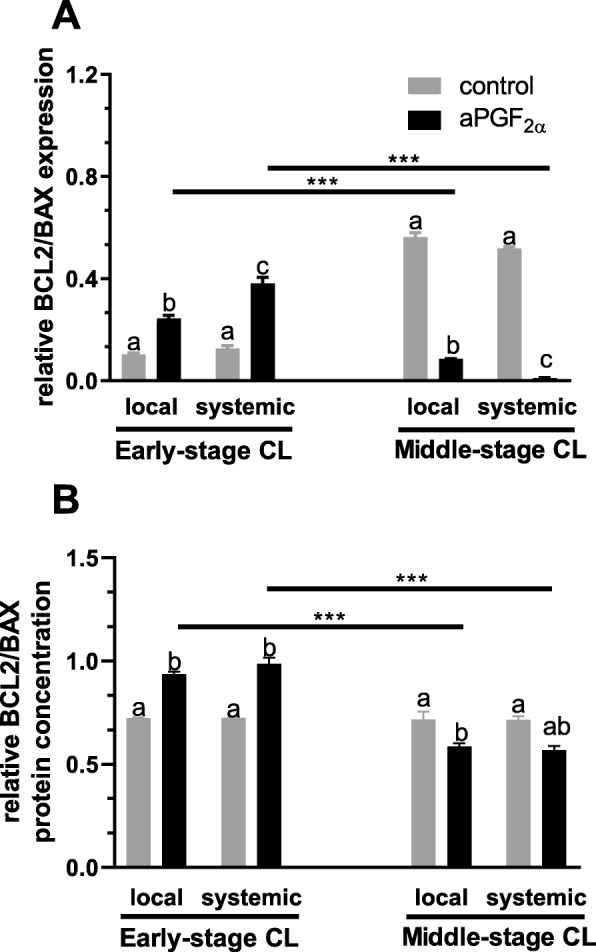
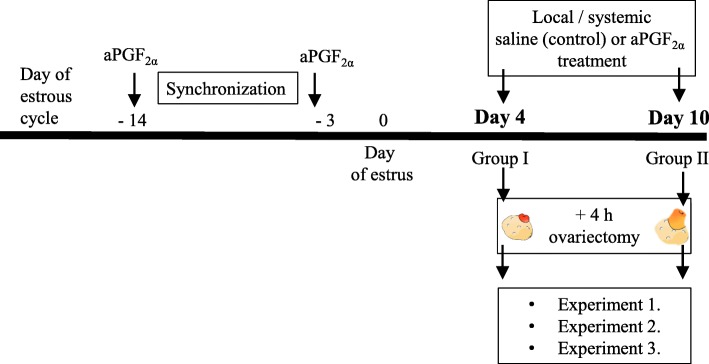
Background: Prostaglandin F2α (PGF2α) may differentially affect viability of luteal cells by inducing either proliferation or cell death (via apoptosis or necroptosis). The diverse effects of PGF2α may depend on its local vs. systemic actions. In our study, we determined changes in expression of genes related to: (i) apoptosis: caspase (CASP) 3, CASP8, BCL2 associated X (BAX), B-cell lymphoma 2 (BCL2) and (ii) necroptosis: receptor-interacting protein kinase (RIPK) 1, RIPK3, cylindromatosis (CYLD), and mixed lineage kinase domain-like (MLKL) in the early and mid-stage corpus luteum (CL) that accompany local (intra-CL) vs. systemic (i.m.) analogue of PGF2α (aPGF2α) actions. Cows at day 4 (n = 24) or day 10 (n = 24) of the estrous cycle were treated by injections as follows: (1) systemic saline, (2) systemic aPGF2α (25 mg; Dinoprost), (3) local saline, (4) local aPGF2α (2.5 mg; Dinoprost). After 4 h, CLs were collected by ovariectomy. Expression levels of mRNA and protein were investigated by RT-q PCR, Western blotting and immunohistochemistry, respectively.
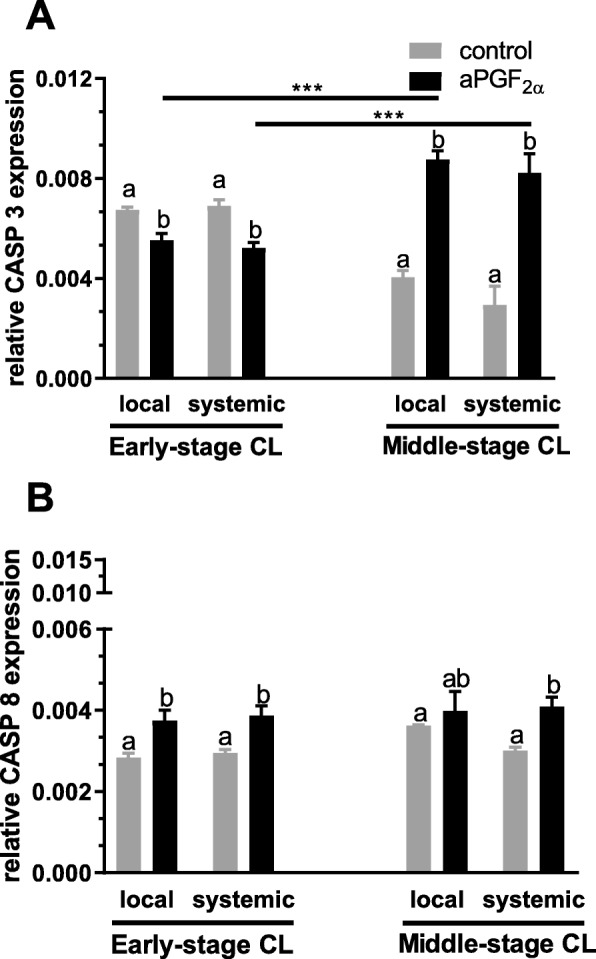
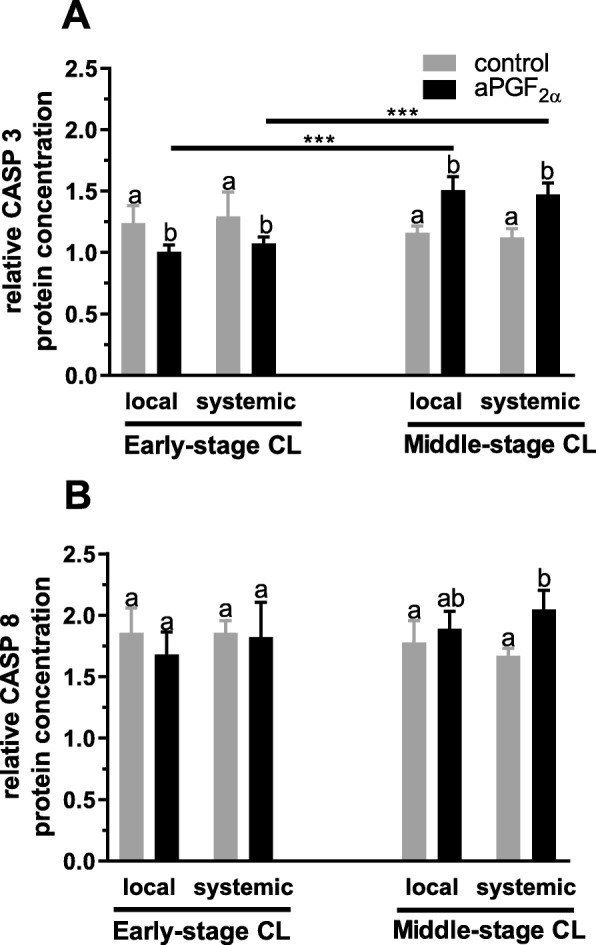
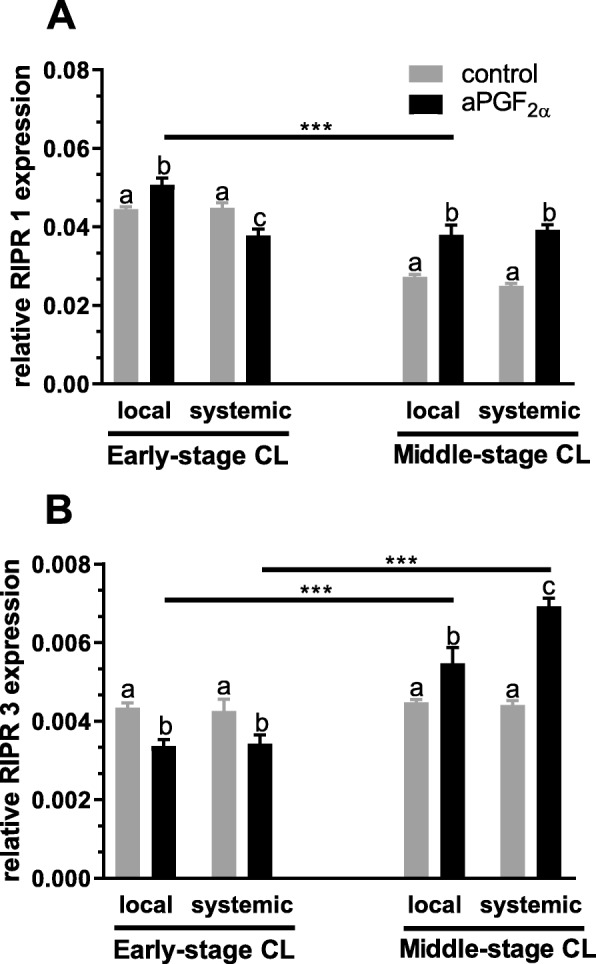
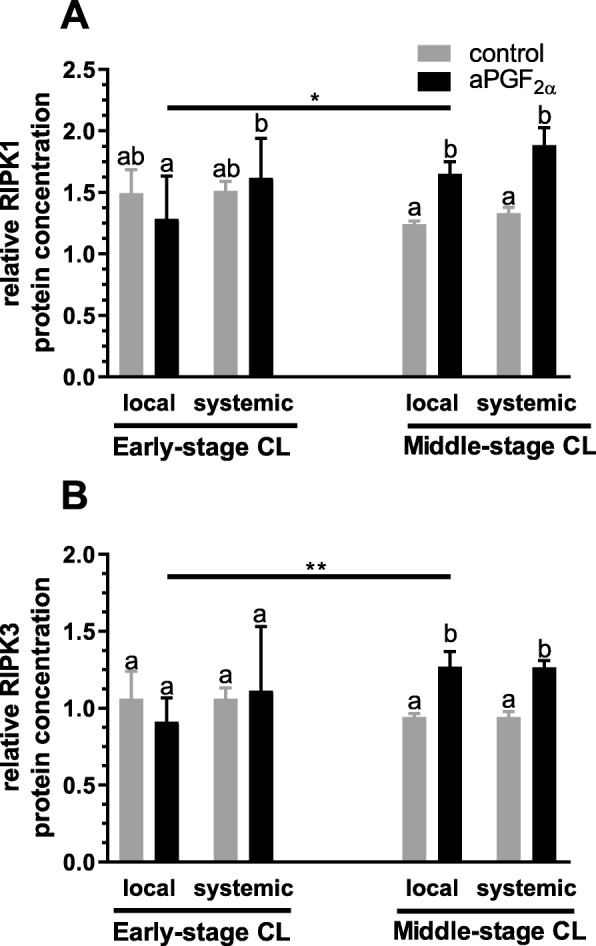
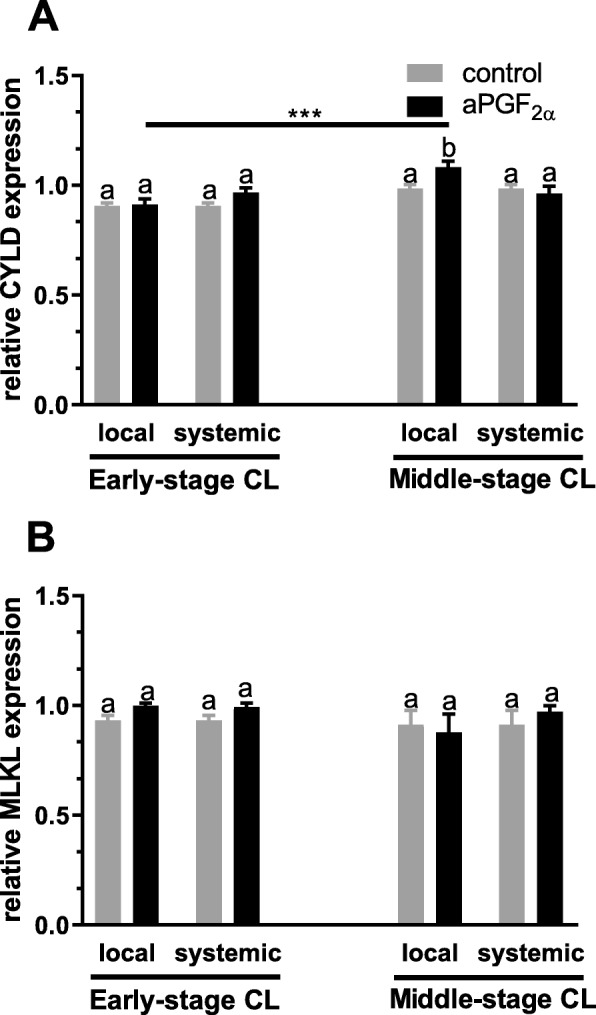
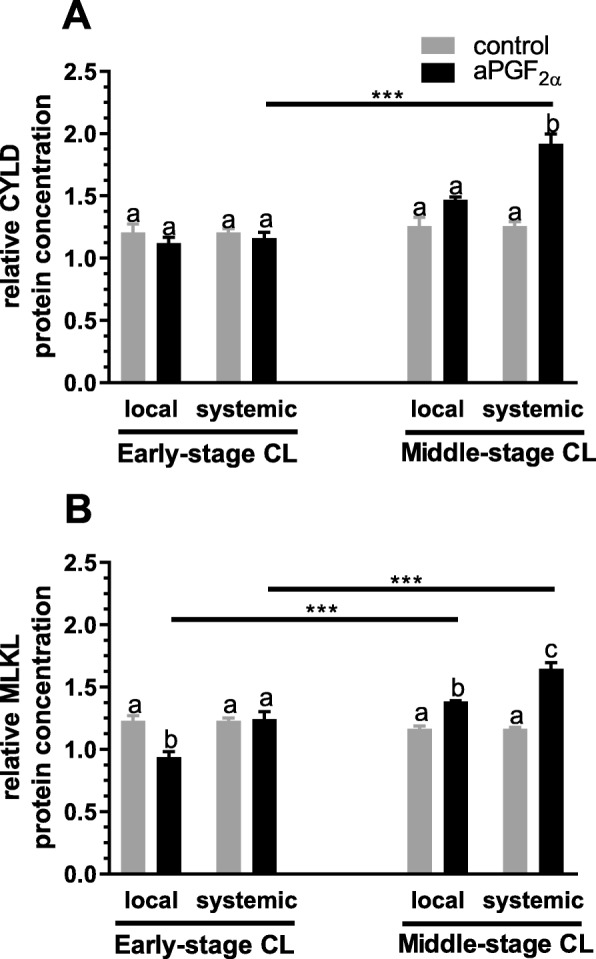
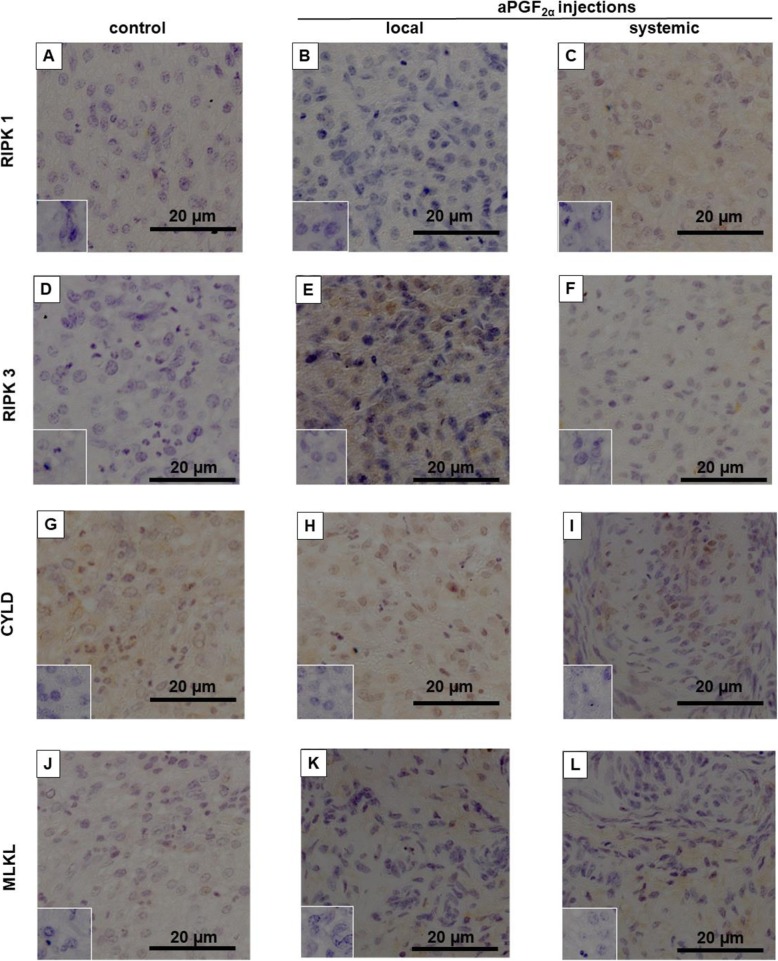
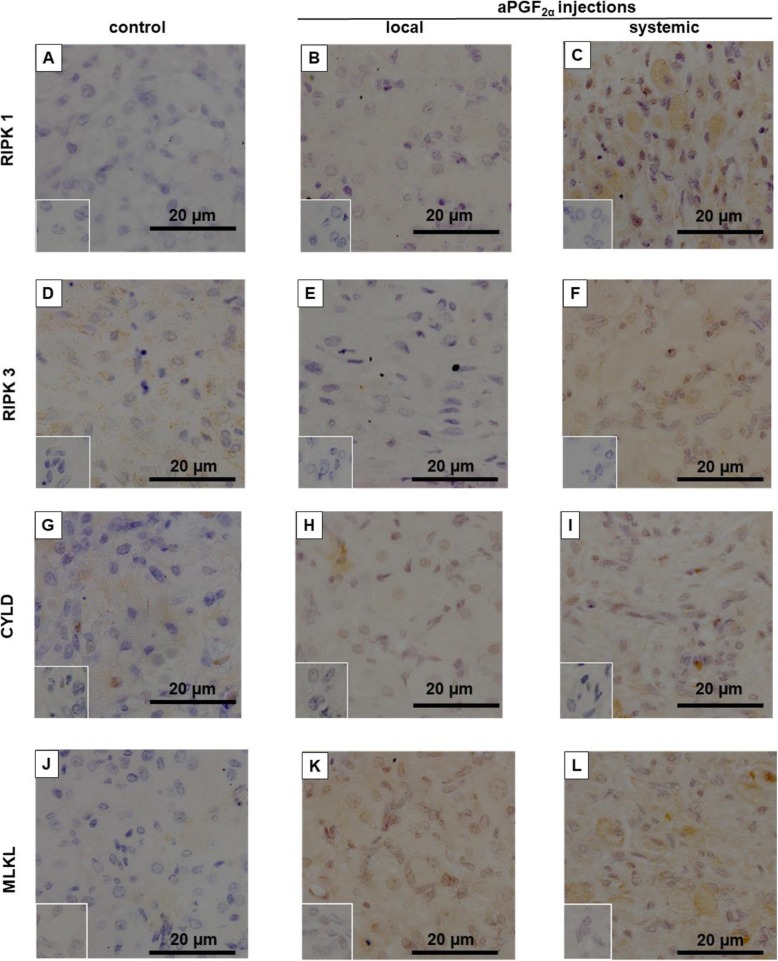
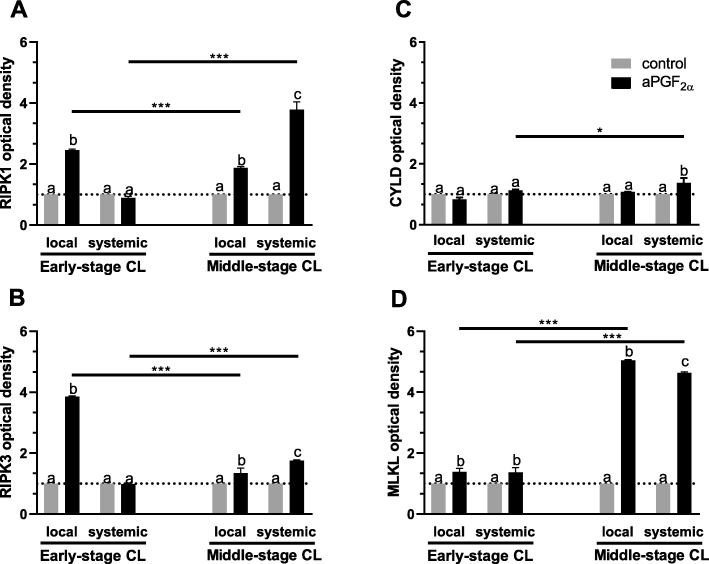
Results: We found that local and systemic administration of aPGF2α in the early-stage CL resulted in decreased expression of CASP3 (P < 0.01), but CASP8 mRNA expression was up-regulated (P < 0.05). However, the expression of CASP3 was up-regulated after local aPGF2α treatment in the middle-stage CL, whereas systemic aPGF2α administration increased both CASP3 and CASP8 expression (P < 0.01). Moreover, we observed that both local and systemic aPGF2α injections increased RIPK1, RIPK3 and MLKL expression in the middle-stage CL (P < 0.05) while CYLD expression was markedly higher after i.m. aPGF2α injections (P < 0.001). Moreover, we investigated the localization of necroptotic factors (RIPK1, RIPK3, CYLD and MLKL) in bovine CL tissue after local and systemic aPGF2α injections in the bovine CL.
Conclusion: Our results demonstrated for the first time that genes related to cell death pathways exhibit stage-specific responses to PGF2α administration depending on its local or systemic actions. Locally-acting PGF2α plays a luteoprotective role by inhibiting apoptosis and necroptosis in the early CL. Necroptosis is a potent mechanism responsible for structural CL regression during PGF2α-induced luteolysis in cattle.
Keywords: Apoptosis; Bovine CL; Necroptosis; Prostaglandin F2α; RIPKs.
Conflict of interest statement
The authors declare that they have no competing interest.
Figures
References
-
- Niswender GD, Juengel JL, Silva PJ, Rollyson MK, McIntush EW. Mechanisms controlling the function and life span of the corpus luteum. Physiol Rev. 2000. 10.1152/physrev.2000.80.1.1. - PubMed
-
- McCracken JA, Custer EE, Lamsa JC. Luteolysis: a neeuroendocrine-mediated event. Physiol Rev. 1999. 10.1152/physrev.1999.79.2.263. - PubMed
-
- Miyamoto A, Shirasuna K, Shimizu T, Bollwein H, Schams D. Regulation of corpus luteum development and maintenance: specific roles of angiogenesis and action of prostaglandin F2alpha. Soc Reprod Fertil Suppl. 2010;67:289–304. - PubMed
-
- Juengel JL, Garverick HA, Johnson AL, Youngquist RS, Smith MF. Apoptosis during luteal regression in cattle. Endocrinology. 1993. 10.1210/endo.132.1.8419126. - PubMed
-
- Yadav VK, Lakshmi G , Medhamurthy R. Prostaglandin F2α-mediated activation of apoptotic signaling cascades in the corpus luteum during apoptosis: involvement of caspase-activated DNase. J Biol Chem. 2005;doi: 10.1074/jbc. M409596200. - PubMed
Publication types
MeSH terms
Substances
Grants and funding
LinkOut - more resources
Full Text Sources
Research Materials
Miscellaneous
