. 2019 Nov 21;16(1):232.
doi: 10.1186/s12974-019-1626-x.

Distinct migratory pattern of naive and effector T cells through the blood-CSF barrier following Echovirus 30 infection

Affiliations

Distinct migratory pattern of naive and effector T cells through the blood-CSF barrier following Echovirus 30 infection

Marie Wiatr et al. J Neuroinflammation. .

Abstract

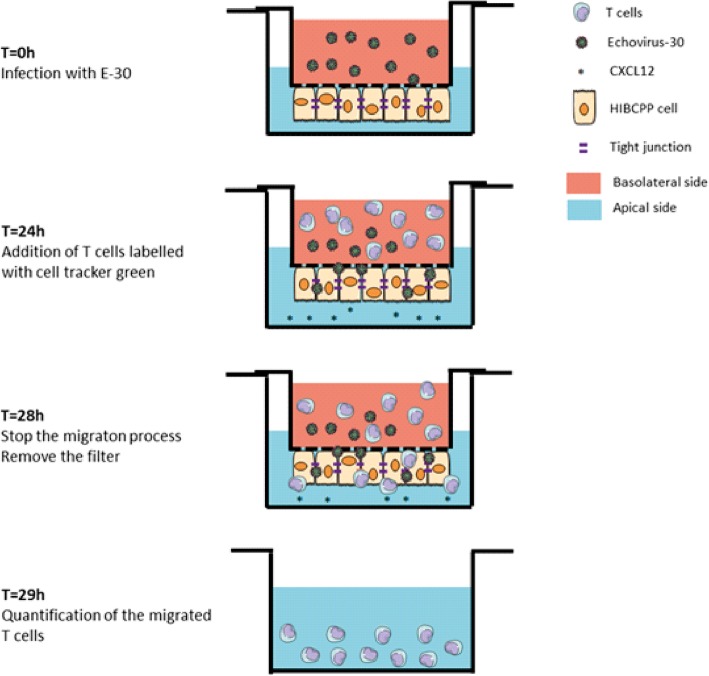
Background: Echovirus 30 (E-30) is one of the most frequently isolated pathogens in aseptic meningitis worldwide. To gain access to the central nervous system (CNS), E-30 and immune cells have to cross one of the two main barriers of the CNS, the epithelial blood-cerebrospinal fluid barrier (BCSFB) or the endothelial blood-brain barrier (BBB). In an in vitro model of the BCSFB, it has been shown that E-30 can infect human immortalized brain choroid plexus papilloma (HIBCPP) cells.

Methods: In this study we investigated the migration of different T cell subpopulations, naive and effector T cells, through HIBCPP cells during E-30 infection. Effects of E-30 infection and the migration process were evaluated via immunofluorescence and flow cytometry analysis, as well as transepithelial resistance and dextran flux measurement.

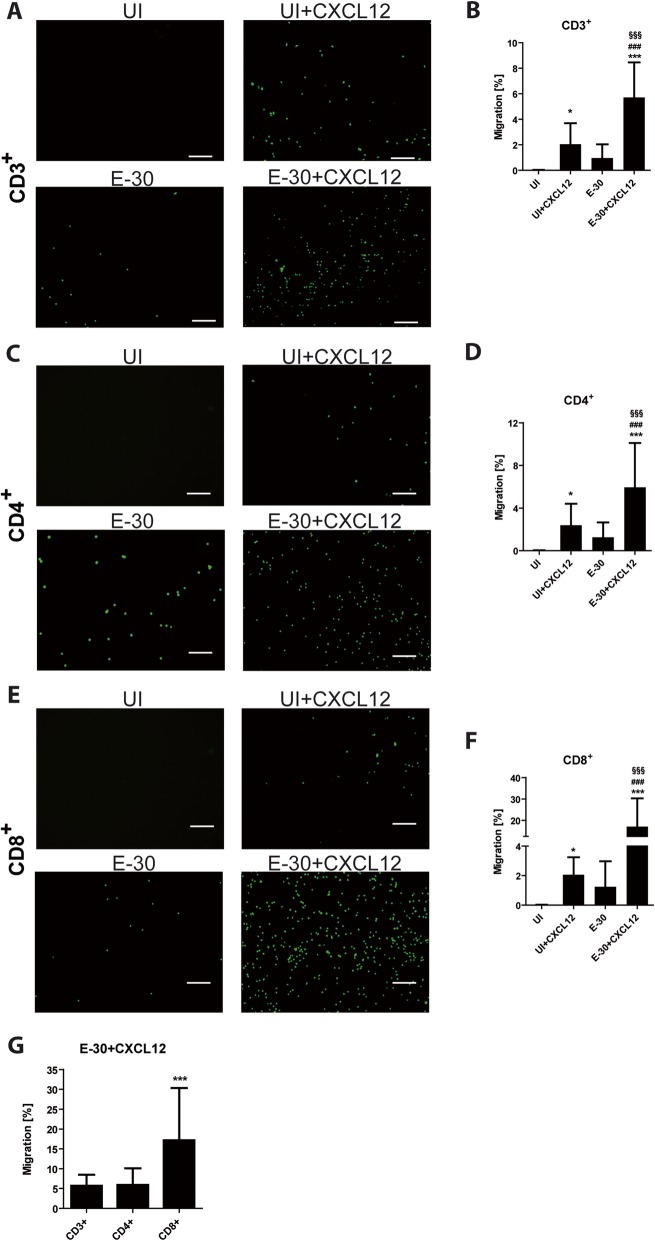
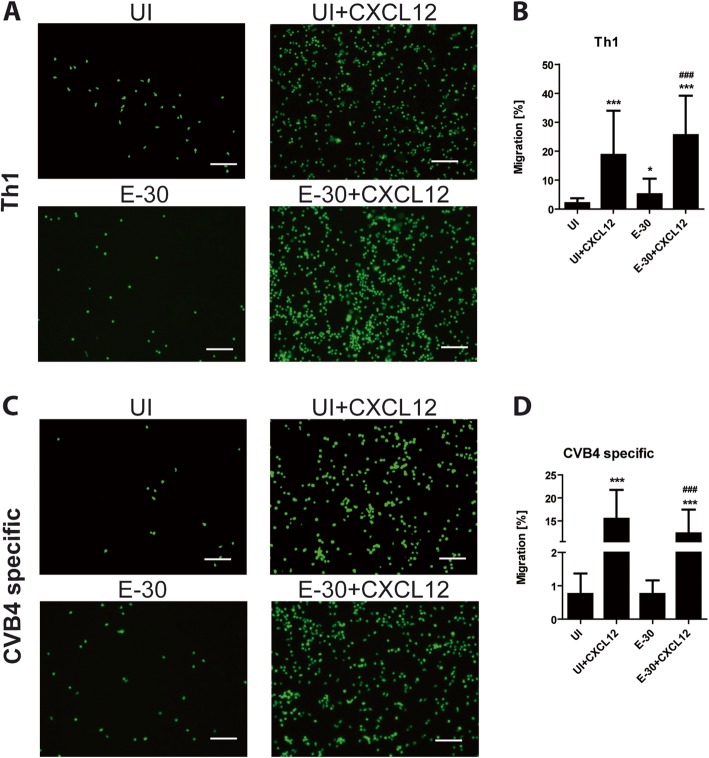
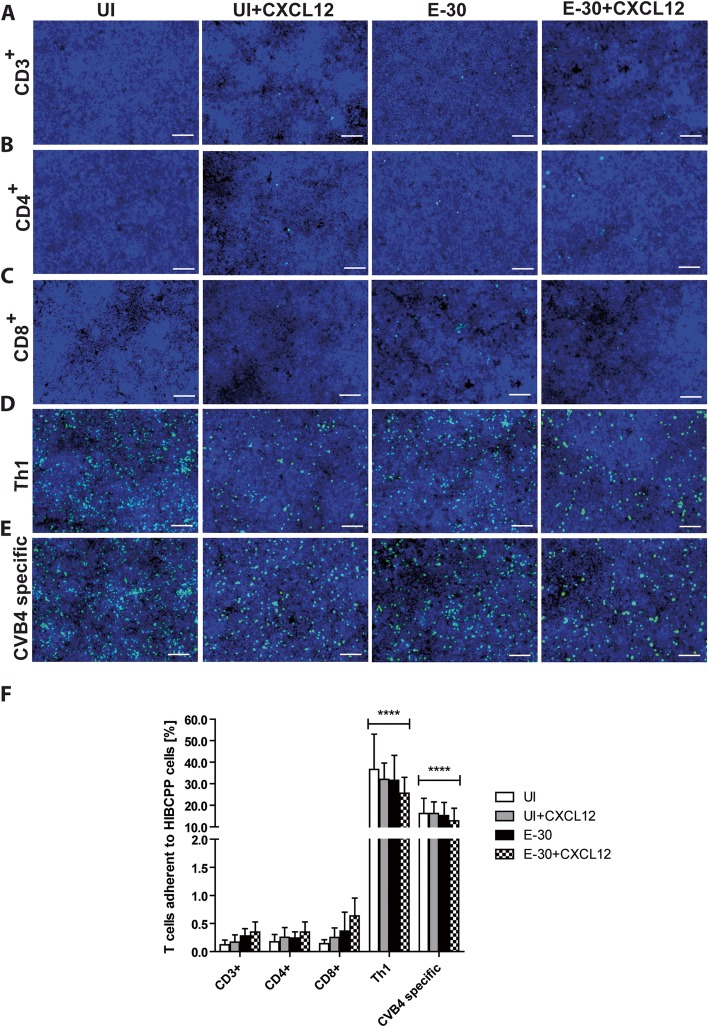
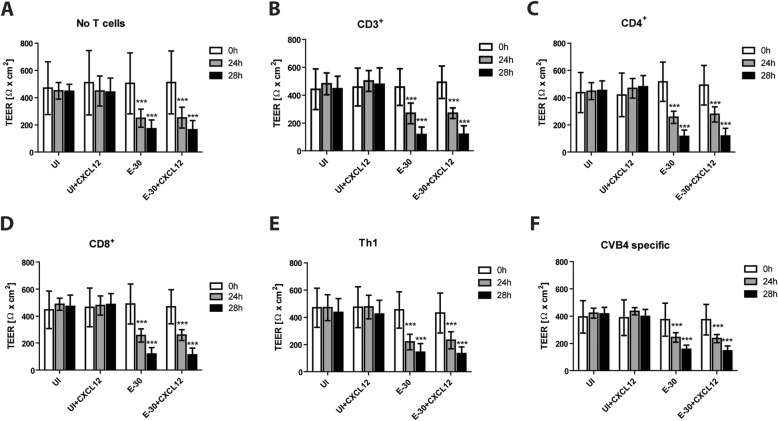
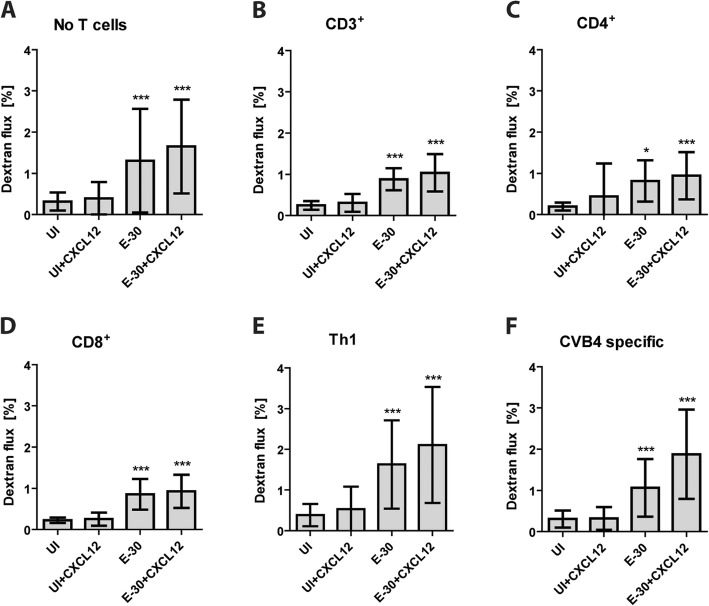
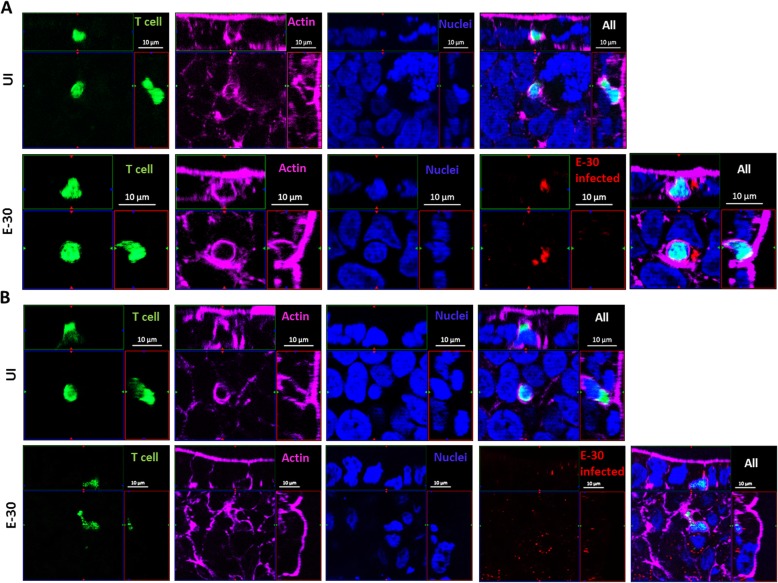
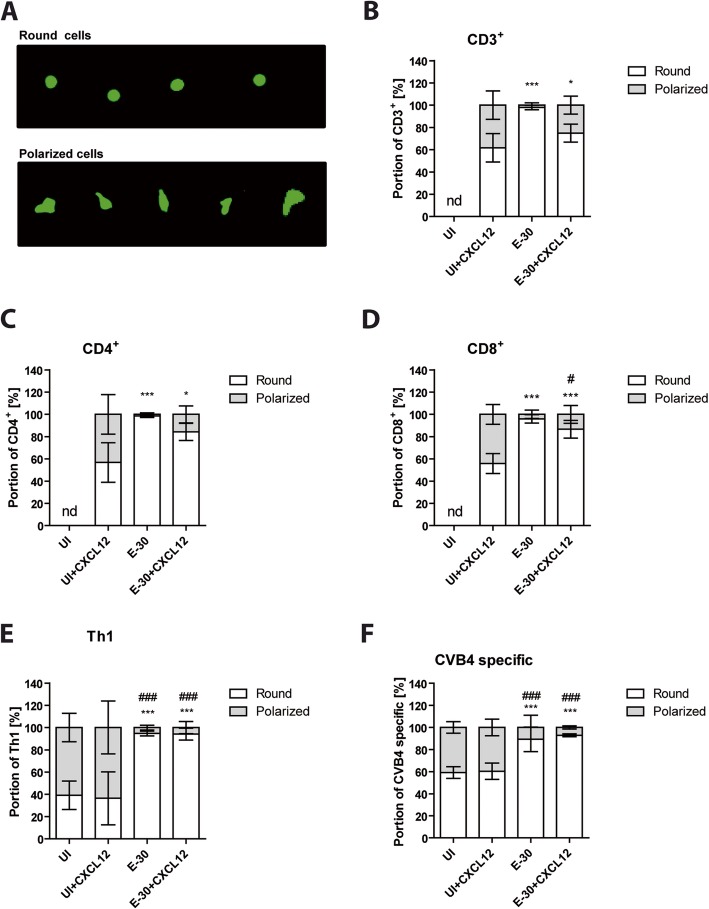
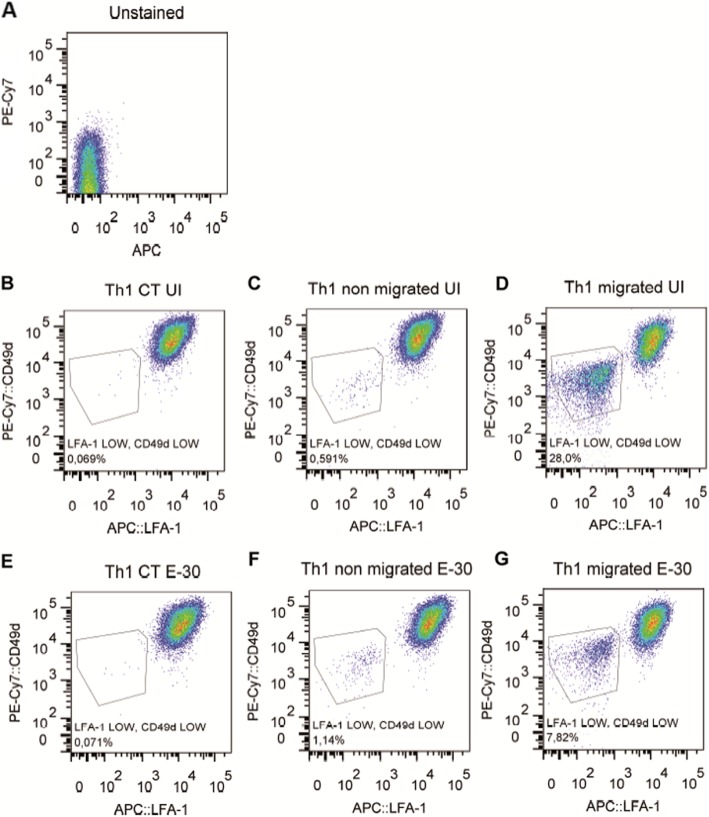
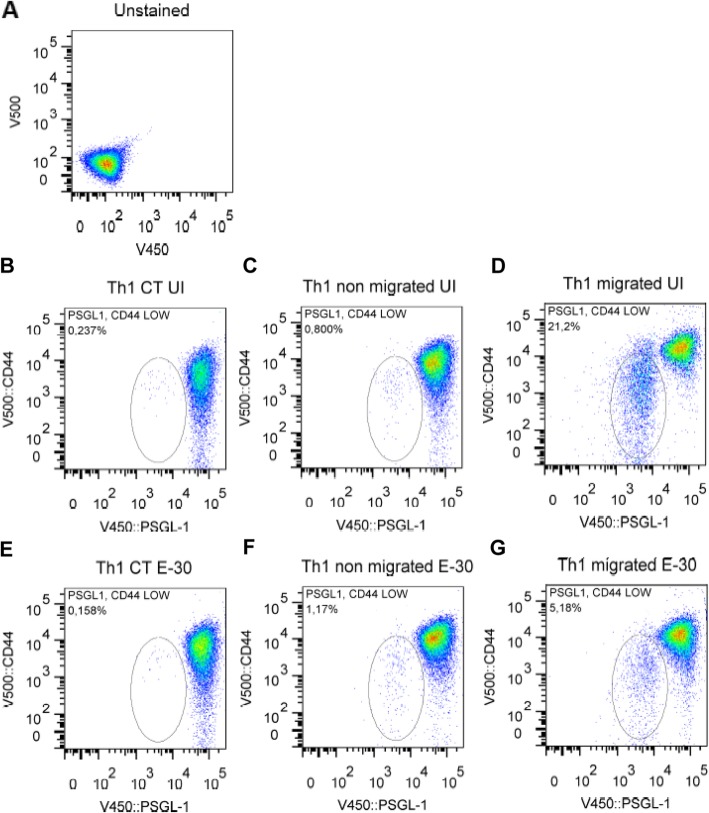
Results: Th1 effector cells and enterovirus-specific effector T cells migrated through HIBCPP cells more efficiently than naive CD4+ T cells following E-30 infection of HIBCPP cells. Among the different naive T cell populations, CD8+ T cells crossed the E-30-infected HIBCPP cell layer in a significantly higher number than CD4+ T cells. A large amount of effector T cells also remained attached to the basolateral side of the HIBCPP cells compared with naive T cells. Analysis of HIBCPP barrier function showed significant alteration after E-30 infection and trans- as well as paracellular migration of T cells independent of the respective subpopulation. Morphologic analysis of migrating T cells revealed that a polarized phenotype was induced by the chemokine CXCL12, but reversed to a round phenotype after E-30 infection. Further characterization of migrating Th1 effector cells revealed a downregulation of surface adhesion proteins such as LFA-1 PSGL-1, CD44, and CD49d.

Conclusion: Taken together these results suggest that naive CD8+ and Th1 effector cells are highly efficient to migrate through the BCSFB in an inflammatory environment. The T cell phenotype is modified during the migration process through HIBCPP cells.

Keywords: Blood–cerebrospinal fluid barrier; Effector T cells; Enterovirus; Meningitis; Naive T cells; T cell migration.


Conflict of interest statement

The authors declare that they have no competing interests.

Figures

Fig. 1
Fig. 1
Schematic image of the experimental set-up of transmigration experiments. At first HIBCPP cells were infected with E-30 MOI (0.7) T = 0 h. At T = 24 h post infection T cells were labeled with cell tracker green and added to the upper compartment of the well. CXCL12 was added to the bottom of the well in some conditions. At the end of the 4 h of migration experiment the filters were removed and the T cells present on the bottom part of the well were counted under the microscope
Fig. 2
Fig. 2
E-30 infection of HIBCPP cells enhances migration of naive T cells. Migration of naive CD3+, CD4+, CD8+ T cells across HIBCPP cells was evaluated via immunofluorescence imaging in the following conditions: UI, UI + CXCL12, E-30 and E-30 + CXCL12. T cells were stained with cell tracker green Alexa 488. After 4 h of migration across HIBCPP cells immunofluorescence imaging (10 FOV per condition) was taken for CD3+ (a), CD4+ (c), and CD8+ (e) T cells present in the bottom well. b, d, f represent quantifications of T cells present in the bottom well after 4 h of migration for CD3+ CD4+ and CD8+ respectively. g Shows the quantification of naive T cells in E-30 + CXCL12 condition. The data are shown as mean ± SD of 6 independent experiments each performed in triplicate. Statistical significance was calculated using a Tukey–Kramer test. p values are displayed as follows: *p < 0.05 and ***p < 0.0001. p < 0.05 (*) was reached comparing UI to UI + CXCL12; p < 0.0001 (***) was reached comparing UI to E-30 + CXCL12 and comparing CD8+ with CD3+ and CD4+ after E-30 + CXCL12 stimulation; p < 0.0001 (###) was reached comparing UI + CXCL12 to E-30 + CXCL12, and p < 0.0001 (§§§) was reached comparing E-30 to E-30 + CXCL12. The white scale bar represents 100 μm
Fig. 3
Fig. 3
E-30 infection of HIBCPP cells enhances migration of effector T cells. Migration of Th1 effector and CVB4-specific T cells across HIBCPP cells was evaluated via immunofluorescence imaging in the following conditions: UI, UI + CXCL12, E-30 and E-30 + CXCL12. T cells were stained in cell tracker green. Immunofluorescence imaging (10 FOV per conditions) of Th1 (a) and CVB4-specific T cells (c) present in the bottom well was taken after 4 h of migration across HIBCPP cells for every condition. b, d Quantification of Th1 (b) and CVB4-specific T cells (d) present in the bottom well after 4 h of migration for all the conditions. The data are shown as mean ± SD of 6 independent experiments each performed in triplicate. Statistical significance was calculated using a Tukey–Kramer test. p values are displayed as follows: *p < 0.05 and *** p < 0.0001. *p < 0.05 was reached comparing UI to E-30; p < 0.0001 (***) was reached comparing UI to UI + CXCL12, and UI to E-30 + CXCL12; p < 0.0001 (###) was reached comparing E-30 against E-30 + CXCL12. The white scale bar represents 100 μm
Fig. 4
Fig. 4
Th1 and CVB4-specific T cells are retained at the basolateral side of HIBCPP cells after of migration. T cell association with HIBCPP cells after 4 h was analyzed by immunofluorescence microscopy. The following conditions were analyzed: UI, UI + CXCL12, E-30, E-30 + CXCL12. a shows representative images for CD3+, b for CD4+, c for CD8+, d for Th1, and e for CVB4-specific T cells. Per condition, 10 FOV were taken with X63/1.4 objective lens. T cells were stained in cell tracker green Alexa 488 and nucleus in blue (DAPI). f Quantification of the T cells associated to the basolateral side of HIBCPP cells after 4 h for the following conditions UI, UI + CXCL12, E-30, E-30 + CXCL12 and the following T cell subsets: CD3+, CD4+, CD8+, Th1, and CVB4-specific T cells are shown. Data are shown as mean ± SD of 6 independent experiments each performed in triplicate. Statistical significance was calculated using a Tukey–Kramer test. p values are displayed as follows: p < 0.0001 (****). p < 0.0001 (****) was reached comparing all the values for each condition from effector T cells and CVB4-specific T cells with the values for each condition from naïve T cells. The white scale bar represents 100 μm
Fig. 5
Fig. 5
Migration of T cells following E-30 has no impact on TEER of HIBCPP cells. Barrier integrity of HIBCPP cells was evaluated via measurement of the transepithelial resistance (TEER) at T = 0 h (white bars), T = 24 h (gray bars), and T = 28 h (black bars) for every condition uninfected control (UI), UI + CXCL12, E-30, E-30 + CXCL12 and for every cell type. a shows the result in the absence of T cells (= no T cells); b shows the results with CD3+ c with CD4+, d with CD8+, e with Th1 and f with CVB4-specific T cells. Data are shown as mean ± SD of 6 independent experiments each performed in triplicate. Statistical comparisons with p values are shown for T = 24 h and T = 28 h compared with the respective UI or UI and apical CXCL12 (=UI + CXCL12) at (T = 0 h). For statistical analysis, a Tukey–Kramer test was used; p values are displayed as follows: p < 0.0001 (***). *** p < 0.0001 was reached comparing the values to the respective control without E-30 infection
Fig. 6
Fig. 6
Migration of T cells following E-30 has no impact on the paracellular dextran flux of HIBCPP cells The paracellular flux of the low molecular weight molecule dextran-TexasRed (MW 1000) was measured at the end of the 4-h migration period. Quantification via fluorescent measurement for no T cells (a), CD3+ (b), CD4+ (c), CD8+ (d), Th1 (e), and for CVB4-specific T cells (f) was performed for each condition (UI, UI + CXCL12, E-30, E-30 + CXCL12). The data are shown as mean ± SD of 6 independent experiments each performed in triplicate. p values were obtained comparing the respective conditions in the absence or presence prior to E-30 infection, namely: UI and UI + CXCL12 versus E-30 and E-30 + CXCL12. Statistical significance was calculated using a Tukey–Kramer test. p values are displayed as follows: *p < 0.05 and *** p < 0.0001. *p < 0.05 and *** p < 0.0001 were reached comparing the values to the respective control without E-30 infection
Fig. 7
Fig. 7
Transcellular and paracellular migration of naive and effector T cells across HIBCPP cells. Immunofluorescence imaging of Th1 T cells performing migration via the transcellular pathway (a) and via the paracellular pathway (b) across HIBCPP cells in the following conditions: across HIBCPP cells in uninfected and infected with E-30. Images from left to right show T cells stained with cell tracker green (green 488), actin stained with phalloidin (purple 660), nuclei are stained with DAPI (blue 450), and E-30-infected HIBCPP cells are stained with an anti-PAN entero-antibody (red 594). Z-stacks were acquired using Zeiss Apotome and Zen software with X63/1.4 objective lens
Fig. 8
Fig. 8
Shape of T cells differs after the migration process depending on the stimulation condition. The shape of the T cells after the migration process from all the T cells subtypes CD3+, CD4+, CD8+, Th1 effector, and CVB4-specific T cells was determined in the following conditions: UI, UI + CXCL12, E-30, E-30 + CXCL12. T cells were labeled in green. The shape of migrated naïve T cells without CXCL12 could not be determined due to low migration rates in uninfected conditions. a Immunofluorescence microscopy pictures show “round” (first line) and “polarized” shape of T cells observed 4 h after migration across HIBCPP cells. Quantification of CD3+ (b), CD4+ (c), CD8+ (d), Th1 (e), or CVB4-specific T cells (f) with a “round” versus “polarized” shape after the migration process. The data are shown as mean ± SD of 6 independent experiments each performed in triplicate. Statistical significance was calculated using a Tukey–Kramer test. p values are displayed as follows: p < 0.05 (*), p < 0.0001 (***), p < 0.05 (#), p < 0.0001 (###). p < 0.0001 (***) were reached comparing UI + CXCL12 to E-30 for all the T cell subsets. p < 0.0001 (***) was also reached comparing UI + CXCL12 to E-30 + CXCL12 for CD8+, Th1 and CVB4-specific T cells. p < 0.05 (*) were reached comparing UI + CXCL12 to E-30 + CXCL12 for CD3+ and CD4+. p < 0.05 (#) was reached comparing E-30 against E-30 + CXCL12 for CD8+. p < 0.0001 (###) was reached comparing UI and UI + CXCL12 against E-30 and against E-30 + CXCL12, respectively, for Th1 and CVB4-specific T cells
Fig. 9
Fig. 9
Flow cytometry analyses of LFA-1 and CD49d of Th1 effector cells. LFA-1 and CD49d expression on the surface of Th1 cells was quantified via flow cytometry after 4 h of migration. The dot plots show representative result of the following conditions: a unstained Th1 cells, b Th1 not in contact with HIBCPP cells in uninfected condition (=Th1 UI CT), c Th1 present on the upper compartment of the well in uninfected condition (= UI non migrated Th1), d Th1 cells present on the bottom of the well in uninfected condition (= UI migrated Th1), e Th1 not in contact with HIBCPP cells in E-30-infected condition (= E-30 CT Th1), f Th1 present in the upper compartment of the well in E-30-infected condition (= E-30 non migrated Th1), g Th1 cells present on the bottom of the well in E-30-infected condition (= E-30 migrated Th1). Filters (n = 36 each) were pooled for each experiment and each condition. Representative data of four independent experiments are shown
Fig. 10
Fig. 10
Decreased expressions of CD44 and PSGL-1 on Th1 effector cells following migration across HIBCPP cells. Expression of the receptor CD44 and PSGL-1 present in the Th1 cells was quantified, via flow cytometry measurement after 4 h of migration. The dot plots show representative expression of CD44 and PSGL-1 on Th1 in different conditions: a unstained Th 1 cells, b Th1 not in contact with HIBCPP cells in uninfected condition (=Th1 CT UI), c Th1 present in the upper compartment of the well in uninfected condition (=Th1 non migrated UI), d Th1 cells present in the bottom of the well in uninfected condition (= Th1migrated UI), e Th1 not in contact with HIBCPP cells in E-30-infected condition (=Th1 CT E-30), f Th1 present in the upper compartment of the well in uninfected condition (=Th1 non migrated UI), g Th1 cells present on the bottom of the well in E-30-infected condition (= Th1 migrated E-30). Filters (n = 36 each) were pooled for each experiment and each condition. Representative data of four independent experiments are shown

Similar articles

Cited by

References

    1. Oberste MS, Maher K, Kennett ML, Campbell JJ, Carpenter MS, Schnurr D, Pallansch MA. Molecular epidemiology and genetic diversity of echovirus type 30 (E30): genotypes correlate with temporal dynamics of E30 isolation. J Clin Microbiol. 1999;37:3928–3933. - PMC - PubMed
    1. Holmes CW, Koo SS, Osman H, Wilson S, Xerry J, Gallimore CI, Allen DJ, Tang JW. Predominance of enterovirus B and echovirus 30 as cause of viral meningitis in a UK population. J Clin Virol. 2016;81:90–93. - PubMed
    1. Bouslama L, Gharbi J, Aouni M. Analysis of the genetic and the corresponding antigenic variability of the VP1 3′ end of ECHO virus type 11 and ECHO virus type 30. Virus Genes. 2006;33:205–212. - PubMed
    1. Kieslich M, Acconci D, Berger A, Jarisch A, Bohles H, Bollinger M, Jacobi G, Hernaiz Driever P. Diagnosis and outcome of neurotropic enterovirus infections in childhood. Klin Padiatr. 2002;214:327–331. - PubMed
    1. Huang HI, Shih SR. Neurotropic Enterovirus infections in the central nervous system. Viruses. 2015;7:6051–6066. - PMC - PubMed

MeSH terms