Clinical Trial
. 2019 Nov 21;7(1):314.
doi: 10.1186/s40425-019-0791-x.

Population pharmacokinetics, exposure-safety, and immunogenicity of atezolizumab in pediatric and young adult patients with cancer

Affiliations
Clinical Trial

Population pharmacokinetics, exposure-safety, and immunogenicity of atezolizumab in pediatric and young adult patients with cancer

Colby S Shemesh et al. J Immunother Cancer. .

Abstract

Background: The iMATRIX-atezolizumab study was a phase I/II, multicenter, open-label study designed to assess the safety and pharmacokinetics of atezolizumab in pediatric and young adult patients. We describe the pharmacokinetics (PK), exposure-safety, and immunogenicity of atezolizumab in pediatric and young adults with metastatic solid tumors or hematologic malignancies enrolled in this study.

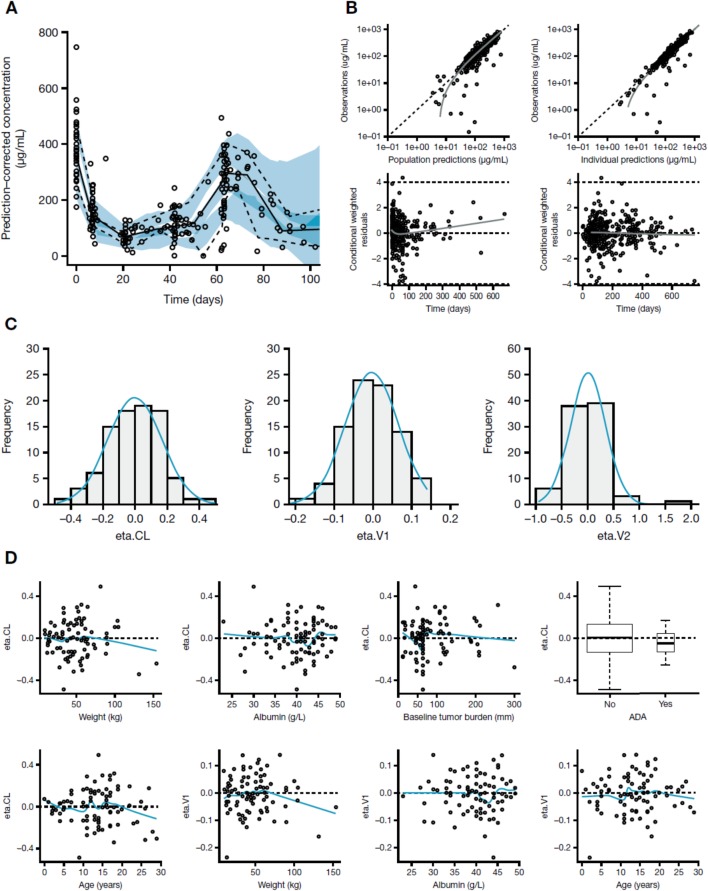
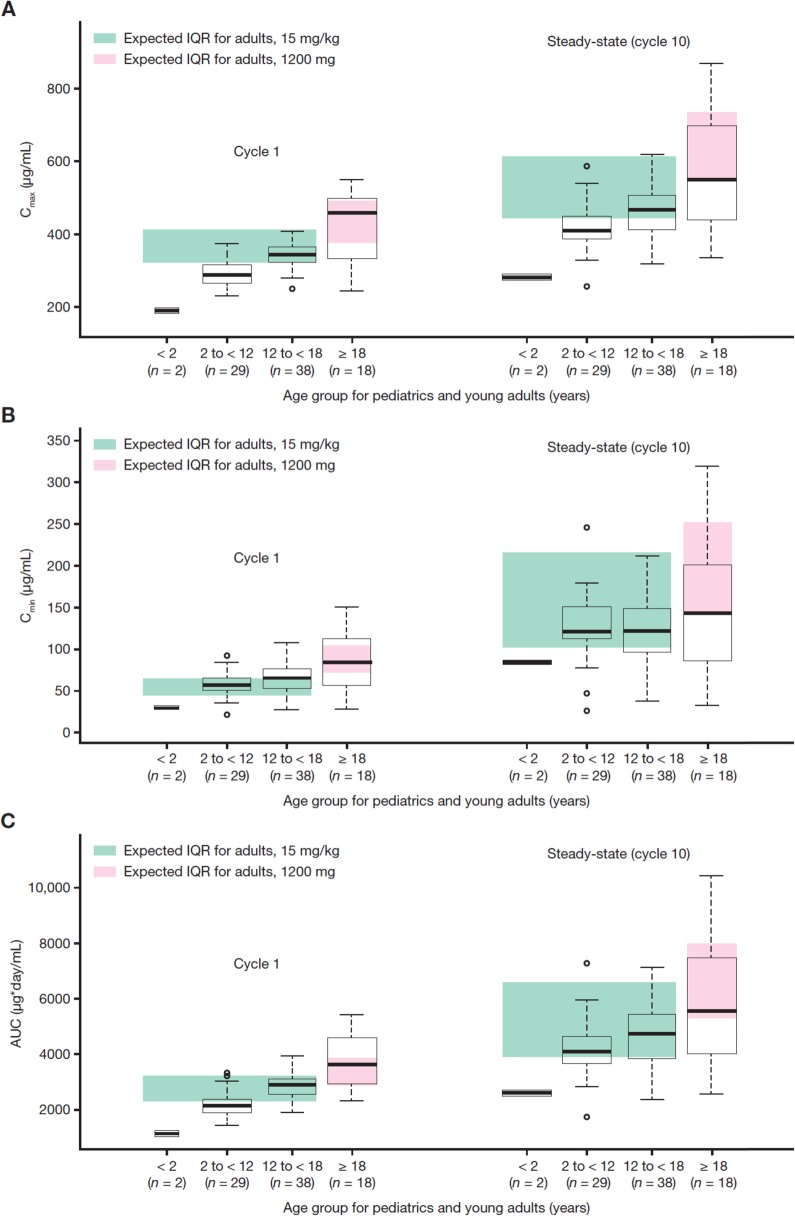
Methods: Patients aged < 18 years (n = 69) received a weight-adjusted dose of atezolizumab (15 mg/kg every 3 weeks [q3w]; maximum 1200 mg); those aged ≥ 18 years (n = 18) received a flat dose (1200 mg q3w). A prior two-compartment intravenous infusion input adult population-PK (popPK) model of atezolizumab was used as a basis to model pediatric data.

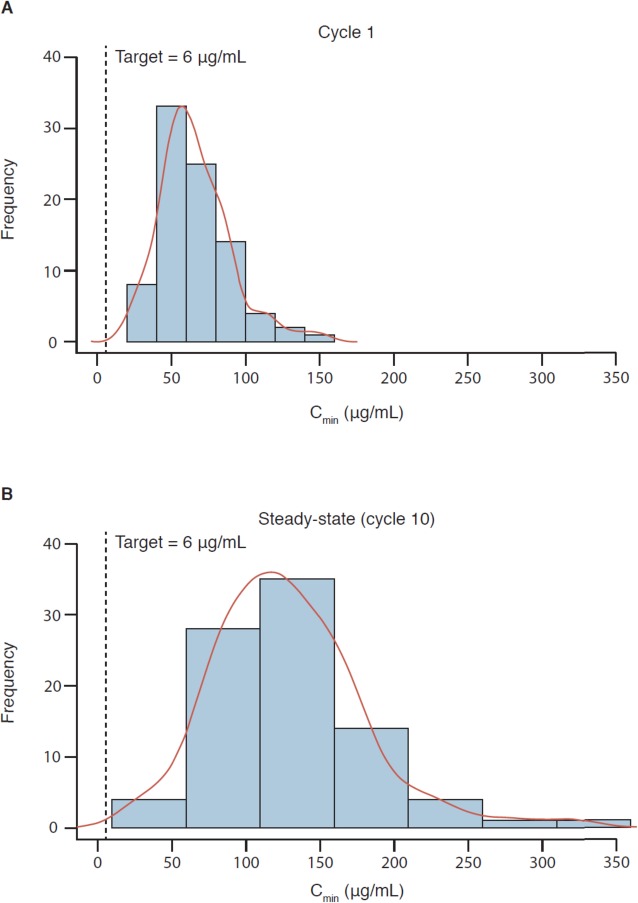
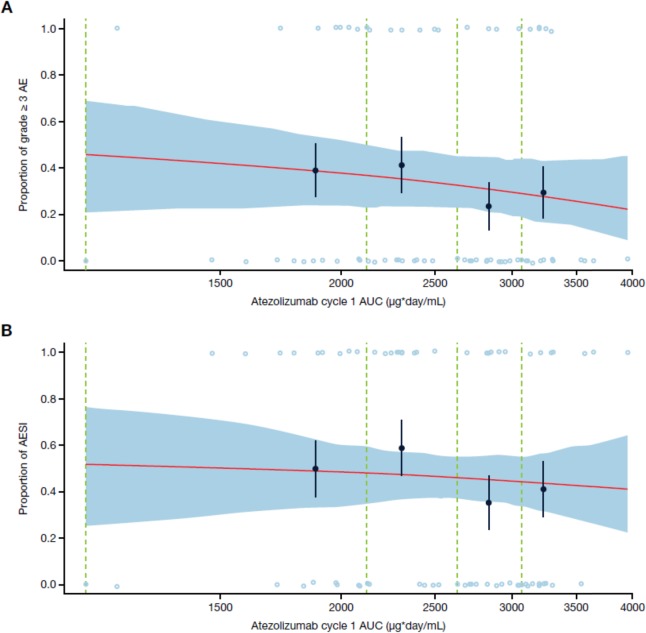
Results: A total of 431 atezolizumab serum concentrations from 87 relapse-refractory pediatric and young adult patients enrolled in the iMATRIX-atezolizumab study were used for the popPK analysis. The dataset comprised predominantly patients aged < 18 years, including two infants aged < 2 years, with a wide body weight and age range. The clearance and volume of distribution estimates of atezolizumab were 0.217 L/day and 3.01 L, respectively. Atezolizumab geometric mean trough exposures were ~ 20% lower in pediatric patients versus young adults; this was not clinically meaningful as both groups achieved the target concentration (6 μg/mL). Safety was similar between pediatric and young adult patients with no exposure-safety relationship observed. Limited responses (4/87) precluded an exposure-response assessment on outcomes. A comparable rate (13% vs 11%) of atezolizumab anti-drug antibodies was seen in pediatric and young adult patients.

Conclusions: These findings demonstrate a similar exposure-safety profile of atezolizumab in pediatric and young adult patients, supportive of weight-based dosing in pediatric patients.

Trial registration: NCT02541604.

Keywords: Atezolizumab; Cancer immunotherapy; Clinical pharmacology; Exposure-safety; Immune checkpoint inhibitor; Pediatric oncology; Population pharmacokinetics.


Conflict of interest statement

CSS, PC, GR, FD, JR, XW, RB, JJ, and SG are employees and stockholders of Genentech, Inc. and F. Hoffmann-La Roche Ltd. AG and HW were employed by Genentech at the time of these analyses. KJ and RW are employees of Certara and have provided consulting services for this study.

Figures

Fig. 1
Fig. 1
(a) Prediction-corrected visual predictive check, (b) goodness of fit diagnostic plots, (c) Eta distributions, and (d) random effect correlations to covariates. Prediction-corrected visual predictive check (a): the gray solid and dashed lines represent the observed median and the 10th and 90th percentiles, respectively, while the two shades of blue represent overlap between the empirical 95% prediction intervals. Goodness of fit diagnostic plots (b): the gray solid line indicates fitted values from a nonparametric smoother. Dashed lines indicate the line of unity (top plots), or zero lines and boundary lines for conditional weighted residuals (bottom). Eta distributions (c): the blue solid line represents a density curve. Random effect correlations to covariates (d): for continuous covariates, the blue solid line represents fitted values from a nonparametric smoother. The dashed line indicates the zero line, the box-plot indicates the median and interquartile range (25th to 75th percentile), the whiskers indicate 1.5 times the interquartile range. Abbreviations: ADA anti-drug antibody, CL clearance, V1 volume of the central compartment, V2 volume of the peripheral compartment
Fig. 2
Fig. 2
Cycle 1 and steady-state (cycle 10) exposure metrics by age group: (a) Cmax, (b) Cmin, and (c) AUC. Expected interquartile range (IQR) from simulated distributions (n = 1000) based on reported geometric means and %CVs. The box-plots indicate the median and IQR (25th to 75th percentile). The whiskers indicate 1.5 times the IQR. Abbreviations: AUC area under the curve, Cmin minimum concentration, Cmax maximum concentration
Fig. 3
Fig. 3
Post-hoc exposures at cycle 1 (a) and steady-state (cycle 10) (b). Exposures across 69 patients aged < 18 years (including two infants < 2 years, 29 children 2 to < 12 years, and 38 adolescents 12 to < 18 years) and 18 young adults aged 18 to < 29 years. The dotted line indicates the therapeutic target exposure of 6 μg/mL. The height of the bar represents the number of patients within that concentration range. A cumulative distribution trend (red line) is superimposed over the frequency distribution histogram. Abbreviation: Cmin minimum concentration
Fig. 4
Fig. 4
Incidence of grade ≥ 3 AEs (a) and any-grade AESI (b). AEs and AESI are displayed by open blue circles. Solid black circles with standard error bars (y-value: binned probability of having an event from observations; x-value: median exposure value within the bin). Red line: mean model fitted curve (obtained from averaging the fitted curve for each exposure record in the data set). Dashed green lines: binning boundaries. Exposure levels are binned based on the quantiles of the log transformed exposure variable levels. Blue shaded area: based on 100 bootstrap replicates, depicting the 90% confidence band for the mean model fitted curve. Plot is based on 69 patients. Abbreviations: AE adverse event, AESI adverse event of special interest, AUC area under the curve

References

    1. Wedekind MF, Denton NL, Chen CY, Cripe TP. Pediatric cancer immunotherapy: opportunities and challenges. Paediatr Drugs. 2018;20:395–408. doi: 10.1007/s40272-018-0297-x. - DOI - PMC - PubMed
    1. Tang J, Yu JX, Hubbard-Lucey VM, Neftelinov ST, Hodge JP, Lin Y. Trial watch: the clinical trial landscape for PD1/PDL1 immune checkpoint inhibitors. Nat Rev Drug Discov. 2018;17:854–855. doi: 10.1038/nrd.2018.210. - DOI - PubMed
    1. Kabir TF, Chauhan A, Anthony L, Hildebrandt GC. Immune checkpoint inhibitors in pediatric solid tumors: status in 2018. Ochsner J. 2018;18:370–376. doi: 10.31486/toj.18.0055. - DOI - PMC - PubMed
    1. Shebley M, Menon RM, Gibbs JP, Dave N, Kim SY, Marroum PJ. Accelerating drug development in pediatric oncology with the clinical pharmacology storehouse. J Clin Pharmacol. 2019;59:625–637. doi: 10.1002/jcph.1359. - DOI - PMC - PubMed
    1. Yanni S. Disposition and interaction of biotherapeutics in pediatric populations. Curr Drug Metab. 2012;13:882–900. doi: 10.2174/138920012802138624. - DOI - PubMed

Publication types

MeSH terms

Associated data

LinkOut - more resources