

Prevalence of Disability and Disability Types by Urban-Rural County Classification-U.S., 2016
- PMID: 31753256
- PMCID: PMC10939996
- DOI: 10.1016/j.amepre.2019.07.022
Prevalence of Disability and Disability Types by Urban-Rural County Classification-U.S., 2016
Abstract
Introduction: In the U.S., disability affects approximately 61.4 million (25.7%) adults, with mobility disability being the most prevalent type, affecting about 1 in 7 U.S. adults. However, little is known about the prevalence of disability and functional disability types by urbanization level.
Methods: Data from the 2016 Behavioral Risk Factor Surveillance System were analyzed. The prevalences of disability, overall and by functional disability type, were estimated among U.S. adults across 6 levels of urban-rural county categories based on the 2013 National Center for Health Statistics Urban-Rural Classification Scheme for Counties. Adjusted prevalence ratios with 95% CIs were estimated by conducting log-linear regression analyses with robust variance estimator while adjusting for study covariates. Data analyses were conducted in 2018.
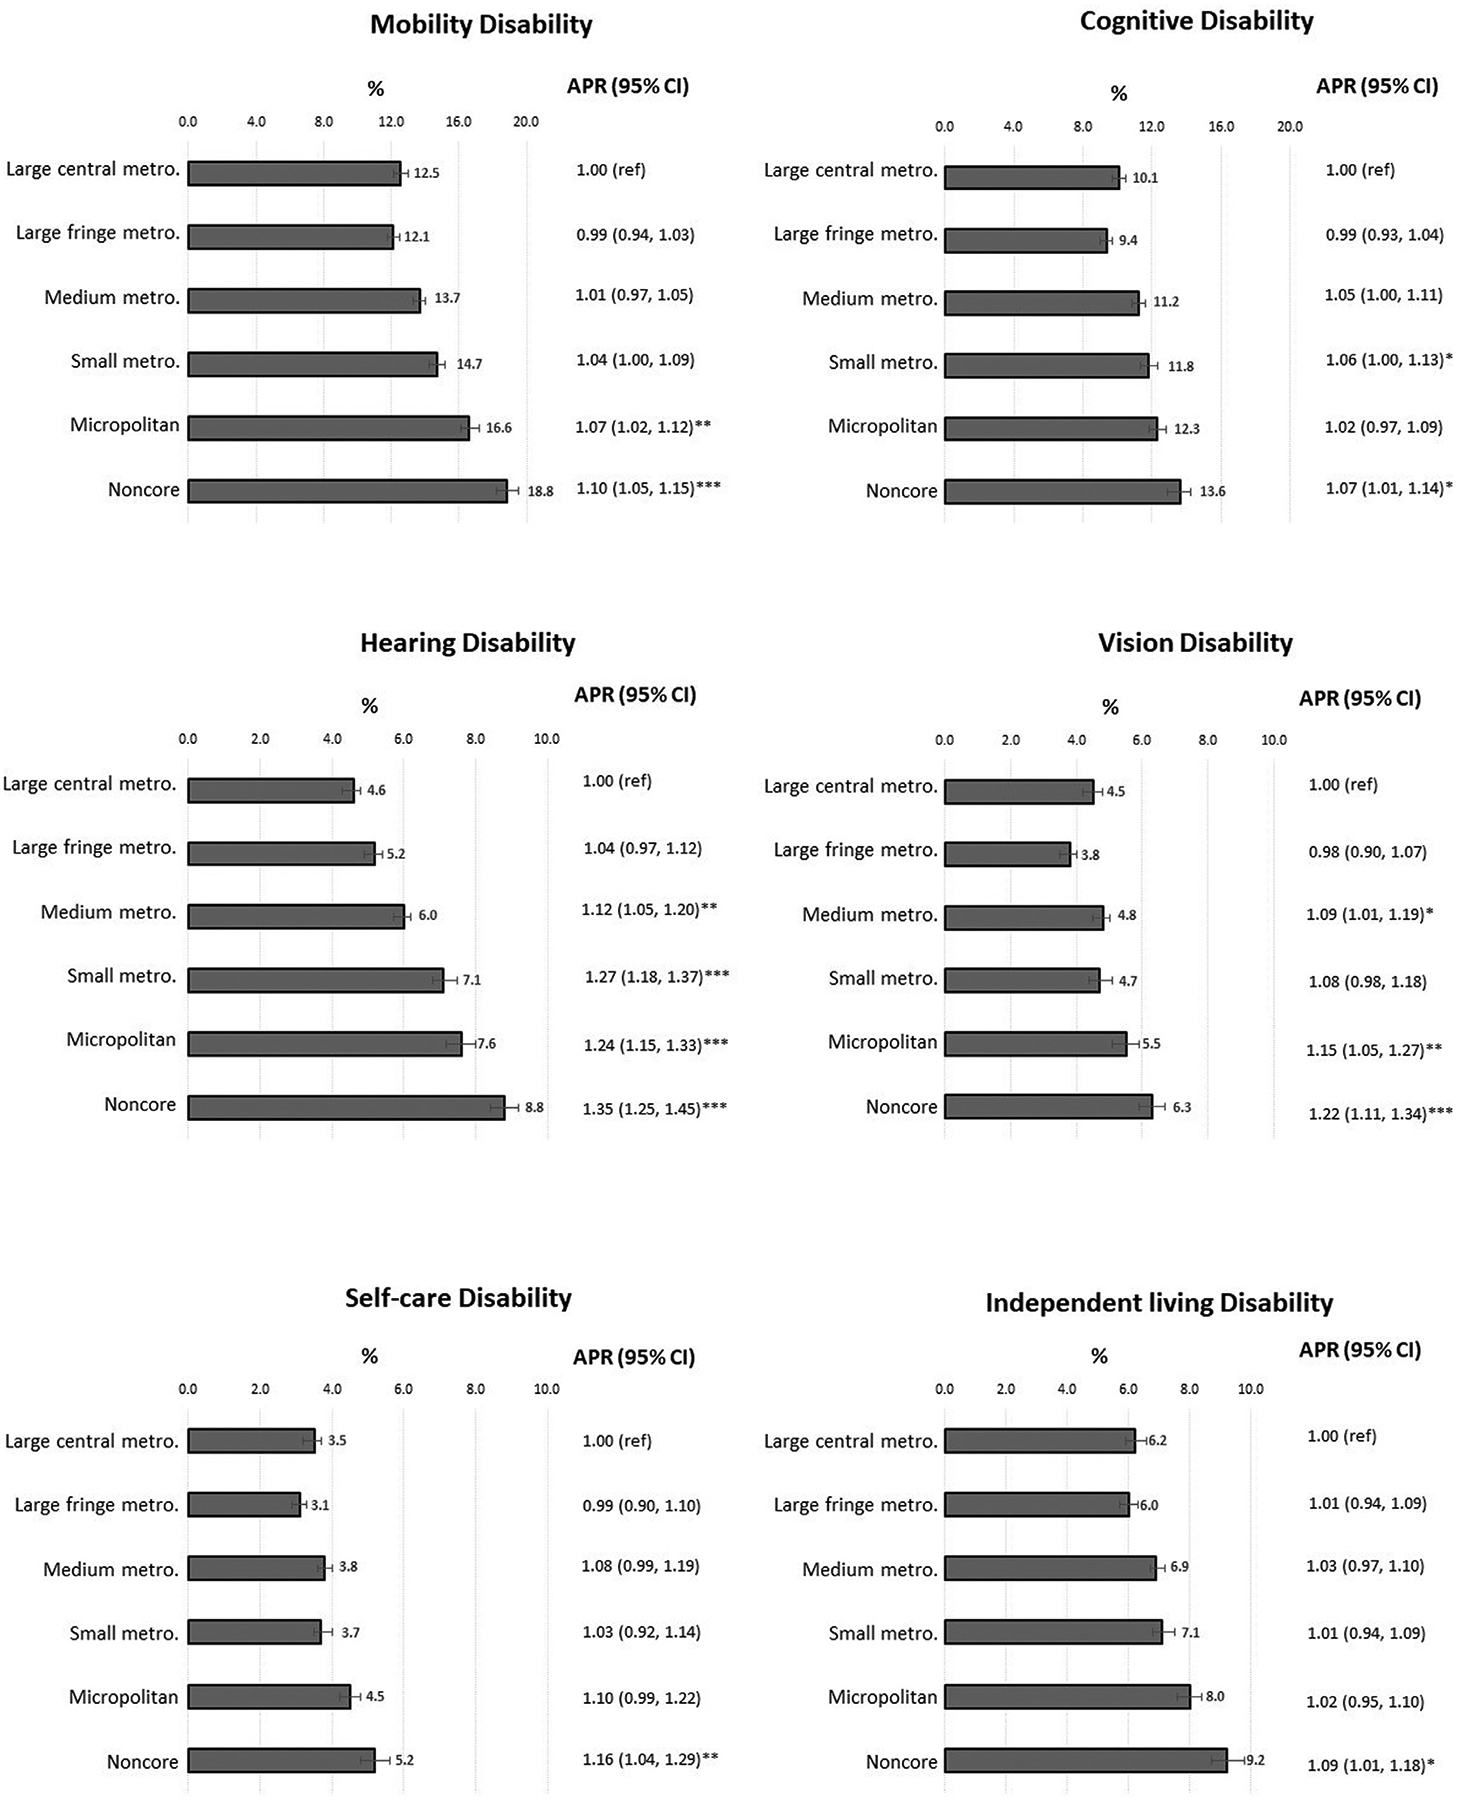
Results: The prevalences of having any disability, functional disability type, or multiple disabilities were lowest in large metropolitan centers and fringe metropolitan counties and highest in noncore (rural) counties. After controlling for age, sex, race/ethnicity, education, and federal poverty level, adults living in noncore counties were 9% more likely to report having any disability, 24% more likely to report having 3 or more disabilities, and 7% (cognition) to 35% (hearing) more likely to report specific disability types than the adults living in large metropolitan centers.
Conclusions: Results of this study suggest that significant disparities in the prevalence of disability exist by level of urbanization, with rural U.S. residents having the highest prevalence of disability. Public health interventions to reduce health disparities could include people with disabilities, particularly in rural counties.
Published by Elsevier Inc.
Figures

References
-
- Meit M, Knudson A, Gilbert T, et al. The 2014 Update of the Rural-Urban Chartbook. Bethesda, MD: Rural Health Reform Policy Research Center, 2014.
-
- Sage R, Ward B, Myers A, Ravesloot C. Transitory and enduring disability among urban and rural people. J Rural Health. In press. Online November 22, 2018. - PubMed
-
- von Reichert C, Greiman L, Myers A. University of Montana Rural Institute. The Geography of Disability in America: on Rural-Urban Differences in Impairment Rates Missoula, MT: University of Montana, 2014.
-
- Seekins T, Greiman L. University of Montana Rural Institute. Map Facts: Disability in Rural America (Rural Facts) Missoula, MT: University of Montana, 2014.
MeSH terms
Grants and funding
LinkOut - more resources
Full Text Sources
Medical
