. 2019 Dec:50:290-305.
doi: 10.1016/j.ebiom.2019.10.063. Epub 2019 Nov 18.

Pro-inflammatory monocyte profile in patients with major depressive disorder and suicide behaviour and how ketamine induces anti-inflammatory M2 macrophages by NMDAR and mTOR

Affiliations

Pro-inflammatory monocyte profile in patients with major depressive disorder and suicide behaviour and how ketamine induces anti-inflammatory M2 macrophages by NMDAR and mTOR

Wanda Nowak et al. EBioMedicine. 2019 Dec.

Abstract

Background: Depression is a highly prevalent disorder that is one of the leading causes of disability worldwide. Despite an unknown aetiology, evidence suggests that the innate and adaptive immune systems play a significant role in the development and maintenance of major depressive disorder (MDD). The non-competitive glutamatergic N-methyl-D-aspartate receptor (NMDAR) antagonist, (R,S)-ketamine (ketamine), has demonstrated rapid and robust efficacy as an antidepressant when administered at sub-anaesthetic doses.

Methods: Our goal was to characterize the pro-inflammatory profile of patients with MDD by measuring pro-inflammatory cytokines in plasma and circulating monocyte subsets and to understand how ketamine induces an anti-inflammatory program in monocyte and macrophages in vitro and vivo.

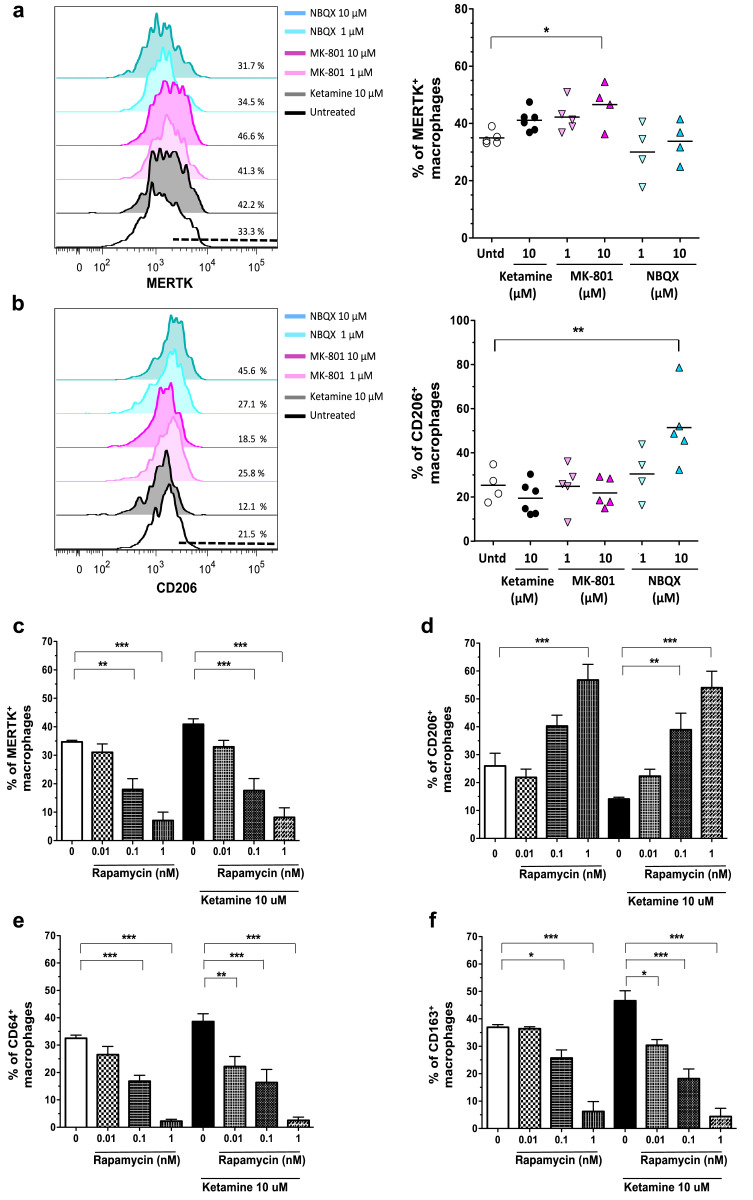
Finding: Our results show that patients with MDD without other comorbidities (N = 33) exhibited significantly higher levels of pro-inflammatory IL-12 and IL-6 in plasma and that these cytokines were associated with increased numbers of non-classical (CD11b+CD16brightCD14neg) monocytes and increased activation state (CD40+CD86+) of classical monocytes in circulation. Remarkably, we have demonstrated that sub-anaesthetic doses of ketamine programs human monocytes into M2c-like macrophages by inducing high levels of CD163 and MERTK with intermediate levels of CD64 and stimulating mTOR-associated gene expression in vitro. The NMDAR antagonist MK-801, but not the α-amino-3‑hydroxy-5-methyl-4-isoxazolepropionic acid receptor (AMPAR) antagonist, NBQX, also polarizes macrophages to an M2c-like phenotype, but this phenotype disappears upon mTOR pathway inhibition. Sub-anaesthetic doses (10 mg/kg) of ketamine administration in mice both promote reduction of circulating classical pro-inflammatory monocytes and increase of alternative M2 macrophage subtypes in the spleen and CNS.

Interpretation: Our results suggest an anti-inflammatory property of ketamine that can skew macrophages to an M2-like phenotype, highlighting potential therapeutic implications not only for patients with MDD but also other inflammatory-based diseases.

Funding: This study was supported by grants from the Consejo Nacional de Investigaciones Científicas y Técnicas (CONICET) and Agencia Nacional de Promoción Científica y Tecnológica (ANPCyT-FONCYT).

Keywords: Anti-inflammatory M2 macrophages; Depression; IL-12; Ketamine; NMDAR; Non-classical monocytes; mTOR pathway.


Conflict of interest statement

The authors have declared no potential conflicts of interest

Figures

Fig 1
Fig. 1
Increased plasma levels of IL-12 and IL-6 correlate with increased non-classical CD16brightCD14neg monocytes as well as with increased activation of classical CD16negCD14bright monocytes in patients with MDD and suicide behaviour. Plasma levels of (a) IL-12p70 and (b) IL-6 in patients with MDD (n=33) and healthy controls (n=20) as determined by ELISA. Significant differences between patients with MDD and healthy controls were calculated using a 2-tailed Mann-Whitney test (**p < 0.01). (c) Representative dot plots, after gating in mononuclear CD11b+ cells, showing the frequency of the three monocyte subsets based on CD14 vs. CD16 expression level in healthy controls and patients with MDD. Detailed gaiting strategy is shown in Supplementary Fig. S1. (d) The three monocytes subset are depicted as classical CD16negCD14bright (blue), non-classical CD16brightCD14neg (green) and intermediate CD16+CD14+ (red) for further analysis. Independent data are graphed in (e-g) showing decreased percentages of classical CD16negCD14bright monocytes alongside an increased percentage of non-classical CD16brightCD14neg monocytes in peripheral blood of patients with MDD. The frequency of the three subpopulations of monocytes from the cohort of patients with MDD was also segregated based on IL-6 and IL-12 plasma levels. The threshold for high cytokine level was set as the mean value plus 1 SD of control group. One-way ANOVA test was performed (**p < 0.01; ns p > 0.05). (h) and (i) Increased plasma levels of IL-12 and IL-6 were positively correlated with the percentage of non-classical monocytes in the peripheral blood of patients with MDD and healthy controls. Correlation was assessed by Spearman test. (j) Representative dot plots of CD86 and CD40 expression in classical monocyte subpopulations are shown. (k) Independent data showing percentage of CD86+CD40+ classical monocytes in healthy controls and patients with MDD and, further segregated by IL-12 and IL-6 plasma levels. (l) Increased percentage of non-classical monocytes was positively correlated with an increased percentage of CD86+CD40+ classical monocytes. One-way ANOVA test was performed (***p < 0.001). Correlation was assessed by Spearman test. (m) Representative dot plots showing the frequency of IL-12 positive cells after 5h of incubation with Golgi Stop and gating in CD11b+CD16negCD14bright subset. The Fluorescence Minus One (FMO) was used to set positive staining. (n) Independent data showing the percentage of Il-12 positive cells in a healthy control group (n=8) and patients with MDD (n=13) and, further segregated by IL-12 and IL-6 plasma levels. One-way ANOVA test was performed (**p < 0.01; *p < 0.05). Patients were segregated as follows: MDD IL-12/6, high levels of both cytokines; MDD IL-12, high levels of IL-12 only; MDD IL-6, patients high levels of IL-6 only; and MDD low, patients with similar levels of cytokines compared with healthy controls.
Fig 2
Fig. 2
Ketamine induces a M2c-like phenotype in monocyte-derived macrophages with increased levels of MERTK, CD163, and intermediate levels of CD64 while reducing the response to LPS. Monocyte-derived macrophages were differentiated for 7 days in the presence or absence of ketamine (0.1, 1 and 10 µM), and the percentage of (a) MERTK, (b) CD163, (c) CD206 and (d) CD64 positive CD11b+ macrophages was analysed by flow cytometry. Macrophage polarization controls were performed using dexamethasone (0.1 µM) for M2c, IL-4 (40 ng/mL) for M2a, and LPS (1 ng/mL) plus IFN-γ (50 ng/mL) for M1. Representative and independent data are shown. (e-i) To analyse the response to an inflammatory stimulus, ketamine-induced macrophages were stimulated for 24h with 1 ng/mL of LPS. The activation markers (e) CD80 and (f) HLADR were evaluated by flow cytometry and (g) TNF-α, (h) IL-6 and (i) IL-10 production was assessed by ELISA. Each dot represents an independent donor and pooled data were graphed. One-way ANOVA test was performed and statistical significance is denoted as *p < 0.05; **p < 0.01; ***p < 0.001. Untreated condition: Untd; dexamethasone: DEX.
Fig 3
Fig. 3
Ketamine up-regulates M2 gene profile including mTOR pathway related genes. Relative quantification of (a) CCL22, (b) TGM2, (c) IRF4, (d) IRF1, (e) CXCL10, (f) SGK1, (g) E1F4B and (h) FOXO1 was performed by qPCR. EEF1A1 housekeeping gene was used as reference and fold change was normalized to untreated macrophages. The ketamine-induced gene profile was compared with untreated macrophages while dexamethasone (0.1 µM), IL-4 (40 ng/mL), and LPS (1 ng/mL plus IFN-γ [50 ng/mL]) were used as macrophage polarization controls. Each condition was performed with cells from at least 5 independent donors. One-way ANOVA test was performed to compare ketamine conditions to untreated macrophages and statistical significance is denoted as *p < 0.05; **p < 0.01; ***p < 0.001. Untreated condition: Untd; dexamethasone: DEX.
Fig 4
Fig. 4
NMDAR antagonist MK-801, but not the AMPAR antagonist NBQX, induces a similar M2 profile as ketamine, and this phenotype is completely abolished by the inhibition of the mTOR pathway. Monocyte-derived macrophages were differentiated for 7 days in the presence or absence of the NMDAR antagonist MK-801 (1 and 10 µM) or AMPAR antagonist NBQX (1 and 10 µM), and the percentage of (a) MERTK and (b) CD206 was analysed for M2 polarization by flow cytometry. Representative histograms and independent data are shown. Rapamycin (0.01–1 nM), added from day 0, was used to evaluate the role of the mTOR pathway in macrophage polarization after 7 days of culture. Viable CD11b+ cells were analysed for the expression of (c) MERTK, (d) CD206, (e) CD64, and (f) CD163. Each experimental condition includes at least 4 independent donors. Pooled data were graphed and one-way ANOVA test was performed accordingly. Statistical significance is denoted as *p < 0.05; **p < 0.01; ***p < 0.001.
Fig 5
Fig. 5
Injection of sub-anaesthetic doses of ketamine modulates circulating myeloid compartment and promotes the differentiation of anti-inflammatory M2 macrophages in vivo. 72 hours after the intraperitoneal injection of sub-anaesthetic doses of ketamine (10 mg/kg) or saline solution, peripheral blood cells, bone marrow, spleen and total leukocytes from CNS were analysed. Peripheral circulating monocytes were analysed by gating on CD11b+Ly6C+Ly6G by flow cytometry. Ketamine administration significantly reduces (a) the inflammatory Ly6Chigh monocytes and increases (b) the Ly6Clow monocyte fraction. (c) The absolute number of bone marrow cells as well as (d) the total number of splenocytes was significantly increased 72 hours after the administration of sub-anaesthetic doses of ketamine compared with control mice. (e) The percentage of tissue resident CD45lowCD11b+ cells in the CNS was similar between groups, but (f) the percentage of hematopoietic CD45highCD11b+F4/80+macrophages was significantly reduced in CNS tissue from ketamine-treated mice. Furthermore, (g) the percentage of Arginase-1+ macrophages (CD45highCD11b+F4/80+) was significantly increased in the CNS and (h) spleens of ketamine-treated mice. (i) and (j) BMDM from ketamine-treated or control mice, were differentiated for 7 days in the presence of M-CSF. These BMDMs were harvested and then challenged with 100 ng/ml of LPS for 24 hours. The percentage of (i) CD86+CD206 cells and (j) the mean fluorescence intensity (MFI) of CD36+ pro-inflammatory markers were significantly reduced in BMDM obtained from ketamine-treated mice. (k) The percentage of CD206+CD86 macrophages was significantly increased in ketamine-treated compared with untreated mice. In-vivo experiments were performed with at least 4–5 mice per each condition, and repeated twice. Pooled data were graphed and statistical significance is denoted as *p < 0.05; **p < 0.01; ***p < 0.001. Student's t test or one-way ANOVA test were performed accordingly.

References

    1. Marcus M, Yasamy M, van Ommeren M, Chisholm D, Saxena S. Depression: a global public health concern. [Internet]. 2012 [cited 2016 Agost 25th].
    1. Global, regional, and national incidence, prevalence, and years lived with disability for 301 acute and chronic diseases and injuries in 188 countries, 1990-2013: a systematic analysis for the global burden of disease study 2013. Lancet. 2015;386(9995):743–800. - PMC - PubMed
    1. Miller A.H., Raison C.L. The role of inflammation in depression: from evolutionary imperative to modern treatment target. Nat Rev Immunol. 2016;16(1):22–34. - PMC - PubMed
    1. Miller A.H., Maletic V., Raison C.L. Inflammation and its discontents: the role of cytokines in the pathophysiology of major depression. Biol Psychiatry. 2009;65(9):732–741. - PMC - PubMed
    1. Berk M., Williams L.J., Jacka F.N., O'Neil A., Pasco J.A., Moylan S. So depression is an inflammatory disease, but where does the inflammation come from? BMC Med. 2013;11:200. - PMC - PubMed

MeSH terms