. 2020 Feb 3;217(2):e20191130.
doi: 10.1084/jem.20191130.

Single-cell transcriptome analysis reveals differential nutrient absorption functions in human intestine

Affiliations

Single-cell transcriptome analysis reveals differential nutrient absorption functions in human intestine

Yalong Wang et al. J Exp Med. .

Abstract

The intestine plays an important role in nutrient digestion and absorption, microbe defense, and hormone secretion. Although major cell types have been identified in the mouse intestinal epithelium, cell type-specific markers and functional assignments are largely unavailable for human intestine. Here, our single-cell RNA-seq analyses of 14,537 epithelial cells from human ileum, colon, and rectum reveal different nutrient absorption preferences in the small and large intestine, suggest the existence of Paneth-like cells in the large intestine, and identify potential new marker genes for human transient-amplifying cells and goblet cells. We have validated some of these insights by quantitative PCR, immunofluorescence, and functional analyses. Furthermore, we show both common and differential features of the cellular landscapes between the human and mouse ilea. Therefore, our data provide the basis for detailed characterization of human intestine cell constitution and functions, which would be helpful for a better understanding of human intestine disorders, such as inflammatory bowel disease and intestinal tumorigenesis.


Figures

None
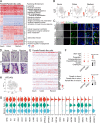
Graphical abstract
Figure S1.
Figure S1.
General information of clinical samples and annotations of cell types of single-cell RNA-seq data. (A) Clinical information of intestine tissue donors. Normal epithelial tissues were obtained from the patients diagnosed with gastrointestinal cancer. Ileum-2 and colon-2 were from the same patient. (B) Statistics of the six single-cell RNA-seq datasets after quality filters. (C and D) Numbers of detected gene (C) and total UMI counts (D) were color coded for each single cell from the three segments. (E) Cell types annotated for all 14,537 single cells from the ileum, colon, and rectum. (F) Cells from the two replicates of each segment were marked on the t-SNE plots. EC, enterocytes; EEC, enteroendocrine cells; G, goblet cells; PRO, progenitor cells; SC, stem cells; TU, tuft cells.
Figure 1.
Figure 1.
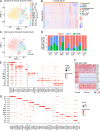
Cell landscapes of human intestines based on single-cell transcriptome profiles. (A, C, E, and G) t-SNE plots of single-cell clusters. The Seurat algorithm was used to visualize the clustering of all 14,537 intestine epithelial cells from six donors (A), 6,167 ileum cells from two donors (C), 4,472 colon cells from two donors (E), and 3,898 rectum cells from two donors (G). (B, D, F, and H) Expression heatmaps of cell type–specific genes were obtained by analyzing all cells pooled together (B) or based on cells from one of the three intestine segments: ileum (D), colon (F), and rectum (H). EC, enterocytes; EEC, enteroendocrine cells; G, goblet cells; PRO, progenitor cells; SC, stem cells.
Figure S2.
Figure S2.
Expression patterns of cell markers. (A and B) The mean expression levels of markers of different cell types in all 14,537 cells (A) and 6,167 ileum cells, 4,472 colon cells, and 3,898 rectum cells (B). (C) Mean expression levels of the tuft marker genes Pou2F3, GFI1B, and TRPM5 in all 14,537 cells. (D) Percentage of each cell type, annotated by graph clustering shown in Fig. 1 A, in ileum, colon, and rectum cells.
Figure S3.
Figure S3.
Characterization of stem cells, TA cells, and progenitor cells and transcription factor analysis. (A) Signature genes of stem cells and the gene functional enrichments. (B) Signature genes of TA cells and the gene functional enrichments. (C) Cell cycle analysis. The calculated cell cycle phase of each cell was shown for all 14,537 cells, 6,167 ileum cells, 4,472 colon cells, or 3,898 rectum cells. (D) Signature genes of progenitor cells and the gene functional enrichments. (E) Differentiation- and proliferation-related factors in the progenitor cells in human ileum, colon, and rectum. (F) Differential expression analysis of transcription factors in human epithelial cells. EC, enterocytes; EEC, enteroendocrine cells; G, goblet cells; PRO, progenitor cells; SC, stem cells.
Figure 2.
Figure 2.
Differential nutrient absorption preferences in the human small and large intestine. (A) Expression heatmap of signature genes in enterocytes and gene functional enrichments. (B) Violin plots showing distributions of mean expression of transporter genes in different segments (il, ileum; co, colon; re, rectum). (C) Expression patterns of specific genes involved in nutrient absorption and transport in different intestine segments. Each dot represents a gene, of which the color saturation indicates the average expression level (scaled by Z-score) in an intestine segment, and the size indicates the percentage of cells expressing the gene. (D) Relative mRNA expression of the gene marked in red in C was confirmed by qPCR in the organoids derived from human ileum, colon, and rectum. (E) Nutrient uptake was measured by LC-MS in the organoids derived from human ileum, colon, and rectum. Data are represented as mean ± SD of at least three independent experiments. All statistically significant differences were calculated using an ordinary two-way ANOVA followed by Tukey’s multiple comparisons test; *, P < 0.05; **, P < 0.01; ***, P < 0.001.
Figure S4.
Figure S4.
Expression patterns of transporter genes and validation by immunofluorescence or immunohistochemistry. (A) Expression patterns of eight selected transporter genes in different intestine segments. Each dot represents a gene, of which the color saturation indicates the average expression level (scaled by Z-score) in an intestine segment and the size indicates the percentage of cells expressing the gene. (B, C, and E–G) Immunofluorescence was performed to confirm the expression of APOB (B) and FABP6 (D) in the ileum and SLC38A1 (E), SLC26A2 (F), and SLC44A1 (G) in the colon and rectum. (C, H, and I) Immunohistochemistry was performed to confirm the expression of APOA4 in the ileum (C) and SCNN1B (H) and SLC35A1 (I) in the colon and rectum. Scale bars, 100 μm.
Figure 3.
Figure 3.
Differential expression of signaling molecules, hormones, and immunity-related genes. (A) Violin plots showing expression distributions of signaling genes in enterocytes from the ileum (il), colon (co), and rectum (re). (B) Expression heatmap of signature genes in enteroendocrine cells. (C) Expression patterns of specific hormone genes in enteroendocrine cells from different intestine segments. (D) Expression patterns of immune-related genes in cells from different intestine segments and gene functional enrichments. Each dot represents a gene, of which the color saturation indicates the average expression level (scaled by Z-score) in an intestine segment and the size indicates the percentage of cells expressing the gene.
Figure 4.
Figure 4.
PLCs identified in the human colon and rectum. (A) Expression heatmap of signature genes in PLCs and gene functional enrichments. (B) Lysozyme (LYZ) expression (indicated by color saturation) in single cells from the ileum, colon, and rectum. (C) Immunofluorescence was performed to confirm LYZ expression in the ileum, colon and rectum. Scale bars, 100 µm. (D) smFISH results of LYZ in human ileum, colon, and rectum. Scale bar, 100 µm. (E) mRNA expression levels of growth factors in PCs and PLCs in the ileum and PLCs in the colon and rectum. (F) Specific expression of GNPTAB and SOD3 in PCs and PLCs of the human large intestine. (G) Violin plots showing expression distributions of transcription factors in PCs or PLCs. (H) Kit expression in all 14,537 cells.
Figure 5.
Figure 5.
Potential new markers of human TA cells and goblet cells. (A) NUSAP1 expression (indicated by color saturation) in single cells from the ileum, colon, and rectum. (B) Immunofluorescence was performed to confirm the NUSAP1 expression in the ileum, colon, and rectum. Scale bars, 100 µm. (C) Statistics of the NUSAP1 immunofluorescence data shown in B. The proportion of KI67+/NUSAP1+ cells and NUSAP1+/ KI67+ cells were quantified. Data are represented as mean ± SD of n = 17. (D) Expression heatmap of signature genes in goblet cells and gene functional enrichments. (E) ITLN1 expression (indicated by color saturation) in single cells from the ileum, colon, and rectum. (F) Immunofluorescence was performed to confirm ITLN1 expression. Scale bars, 100 µm. (G) TFF1 expression (indicated by color saturation) in single cells from the ileum, colon, and rectum. (H) Immunofluorescence was performed to confirm the TFF1 expression. Scale bars, 100 µm.
Figure S5.
Figure S5.
Specific expression of NUSAP1+ cells in TA cells and Itln1 and Tff1 in mouse intestine. (A) Expression levels of KI67 in human ileum, colon, and rectum. (B) Distribution density of TA cells according to their NUSAP1 and KI67 expression. (C) GO analysis of signature genes in NUSAP1+ cells. (D) Expression levels of PCNA and LGR5 in in human ileum, colon, and rectum. (E) Immunofluorescence of Nusap1 location in Lgr5-GFP mouse intestine. Scale bars, 100 μm. (F) mRNA expression of ITLN1 in human ileum, colon, and rectum as shown by smFISH. Scale bar, 100 μm. (G) Expression of Itln1 in mouse ileal PCs as shown by immunofluorescence. Scale bars, 100 μm. (H) Distribution density of goblet cells according to their TFF1 and TFF3 expression. (I) No expression of Tff1 in mouse ileum as shown by immunofluorescence. Scale bars, 100 μm. (J) GO analysis of signature genes in TFF1+ goblet cells. (K) Representative signature genes in TFF1+ goblet cells.
Figure 6.
Figure 6.
Comparison of gene expression profiles between the epithelial cells of the human and mouse ilea. (A) Unsupervised graph-based clustering of single cells from human (n = 6,187) and mouse ileum (n = 3,927) based on their gene expression profiles. (B) Similarity matrix showing the Pearson correlations between each pair of single cells from human (n = 6,187) and mouse ileum (n = 3,927) based on their gene expression profiles. (C) Cell cycle analysis. The calculated cell cycle phase of each cell is shown for all 10,114 ileal cells. (D) Cell cycle quantity of human and mouse ileal cells. (E) Conserved signature genes of each cluster in human and mouse ilea. (F) Signature genes of human and mouse ileal stem cells. (G) Human- or mouse-specific signature genes of each cell type in the ilea. Each dot represents a gene, of which the color saturation indicates the average expression level (scaled by Z-score) in a specific cell type, and the size indicates the percentage of cells expressing the gene. EC, enterocytes; EEC, enteroendocrine cells; G, goblet cells; H, humans; M, mice; PRO, progenitor cells; SC, stem cells; TU, tuft cells.

Comment in

  • Atlas of the human intestine.
    He XC, Li L. He XC, et al. J Exp Med. 2020 Feb 3;217(2):e20191997. doi: 10.1084/jem.20191997. J Exp Med. 2020. PMID: 31922531 Free PMC article.

References

    1. Aihara E., Engevik K.A., and Montrose M.H.. 2017. Trefoil Factor Peptides and Gastrointestinal Function. Annu. Rev. Physiol. 79:357–380. 10.1146/annurev-physiol-021115-105447 - DOI - PMC - PubMed
    1. Arora K., Sequeira J.M., and Quadros E.V.. 2017. Maternofetal transport of vitamin B12: role of TCblR/CD320 and megalin. FASEB J. 31:3098–3106. 10.1096/fj.201700025R - DOI - PMC - PubMed
    1. Bogdan A.R., Miyazawa M., Hashimoto K., and Tsuji Y.. 2016. Regulators of Iron Homeostasis: New Players in Metabolism, Cell Death, and Disease. Trends Biochem. Sci. 41:274–286. 10.1016/j.tibs.2015.11.012 - DOI - PMC - PubMed
    1. Buettner F., Natarajan K.N., Casale F.P., Proserpio V., Scialdone A., Theis F.J., Teichmann S.A., Marioni J.C., and Stegle O.. 2015. Computational analysis of cell-to-cell heterogeneity in single-cell RNA-sequencing data reveals hidden subpopulations of cells. Nat. Biotechnol. 33:155–160. 10.1038/nbt.3102 - DOI - PubMed
    1. Butler A., Hoffman P., Smibert P., Papalexi E., and Satija R.. 2018. Integrating single-cell transcriptomic data across different conditions, technologies, and species. Nat. Biotechnol. 36:411–420. 10.1038/nbt.4096 - DOI - PMC - PubMed

Publication types