

doi: 10.3324/haematol.2019.229211.
Epub 2019 Nov 21.
Comparing the two leading erythroid lines BEL-A and HUDEP-2
Affiliations
- PMID: 31753923
- PMCID: PMC7395286
- DOI: 10.3324/haematol.2019.229211
Item in Clipboard
Comparing the two leading erythroid lines BEL-A and HUDEP-2
Haematologica.
2020 Aug.
Free PMC article
Erratum in
-
Erratum to: Comparing the two leading erythroid lines BEL-A and HUDEP-2.Haematologica. 2024 Jan 1;109(1):364. doi: 10.3324/haematol.2023.284510. Haematologica. 2024. PMID: 38186343 Free PMC article. No abstract available.
No abstract available
Figures

Improved erythroid differentiation of HUDEP-2 in Bristol erythroid culture system, and comparison of BEL-A and HUDEP-2 differentiation. (A) Schematic of approaches for establishing the BEL-A and HUDEP-2 cell lines., Erythroid 1° medium consists of IMDM with 3% human AB serum, 2% fetal bovine serum, insulin, heparin, holo-transferrin, SCF, IL-3 and EPO. SS: Stemspan™ SFEM; SCF: stem cell factor; IL-3: interleukin-3; EPO: erythropoietin; DEX: dexamethasone; DOX: doxycycline. (B) Cumulative fold expansion (i), % enucleation per total live cells (ii) and reticulocyte yield (iii) of BEL-A and HUDEP-2 in Bristol differentiation media and HUDEP-2 in EDM media. Live cell numbers were determined by trypan blue exclusion assay. Enucleation rates were calculated from cytospin counts (≥200 cells per slide). Reticulocyte yield was calculated by multiplying % enucleation by cumulative fold expansion for each time point. Results are mean ± standard deviation (SD) from at least three independent experiments. */♦P<O.05, **/♦♦P<0.01, ***/♦♦♦P<0.001, ****/♦♦♦♦P<0.0001 two-tailed Student t-test comparing HUDEP-2 in Bristol with HUDEP-2 in EDM media (♦), or BEL-A with HUDEP-2 in Bristol media (*). (C) Percentage of erythroid cell types present at day 0, 4, 6, 8 and 12 of differentiation for BEL-A and HUDEP-2 in Bristol differentiation media, and HUDEP-2 in EDM media. Cells were stained with Leishman’s and ≥200 cells counted per cytospin. Data show mean ± SD, n=3, and (D) representative images from cytospins of these cultures. Scale bar =20 μm. Arrow heads represent the following cell types: white, proerythroblast; blue, basophilic normoblasts; orange, polychromatic normoblasts; black, orthochromatic normoblasts; red, reticulocytes. (E) Relative proportion of erythroid cell types present at day 8 and 12 of differentiation for BEL-A and HUDEP-2 in Bristol differentiation media, and HUDEP-2 in EDM media, presented as extrapolated cell number. (F) Flow cytometry analysis of cell surface marker expression of BEL-A and HUDEP-2 in Bristol differentiation media. Cells were dual stained with anti-CD36 or anti-α4-integrin FITC conjugates (both Miltenyi Biotec) and anti-band 3 (BRIC71) or anti-glycophorin A (GPA) (BRIC256) primary antibodies (both IBGRL, Filton) used in conjunction with an IgG1 APC secondary (Biolegend). (G) Cell surface expression of band 3, α4-integrin, GPA and CD36 of BEL-A and HUDEP-2 nucleated cells (as determined by Hoechst staining) during erythroid differentiation, presented as median fluorescence intensity (MFI). Data show mean ± SD, n=4. (H) Cell surface expression of α4-integrin, CD36 and CD71 of BEL-A and HUDEP-2 orthochromatic normoblasts at day 11 of erythroid culture, presented as median fluorescence intensity (MFI). Data show mean ± SD, n=4.
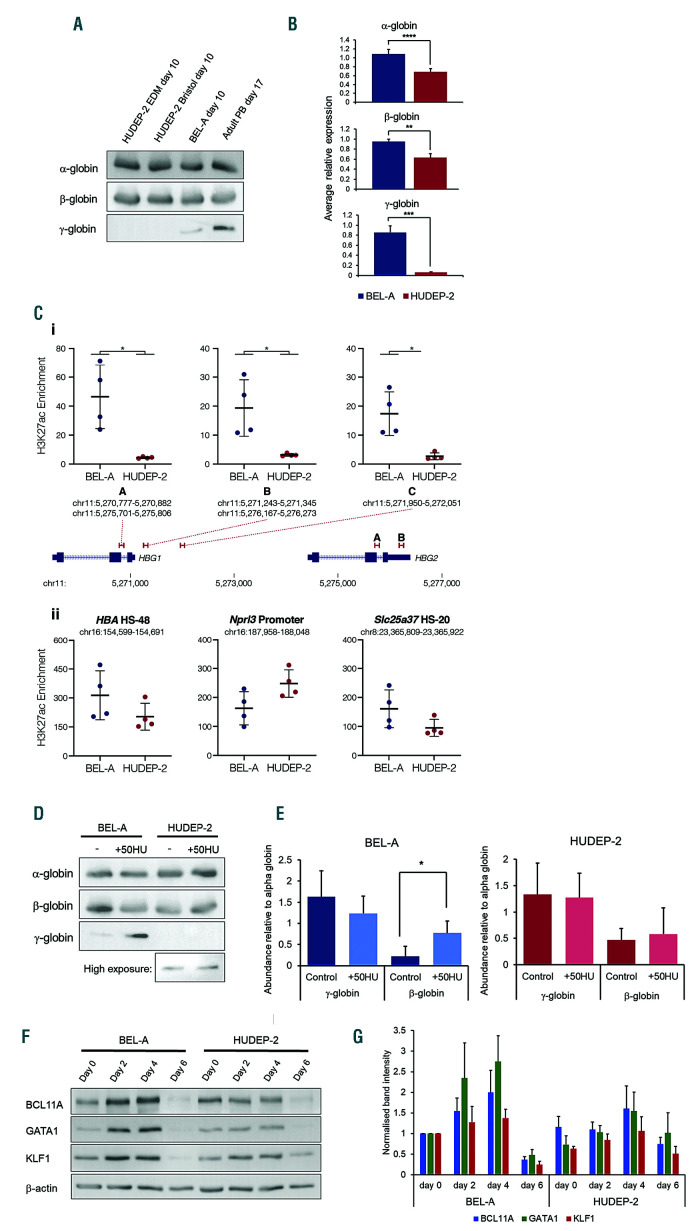
Globin subunit expression by BEL-A and HUDEP-2. (A). Western blots of lysates obtained from late stage (day 10) HUDEP-2 in EDM media, HUDEP-2 and BEL-A in Bristol media and adult peripheral blood (PB; day 17) erythroid cells incubated with antibodies to α-, β- and γ-globin (sc-514378; sc-21757; sc-21756; all Santa Cruz). (B) Analysis of α-, β- and γ-globin mRNA levels in BEL-A and HUDEP-2 in Bristol media on day 6 of culture by quantitative PCR (qPCR). Target gene expression was normalised to PABPC1 reference gene (using the 2-DDCt method) and compared to a BEL-A control sample. Results are means ± standard deviation (SD), n=4. TaqMan gene expression assays used were: HBA (Hs00361191_g1), HBB (Hs00747223_g1), HBG (Hs00361131_g1) and PABPC1 (Hs00743792_s1) (Fisher Scientific). (C) H3K27ac chromatin immunoprecipitation (ChIP) was carried out in 5×10⁶ day 4 cells by fixing in 1% formaldehyde and performing immunoprecipitation (IP) with the ChIP Assay Kit (Merck Millipore) using 0.3 mg anti-H3K27ac (ab4729; Abcam). Enrichment at the HBG1/2 promoters (i) and control regions (ii) was determined using qPCR by comparing to a background control (hg19, chr16:6,002,736-6,002,834). Bars depict mean and standard deviation for IP from four separate differentiations (circles). *Mann-Whitney rank sum P=0.0286 (D-E) Response of BEL-A and HUDEP-2 cells to hydroxyurea treatment. Hydroxyurea (H8627; Sigma) was added to cells at 50 μM every two days from four days prior to the start of differentiation until harvesting of cells on day 10 of differentiation. (D) Representative Western blot of cell lysates from ± hydroxyurea (HU) cultures incubated with antibodies to α-, β- and γ-globin and (E) densitometric analysis of the bands obtained from at least three independent experiments normalised to α-globin expression (means ± SD). *P<0.05 two-tailed Student t-test. (F-G) Expression of BCL11A, GATA1 and KLF1 by BEL-A and HUDEP-2. β-actin was used as a protein loading control. (F) Representative western blots of lysates obtained from cells at day 0, 2, 4 and 6 of BEL-A and HUDEP-2 cultures incubated with BCL11A (ab19487; Abcam), GATA1 (sc-266; Santa Cruz), KLF1 (sc-14034; Santa Cruz) and β-actin (A1978; Sigma) antibodies, and (G) densitometric analysis of the bands obtained from two independent experiments normalised to β-actin expression and then compared to BEL-A day 0 (means ± SD).
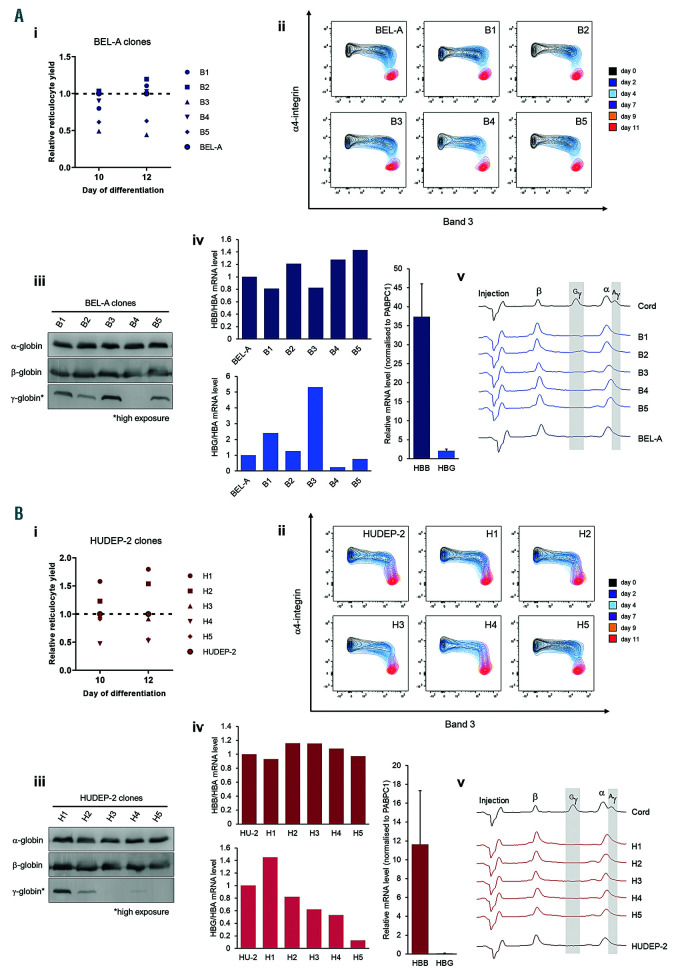
Analysis of clonal variability in the BEL-A and HUDEP-2 cell lines. To generate clonal sub-populations of BEL-A and HUDEP-2 a BD FACSAria Cell Sorter was used to isolate single cells from the propidium iodide-negative population into 96-well plates. Single-cell clones were cultured for seven days before selecting five derived from each line at random for further characterisation (B1-B5 and H1-H5 from BEL-A [A] and HUDEP-2 [B] respectively). (i) Reticulocyte yield of BEL-A and HUDEP-2 clones compared to the respective unsorted cell line. (ii) Flow cytometry analysis of band 3 and α4-integrin expression during differentiation of BEL-A and HUDEP-2 cell lines and clonal populations. (iii-v) Globin subunit expression of BEL-A and HUDEP-2 clones. (iii) Western blots of lysates obtained from cells at day 10 of differentiation incubated with antibodies to α-, β- and γ-globin. (iv) qPCR at day 4 of differentiation with primers: HBA for GAGGCCCTGGAGAGGATGTTCC rev ACAGCGCGTTGGGCATGTCGTC; HBB for GCTCACCTGGACAACCTCAR rev CGTTGCCCAGGAGCCTGAA; HBG for TGGGTCATTTCACAGAGGAGR rev TAGACAACCAGGAGCCTTCC; PABPC1 for AGCTGTTCCCAACCCTGTAATC rev GGATAGTATGCAGCACGGTTCTG. Globin mRNA levels were normalised to respective PABPC1 mRNA level of sample. Upper and lower panels show relative HBB/HBA and HBG/HBA mRNA level to that of respective unsorted line. Right-hand panel shows average HBB and HBG mRNA levels for all BEL-A or HUDEP-2 samples. HU-2=HUDEP-2. (v) Reversed-phase high-performance liquid chromatography (RP-HPLC) of BEL-A and HUDEP-2 cells and clonal populations at day 10 of differentiation. The injection peak is identified along with peaks for β-globin (β), Gγ-globin (Gγ), α-globin (α) and Aγ-globin (Aγ); δ-globin expression is below the detection limit. A sample of erythroid cells differentiated from cord blood CD34+ at 21 day in culture is included as a positive control for γ-globin. Method was as Loucari et al. with the exception of the injection size (600,000 cells in 30 μL dH2O) and the LC column used (Jupiter 5 μm C18 300A, size 250×4.4 mm, protected with a Security Guard analytical guard system [KJ0-4282, Phenomenex]).
Similar articles
-
Erratum to: Comparing the two leading erythroid lines BEL-A and HUDEP-2.Haematologica. 2024 Jan 1;109(1):364. doi: 10.3324/haematol.2023.284510. Haematologica. 2024. PMID: 38186343 Free PMC article. No abstract available.
-
Growing and Genetically Manipulating Human Umbilical Cord Blood-Derived Erythroid Progenitor (HUDEP) Cell Lines.Methods Mol Biol. 2018;1698:275-284. doi: 10.1007/978-1-4939-7428-3_17. Methods Mol Biol. 2018. PMID: 29076097
-
Robust CRISPR/Cas9 Genome Editing of the HUDEP-2 Erythroid Precursor Line Using Plasmids and Single-Stranded Oligonucleotide Donors.Methods Protoc. 2018 Jul 30;1(3):28. doi: 10.3390/mps1030028. Methods Protoc. 2018. PMID: 31164570 Free PMC article.
-
Distinct miRNA Signatures and Networks Discern Fetal from Adult Erythroid Differentiation and Primary from Immortalized Erythroid Cells.Int J Mol Sci. 2021 Mar 31;22(7):3626. doi: 10.3390/ijms22073626. Int J Mol Sci. 2021. PMID: 33807258 Free PMC article.
-
Comparison of the multi-drug resistant human hepatocellular carcinoma cell line Bel-7402/ADM model established by three methods.J Exp Clin Cancer Res. 2010 Aug 20;29(1):115. doi: 10.1186/1756-9966-29-115. J Exp Clin Cancer Res. 2010. PMID: 20727186 Free PMC article.
Cited by
-
Direct Generation of Immortalized Erythroid Progenitor Cell Lines from Peripheral Blood Mononuclear Cells.Cells. 2021 Mar 1;10(3):523. doi: 10.3390/cells10030523. Cells. 2021. PMID: 33804564 Free PMC article.
-
Erratum to: Comparing the two leading erythroid lines BEL-A and HUDEP-2.Haematologica. 2024 Jan 1;109(1):364. doi: 10.3324/haematol.2023.284510. Haematologica. 2024. PMID: 38186343 Free PMC article. No abstract available.
-
Generation of an immortalised erythroid cell line from haematopoietic stem cells of a haemoglobin E/β-thalassemia patient.Sci Rep. 2020 Oct 8;10(1):16798. doi: 10.1038/s41598-020-73991-4. Sci Rep. 2020. PMID: 33033327 Free PMC article.
-
Generation of red blood cells from stem cells: Achievements, opportunities and perspectives for malaria research.Front Cell Infect Microbiol. 2022 Nov 14;12:1039520. doi: 10.3389/fcimb.2022.1039520. eCollection 2022. Front Cell Infect Microbiol. 2022. PMID: 36452302 Free PMC article. Review.
-
Prime Editor 3 Mediated Beta-Thalassemia Mutations of the HBB Gene in Human Erythroid Progenitor Cells.Int J Mol Sci. 2022 Apr 30;23(9):5002. doi: 10.3390/ijms23095002. Int J Mol Sci. 2022. PMID: 35563395 Free PMC article.
References
-
- Anstee DJ, Gampel A, Toye AM. Ex-vivo generation of human red cells for transfusion. Curr Opin Hematol. 2012;19(3):163–169. - PubMed
Publication types
MeSH terms
Grants and funding
LinkOut - more resources
Full Text Sources
Medical
Research Materials
