. 2020 Sep 1;105(9):2240-2249.
doi: 10.3324/haematol.2018.210054.

XPO1 regulates erythroid differentiation and is a new target for the treatment of β-thalassemia

Affiliations

XPO1 regulates erythroid differentiation and is a new target for the treatment of β-thalassemia

Flavia Guillem et al. Haematologica. .

Abstract

β-thalassemia major (β-TM) is an inherited hemoglobinopathy caused by a quantitative defect in the synthesis of β-globin chains of hemoglobin, leading to the accumulation of free a-globin chains that aggregate and cause ineffective erythropoiesis. We have previously demonstrated that terminal erythroid maturation requires a transient activation of caspase-3 and that the chaperone Heat Shock Protein 70 (HSP70) accumulates in the nucleus to protect GATA-1 transcription factor from caspase-3 cleavage. This nuclear accumulation of HSP70 is inhibited in human β-TM erythroblasts due to HSP70 sequestration in the cytoplasm by free a-globin chains, resulting in maturation arrest and apoptosis. Likewise, terminal maturation can be restored by transduction of a nuclear-targeted HSP70 mutant. Here we demonstrate that in normal erythroid progenitors, HSP70 localization is regulated by the exportin-1 (XPO1), and that treatment of β-thalassemic erythroblasts with an XPO1 inhibitor increased the amount of nuclear HSP70, rescued GATA-1 expression and improved terminal differentiation, thus representing a new therapeutic option to ameliorate ineffective erythropoiesis of β-TM.


Figures
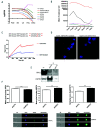
Figure 1.
Figure 1.
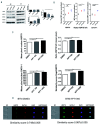
(previous page). In human erythroid progenitors, HSP70 is exported from the nucleus by an XPO1-dependent mechanism. Expression profiles for the seven different exportins (XPO1-XPO7) during terminal erythroid differentiation in human: mRNA expression from proerythroblast stage (ProE) to orthochromatic stage (Ortho). Values are extracted from public data and presented as log of reads per kilobase of transcript per million reads (logRPKM); EB: early basophile; LB: late basophile; Poly: polychromatophilic, (A) and protein expression from progenitor stage (ProG) to orthochromatic stage (Ortho). Values are presented as mean of protein copies per cell. ProG1: BFU-E; ProG2: CFUE; Baso1: early basophile; Baso2: late basophile; Poly: polychromatophilic (B). Data are representative of three independent experiments. (C) Putative XPO1 specific leucin-rich NES in the protein sequence of human HSP70 (NP_005336) at position L394-L403. The interactions between purified XPO1 and WT HSP70 as well as XPO1 with the nucleartargeted HSP70 mutant (S400A) were analyzed using BLI. WT HSP70 exhibits a much higher signal (i.e. affinity) for the ligand XPO1 compared to the nuclear HSP70 protein bearing a mutation in the NES residue S400A. Data are representative of two independent experiments. (D) Proximity of HSP70 and XPO1 proteins was analyzed in CD36+ erythroid progenitors derived from cord blood, by Duolink assay, using anti-XPO1 and anti-HSP70 antibodies (or anti-GATA1 for negative control). Red spots indicate <40 nm proximity between cellular-bound antibodies. Nuclei are stained with DAPI (blue). Images have been observed by confocal microscopy (x63 oil objective, scale bar= 5 μm). Data are representative of three independent experiments. (E) HSP70 and XPO1 direct interaction was demonstrated by CoIP experiments. HSP70 and XPO1 immunoblot detection is shown in total lysate (TL), in eluate from HSP70 IP and from IgG Control (IgG CTL) IP. The data are representative of three independent experiments in human erythroïd cells. (F) Erythroid progenitors from β-thalassemia major (β-TM) patient at day 2 of CD36+ culture were transduced with a shRNA specific for XPO1 or a sh scramble (shCTL). Both constructions express GFP. GFP+ cells were sorted and stained with anti-HSP70 or anti-XPO1 antibodies, and DAPI. XPO1 and HSP70 nuclear expression (mean pixel) were analyzed at day 2 following transduction, by ImageStream. In addition, HSP70 nuclear translocation was evaluated by measuring the similarity score between HSP70 and DAPI nuclear stainings. Data are presented as mean ±standard error of mean (SEM). On average, 30,000 events were collected in all experiments. P-values are determined by paired t-test. ***P<0.0001. Three illustrative images (ImageStream) of shCTL and shXPO1 conditions are presented. Cells were probed for HSP70 expression and run on the ImageStream. Bright field (white), DAPI (purple), HSP70 (green), and HSP70/DAPI composite (scale bar=7 μm). Data are representative of six independent experiments, n=2 different β-TM patients with n=2 different shRNA XPO1.
Figure 2.
Figure 2.
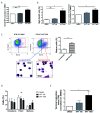
KPT-251 treatment has low effect on cell proliferation and cell death. Cell death and proliferation curves analysis of β-thalassemia major (β-TM) (A and B) and cord blood (C and D) erythroid progenitors, assessed by blue trypan staining at 24, 48 and 72 hours (H) of treatment with KPT100nM, KPT1000nM, or DMSO (control). Daily mean percentage±standard deviation (SD) of dead cells (n=5 independent experiments for β-TM and n=3 independent experiments for cord blood). Daily mean±standard deviation of cell proliferation (n=6 independent experiments for β-TM and n=3 independent experiments for cord blood). P-values are determined by ANOVA Dunnett’s multiple comparison test **P<0.01, NS: not significant.
Figure 3.
Figure 3.
KPT-251 treatment increases the amount of nuclear HSP70 and GATA-1 in β-thalassemia major (β-TM) erythroid progenitors. Erythroblasts derived from β-TM peripheral blood cells were treated at day 4 of CD36+ cell culture with 100nM, 1000nM of KPT-251, or with DMSO (control) for 72 hours (H). All data were analyzed at day 7 of CD36+cell culture (72 hours of treatment). (A) Immunoblot from 10 μg of nuclear extracts (NE) and 30 μg of cytoplasmic extracts (CE), (representative of three independent experiments performed on two different β-TM patient cell cultures). Graph shows optical relative quantity values of XPO1, HSP70 and GATA1 proteins normalized to that of HSP90 for CE and to that of HDAC2 for NE. Conditions KPT 100nM and 1000nM are normalized to that of DMSO condition. Absence of cytoplasmic proteins contamination in nuclear extracts is evidenced by the absence of HSP90 in NE. (B) Graph shows nuclear mean fluoresence intensity (MFI) of HSP70 and GATA-1, and HSP70 nuclear/cytoplasmic (N/C) ratio of MFI in treated (KPT 100 and 1000) and control (DMSO) cells determined by confocal microscopy images analyses. Data are presented as mean±standard error of mean (SEM) (for a minimum of 30 cells per condition), and are normalized on area. Pvalues are determined by ANOVA Dunnett’s multiple comparison test. Data are representative of three independent experiments. (C) HSP70 and GATA-1 nuclear expression (mean pixel), HSP70 N/C ratio (mean pixel) and HSP70 nuclear translocation (similarity score) were analyzed by ImageStream. Data are presented in histograms as mean±SEM. P-values are determined by ANOVA Dunnett’s multiple comparison test (representative of three independent experiments). On average, 30,000 events were collected in all experiments. (D) Three illustrating images of ImageStream experiments. Cells were probed for HSP70 and GATA-1 expression and run on the ImageStream. Bright field (white), HSP70 (green), GATA-1 (red), DAPI (purple) and HSP70/DAPI composite (scale bar=7μm). Respective similarity score±SEM are indicated under each group of images. *P<0.05; **P<0.01.
Figure 4.
Figure 4.
KPT-251 treatment improves terminal erythroid maturation in β-thalassemia major (β-TM) erythroid progenitors in vitro. β-TM erythroid progenitors were treated at day 4 of CD36+ cell culture with 100nM, 1000nM of KPT-251, or with DMSO (control) for 72 hours (day 7 CD36+ cell culture). (A) The mean fluorescence intensity (MFI) of Band 3 was analyzed by flow cytometry after 72 hours of treatment. MFI were normalized on DMSO condition. P-values are determined by ANOVA Dunnett’s multiple comparison test **P<0.01, NS: not significant (n=8 independent experiments, n=3 different β-TM samples). (B) (Left) Percentage of high Band3 cell population under the different treatment conditions and (Right) absolute number of high Band3 cells, normalized to DMSO treatment. P-values are determined by ANOVA Dunn’s multiple comparison test, **P<0.01, NS: not significant, n=8 independent experiments, n=3 β-TM patients. (C) Representative flow cytometry plots (a4-integrin and Band3 staining) of β-TM erythroid progenitors treated with KPT1000nM or DMSO. Strategy for cell sorting purification of high Band3 (red box) and low Band3 (blue box) erythroblasts populations after 72 hours (H) of KPT1000nM or DMSO treatment (day 7 CD36+ cell culture). A representative morphological analysis (x25 oil objective, scale bar= 10 μm) of purified cells from each gate by May-Grünwald-Giemsa staining. Corresponding graph showing the percentage of mature cells (orthochromatic erythroblasts + reticulocytes) contained in low Band3 and in high Band3 gates (n=3 independent experiments, n=2 different β-TM patients). P-values are determined by paired t-test ***P<0.001. (D) Proportions (%) of immature, polychromatophilic (PolyC), and mature (orthochromatic erythroblasts + reticulocytes) cells after 72 hours of treatment with KPT100nM, KPT 1000nM or DMSO. NS: not significant. (E) Corresponding TM index for the different conditions of treatment. P values are determined by ANOVA Dunnett’s multiple comparison test *P<0.05, NS: not significant (n=5 independent experiments).
Figure 5.
Figure 5.
Schematic illustration of the molecular mechanisms modulated by KPT treatment in β-thalassemia major (β-TM) erythroid progenitors compared to β-TM and normal erythroid progenitors in normal conditions. Schematic representation of molecular mechanisms in normal erythroid progenitor (EP), β-TM EP, and β-TM EP treated with KPT (cells on the right). The big arrow on the top represents the direction of differentiation progression. The decrease in XPO1 protein expression is represented by the pink triangle. During early differentiation stages (cell on the left), XPO1 exports HSP70 from the nucleus to the cytoplasm, while XPO1 expression is high. The entry of HSP70 being constant and mediated by Hikeshi, HSP70 is localized both in the cytoplasm and the nucleus at this stage. In normal EP, along differentiation, while XPO1 expression decreases, HSP70 accumulates in the nucleus until caspase-3 activates, corresponding to basophilic stage. Nuclear HSP70 protects GATA1 from caspase-3 cleavage to enable terminal maturation. In β-TM EP, at the stage of caspase-3 activation, HSP70 is trapped in the cytoplasm by the excess of free a-globin chains and can not protect GATA1 from cleavage. This results in maturation arrest at the polychromatophilic stage. In β-TM EP treated with KPT, XPO1 activity is repressed. This allows nuclear retention of the small amount of HSP70 that managed to get into the nucleus despite cytoplasm trapping by α chains. At the moment of caspase-3 activation, HSP70 is present in sufficient amount to protect GATA1 and enable an improvement in β-TM EP terminal maturation.

Comment in

References

    1. Zermati Y, Garrido C, Amsellem S, et al. Caspase activation is required for terminal erythroid differentiation. J Exp Med. 2001; 193(2):247-254. - PMC - PubMed
    1. Ribeil J-A, Zermati Y, Vandekerckhove J, et al. Hsp70 regulates erythropoiesis by preventing caspase-3-mediated cleavage of GATA-1. Nature. 2007;445(7123):102-105. - PubMed
    1. Arlet J-B, Ribeil J-A, Guillem F, et al. HSP70 sequestration by free a-globin promotes ineffective erythropoiesis in β-thalassaemia. Nature. 2014;514(7521):242-246. - PubMed
    1. Kudo N, Wolff B, Sekimoto T, et al. Leptomycin B inhibition of signal-mediated nuclear export by direct binding to CRM1. Exp Cell Res. 1998;242(2):540-547. - PubMed
    1. Nishi K, Yoshida M, Fujiwara D, Nishikawa M, Horinouchi S, Beppu T. Leptomycin B targets a regulatory cascade of crm1, a fission yeast nuclear protein, involved in control of higher order chromosome structure and gene expression. J Biol Chem. 1994; 269(9):6320-6324. - PubMed

Publication types

Substances