. 2019 Nov 22;366(6468):eaax0868.
doi: 10.1126/science.aax0868.

Universality and diversity in human song

Affiliations

Universality and diversity in human song

Samuel A Mehr et al. Science. .

Abstract

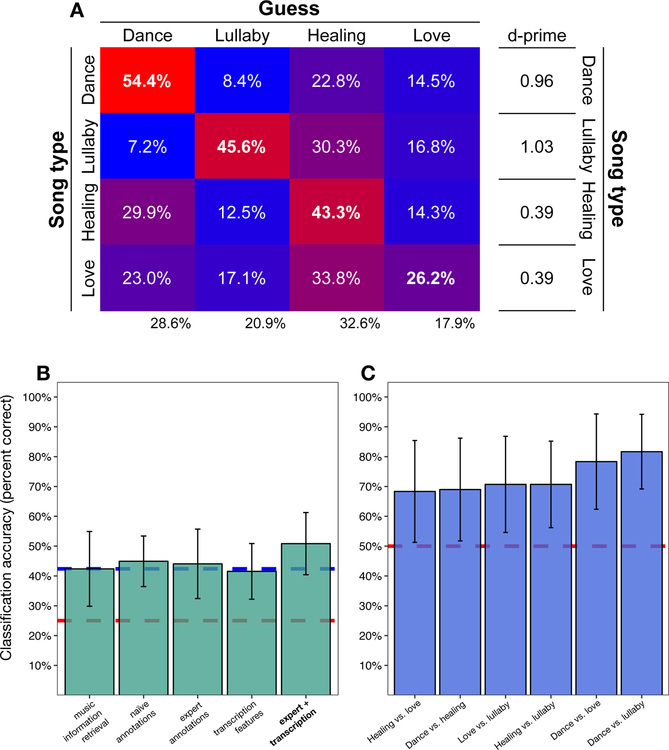
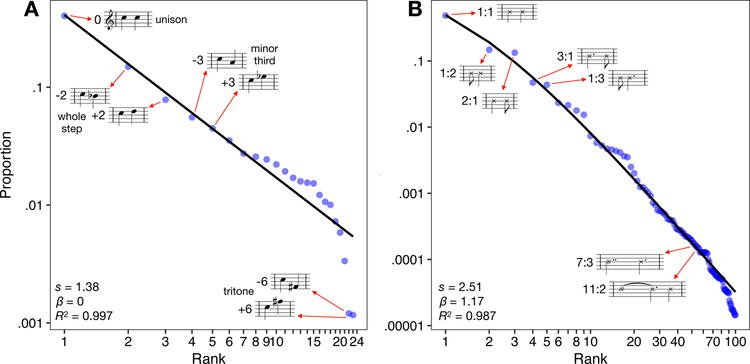
What is universal about music, and what varies? We built a corpus of ethnographic text on musical behavior from a representative sample of the world's societies, as well as a discography of audio recordings. The ethnographic corpus reveals that music (including songs with words) appears in every society observed; that music varies along three dimensions (formality, arousal, religiosity), more within societies than across them; and that music is associated with certain behavioral contexts such as infant care, healing, dance, and love. The discography-analyzed through machine summaries, amateur and expert listener ratings, and manual transcriptions-reveals that acoustic features of songs predict their primary behavioral context; that tonality is widespread, perhaps universal; that music varies in rhythmic and melodic complexity; and that elements of melodies and rhythms found worldwide follow power laws.


Conflict of interest statement

Competing interests: The authors declare no competing interests.

Figures

Fig. 1.
Fig. 1.. Design of NHS Ethnography.
The illustration depicts the sequence from acts of singing to the ethnography corpus. (A) People produce songs in conjunction with other behavior, which scholars observe and describe in text. These ethnographies are published in books, reports, and journal articles and then compiled, translated, catalogued, and digitized by the Human Relations Area Files organization. We conduct searches of the online eHRAF corpus for all descriptions of songs in the 60 societies of the Probability Sample File (B) and annotate them with a variety of behavioral features. The raw text, annotations, and metadata together form the NHS Ethnography. Codebooks listing all available data are in Tables S1–S6; a listing of societies and locations from which texts were gathered is in Table S12.
Fig. 2.
Fig. 2.. Patterns of variation in the NHS Ethnography.
The figure depicts a projection of a subset of the NHS Ethnography onto three principal components (A). Each point represents the posterior mean location of an excerpt, with points colored by which of four types (identified by a broad search for matching keywords and annotations) it falls into: dance (blue), lullaby (green), healing (red), or love (yellow). The geometric centroids of each song type are represented by the diamonds. Excerpts that do not match any single search are not plotted, but can be viewed in the interactive version of this figure at http://themusiclab.org/nhsplots, along with all text and metadata. Selected examples of each song type are presented here (highlighted circles and B, C, D, E). Density plots (F, G, H) show the differences between song types on each dimension. Criteria for classifying song types from the raw text and annotations are presented in Table S17.
Fig. 3.
Fig. 3.. Society-wise variation in musical behavior.
Density plots for each society showing the distributions of musical performances on each of the three principal components (Formality, Arousal, Religiosity). Distributions are based on posterior samples aggregated from corresponding ethnographic observations. Societies are ordered by the number of available documents in the NHS Ethnography (the number of documents per society is displayed in parentheses). Distributions are color-coded based on their mean distance from the global mean (in z-scores; redder distributions are farther from 0). While some societies’ means differ significantly from the global mean, the mean of each society’s distribution is within 1.96 standard deviations of the global mean of 0. One society (Tzeltal) is not plotted, because it has insufficient observations for a density plot. Asterisks denote society-level mean differences from the global mean. *p < .05; **p < .01; ***p <.001
Fig. 4.
Fig. 4.. Design of the NHS Discography.
The illustration depicts the sequence from acts of singing to the audio discography. (A) People produce songs, which scholars record. We aggregate and analyze the recordings via four methods: automatic music information retrieval, annotations from expert listeners, annotations from naive listeners, and staff notation transcriptions (from which annotations are automatically generated). The raw audio, four types of annotations, transcriptions, and metadata together form NHS Discography. The locations of the 86 societies represented are plotted in (B), with points colored by the song type in each recording (dance in blue, healing in red, love in yellow, lullaby in green). Codebooks listing all available data are in Tables S1 and S7–S11; a listing of societies and locations from which recordings were gathered is in Table S22.
Fig. 5.
Fig. 5.. Form and function in song.
In a massive online experiment (N = 29,357), listeners categorized dance songs, lullabies, healing songs, and love songs at rates higher than chance level of 25% (A), but their responses to love songs were by far the most ambiguous (the heatmap shows average percent correct, color coded from lowest magnitude, in blue, to highest magnitude, in red). Note that the marginals (below the heatmap), are not evenly distributed across behavioral contexts: listeners guessed “healing” most often and “love” least often despite the equal number of each in the materials. The d-prime scores estimate listeners’ sensitivity to the song-type signal independent of this response bias. Categorical classification of the behavioral contexts of songs (B), using each of the four representations in the NHS Discography, is substantially above the chance performance level of 25% (dotted red line) and is indistinguishable from the performance of human listeners, 42.4% (dotted blue line). The classifier that combines expert annotations with transcription features (the two representations that best ignore background sounds and other context) performs at 50.8% correct, above the level of human listeners. (C) Binary classifiers which use the expert annotation + transcription feature representations to distinguish pairs of behavioral contexts (e.g., dance from love songs, as opposed to the 4-way classification in B), perform above the chance level of 50% (dotted red line). Error bars represent 95% confidence intervals from corrected resampled t-tests (95).
Fig. 6.
Fig. 6.. Signatures of tonality in the NHS Discography.
Histograms (A) representing the ratings of tonal centers in all 118 songs, by thirty expert listeners, show two main findings. First, most songs’ distributions are unimodal, such that most listeners agreed on a single tonal center (represented by the value 0). Second, when listeners disagree, they are multimodal, with the most popular second mode (in absolute distance) 5 semitones away from the overall mode, a perfect fourth. The music notation is provided as a hypothetical example only, with C as a reference tonal center; note that the ratings of tonal centers could be at any pitch level. The scatterplot (B) shows the correspondence between modal ratings of expert listeners with the first-rank predictions from the Krumhansl-Schmuckler key-finding algorithm. Points are jittered to avoid overlap. Note that pitch classes are circular (i.e., C is one semitone away from C# and from B) but the plot is not; distances on the axes of (B) should be interpreted accordingly.
Fig. 7.
Fig. 7.. Dimensions of musical variation in the NHS Discography.
A Bayesian principal components analysis reduction of expert annotations and transcription features (the representations least contaminated by contextual features) shows that these measurements fall along two dimensions (A) that may be interpreted as rhythmic complexity and melodic complexity. Histograms for each dimension (B, C) show the differences — or lack thereof — between behavioral contexts. In (D-G) we highlight excerpts of transcriptions from songs at extremes from each of the four quadrants, to validate the dimension reduction visually. The two songs at the high-rhythmic-complexity quadrants are dance songs (in blue), while the two songs at the low-rhythmic-complexity quadrants are lullabies (in green). Healing songs are depicted in red and love songs in yellow. Readers may listen to excerpts from all songs in the corpus at http://osf.io/jmv3q; an interactive version of this plot is available at http://themusiclab.org/nhsplots.
Fig. 8.
Fig. 8.. The distributions of melodic and rhythmic patterns in the NHS Discography follow power laws.
We computed relative melodic (A) and rhythmic (B) bigrams and examined their distributions in the corpus. Both distributions followed a power law; the parameter estimates in the inset correspond to those from the generalized Zipf-Mandelbrot law, where s refers to the exponent of the power law and β refers to the Mandelbrot offset. Note that in both plots, the axes are on logarithmic scales. The full lists of bigrams are in Tables S28–S29.

Comment in

  • The world in a song.
    Fitch WT, Popescu T. Fitch WT, et al. Science. 2019 Nov 22;366(6468):944-945. doi: 10.1126/science.aay2214. Science. 2019. PMID: 31753980 No abstract available.

References

    1. Longfellow HW, Outre-mer: A pilgrimage beyond the sea (Harper, 1835).
    1. Bernstein L, The unanswered question: Six talks at Harvard (Harvard University Press, Cambridge, Mass, 2002).
    1. Honing H, ten Cate C, Peretz I, Trehub SE, Without it no music: Cognition, biology and evolution of musicality. Philos. Trans. R. Soc. B Biol. Sci 370, 20140088 (2015). - PMC - PubMed
    1. Mehr SA, Krasnow MM, Parent-offspring conflict and the evolution of infant-directed song. Evol. Hum. Behav 38, 674–684 (2017).
    1. Hagen EH, Bryant GA, Music and dance as a coalition signaling system. Hum. Nat 14, 21–51 (2003). - PubMed

Publication types