. 2019 Nov 21;10(1):5277.
doi: 10.1038/s41467-019-13142-0.

Brain activity regulates loose coupling between mitochondrial and cytosolic Ca2+ transients

Affiliations

Brain activity regulates loose coupling between mitochondrial and cytosolic Ca2+ transients

Yuan Lin et al. Nat Commun. .

Abstract

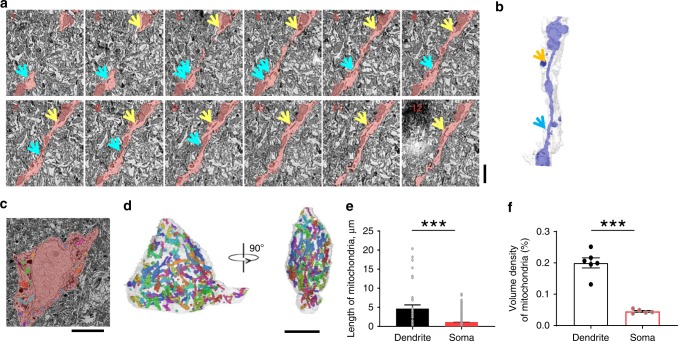
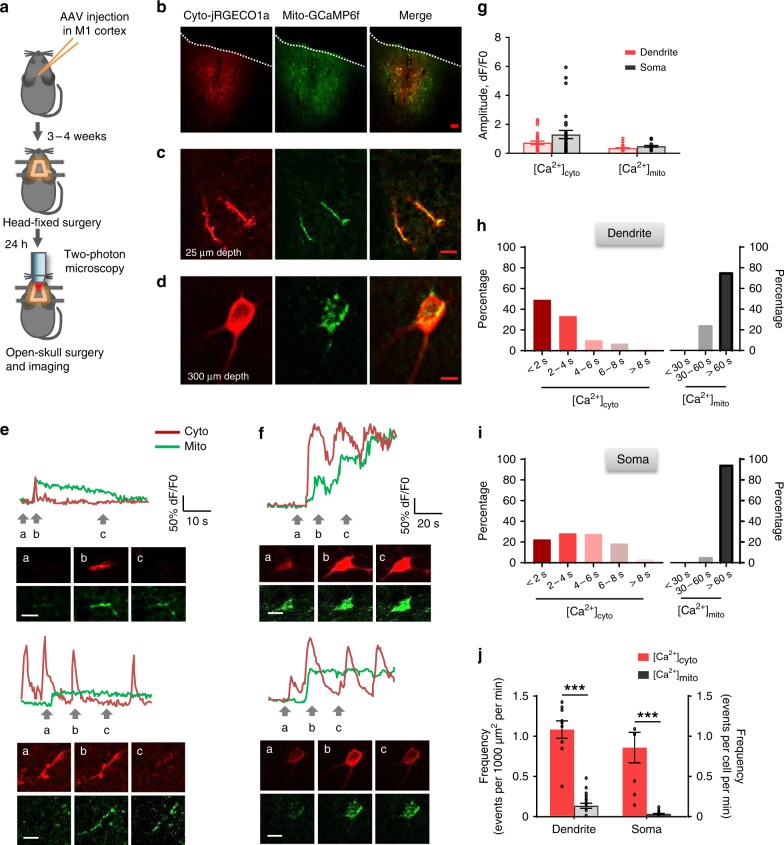
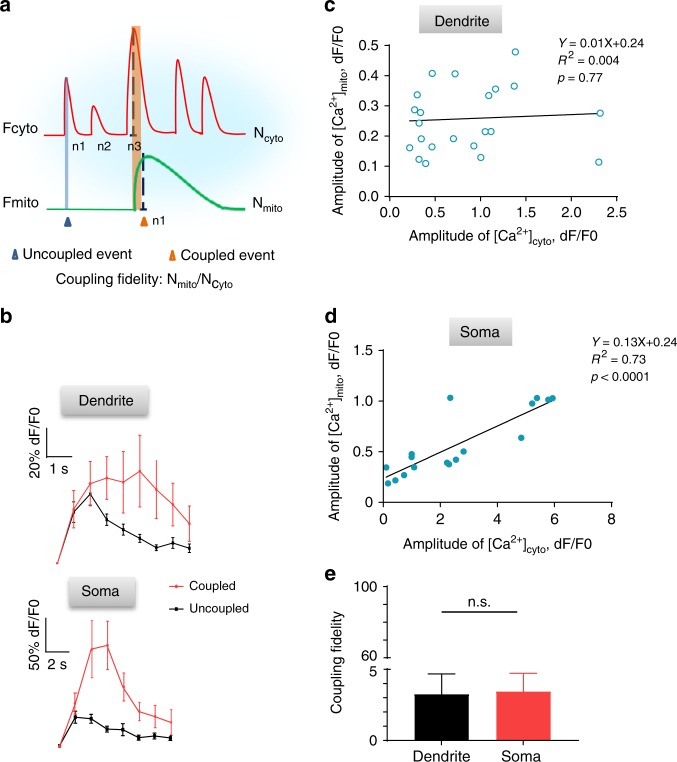
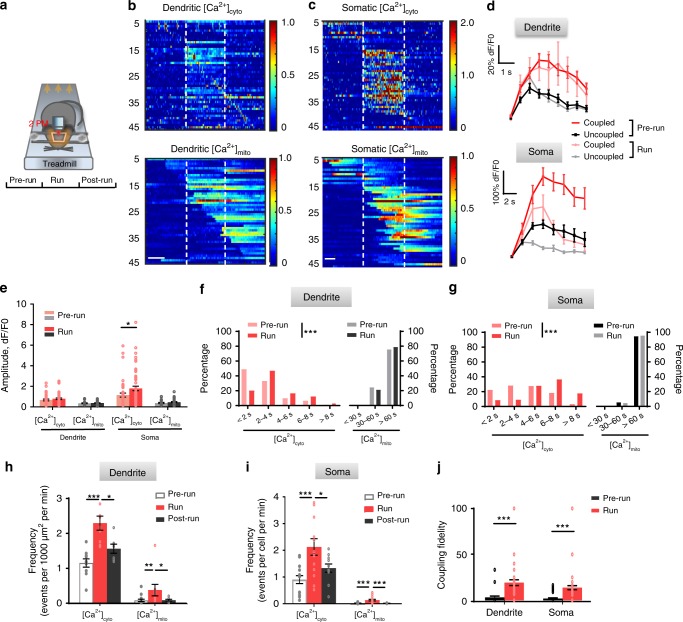
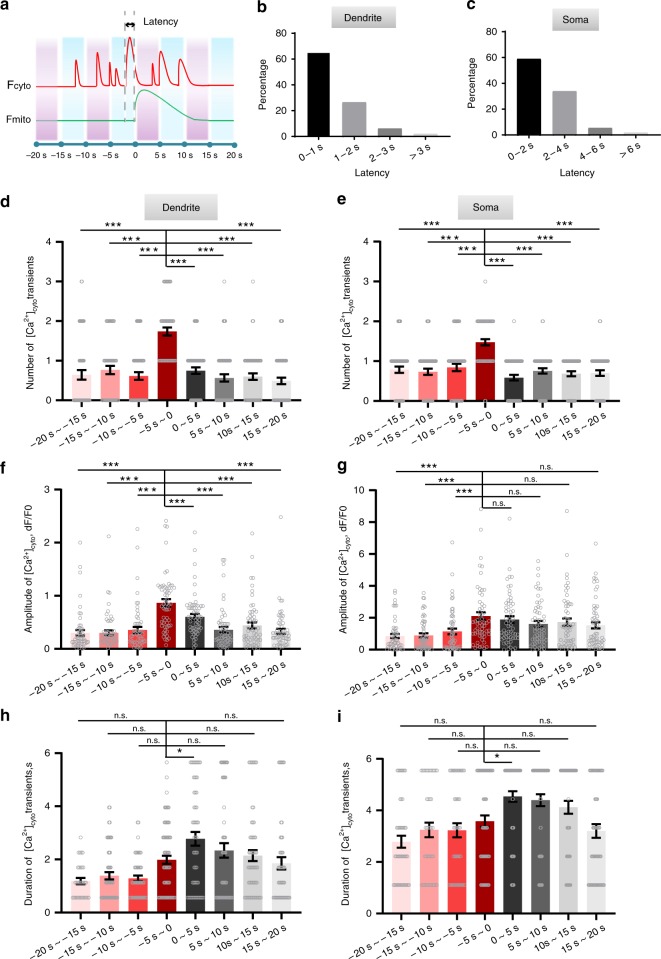
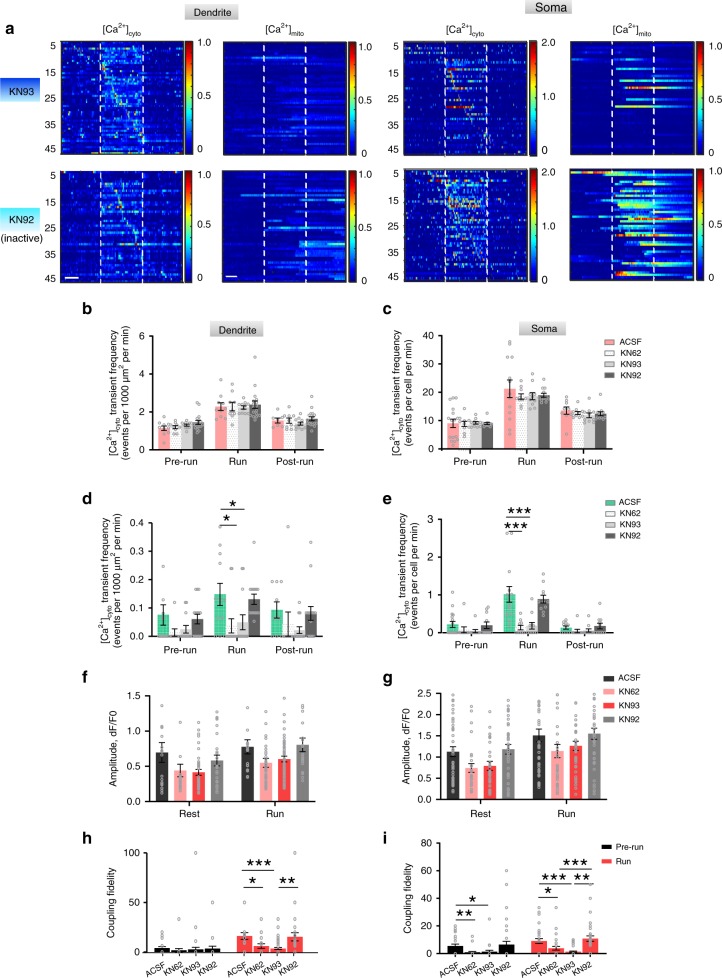
Mitochondrial calcium ([Ca2+]mito) dynamics plays vital roles in regulating fundamental cellular and organellar functions including bioenergetics. However, neuronal [Ca2+]mito dynamics in vivo and its regulation by brain activity are largely unknown. By performing two-photon Ca2+ imaging in the primary motor (M1) and visual cortexes (V1) of awake behaving mice, we find that discrete [Ca2+]mito transients occur synchronously over somatic and dendritic mitochondrial network, and couple with cytosolic calcium ([Ca2+]cyto) transients in a probabilistic, rather than deterministic manner. The amplitude, duration, and frequency of [Ca2+]cyto transients constitute important determinants of the coupling, and the coupling fidelity is greatly increased during treadmill running (in M1 neurons) and visual stimulation (in V1 neurons). Moreover, Ca2+/calmodulin kinase II is mechanistically involved in modulating the dynamic coupling process. Thus, activity-dependent dynamic [Ca2+]mito-to-[Ca2+]cyto coupling affords an important mechanism whereby [Ca2+]mito decodes brain activity for the regulation of mitochondrial bioenergetics to meet fluctuating neuronal energy demands as well as for neuronal information processing.


Conflict of interest statement

The authors declare no competing interests.

Figures

Fig. 1
Fig. 1
Mitochondrial morphology in the mouse M1 pyramidal neurons. Data were obtained with automated tape-collecting ultramicrotome scanning electron microscopy (ATUM-SEM). a Gallery view of SEM slices of the dendritic mitochondria. Yellow and green arrows indicate the mitochondria nanotunneling in the dendrite highlighted in pink. Scale bar: 1 μm. b Volume reconstruction of mitochondria (blue) in the dendrite (semi-transparent white) as shown by the pink area in (a). Yellow and green arrows indicate the mitochondria nanotunneling. c Image of a cell body of pyramidal neuron in M1. Scale bar: 5 μm. d 3D volume reconstruction of mitochondria in the mouse M1 neuron soma (semi-transparent white). n = 291 mitochondria identified are shown in different colors. Scale bar: 5 μm. e Statistics of mitochondrial length in dendrites and somas. n = 35 dendritic and 2465 somatic mitochondria. f Volume densities of mitochondria in dendrites and somas. n = 6 dendrites and 5 somas. Data are presented as mean ± SEM. *P < 0.05. **P < 0.01. ***P < 0.0001, unpaired T-test. Source data are provided as a Source Data file.
Fig. 2
Fig. 2
Imaging of [Ca2+]cyto and [Ca2+]mito transients in cortical neurons in awake mice. a Schematic showing experimental timeline for virus injection, head holder mounting, open-skull surgery, and two-photon imaging. Genetically-encoded Ca2+ indicators, mito-GCaMP6f and jRGECO1a, were used to report cytosolic and mitochondrial Ca2+ activity, respectively. b Confocal imaging of primary motor cortex neurons labeled by mtGCaMP6f and jRGECO1a in brain slice. Most of the labeled cells were in L2/3 (~150–350 μm deep from pial). Scale bars: 50 μm. c, d Representative 2PM images of double labeling of L1 dendrites at 25 μm depth (c) and a L2/3 soma at 300 μm depth (d). Scale bars: 20 μm. e, f Representative examples of pairs of [Ca2+]cyto and [Ca2+]mito transients in L1 dendrites (e) and L2/3 somas (f). Upper panels: time courses of fluorescence changes. Lower panels: corresponding dual channel images at three time points marked by arrows. Note that [Ca2+]mito transients display highly variable kinetics that can be mostly categorized into regular (upper panel of e), plateaued (lower panels), and staircase groups (upper panel of f). Scale bars: 10 μm (e) and 20 μm (f). g Amplitudes of [Ca2+]cyto and [Ca2+]mito transients in dendrites (n = 29 [Ca2+]cyto events and n = 29 [Ca2+]mito events from 6 mice) and somas (n = 29 [Ca2+]cyto events and n = 22 [Ca2+]mito events from 8 mice). h, i Distribution of duration of [Ca2+]cyto and [Ca2+]mito transients in dendrites (h) and somas (i) (h: n = 6 mice; i: n = 8 mice.). j Frequencies of spontaneous [Ca2+]cyto and [Ca2+]mito transients in dendrites (n = 9 [Ca2+]cyto events and n = 21 [Ca2+]mito events from 6 mice) and somas (n = 8 [Ca2+]cyto events and n = 25 [Ca2+]mito events from 8 mice). Data are presented as mean ± SEM. *P < 0.05. **P < 0.01. ***P < 0.0001, unpaired T-test. Source data are provided as a Source Data file.
Fig. 3
Fig. 3
Dynamic coupling of [Ca2+]mito to [Ca2+]cyto transients in neurons in vivo. a Schematic showing [Ca2+]cyto transients with or without coupled [Ca2+]mito transients. Ncyto or Nmito: number of cytosolic or mitochondrial Ca2+ transients observed. Coupling fidelity is defined as Nmito/Ncyto × 100%. b Averaged [Ca2+]cyto transients in dendrites (upper panel) and somas (lower panel). 10–29 traces were used for each group. c, d Correlation of amplitudes of [Ca2+]cyto and [Ca2+]mito transients for coupled events in dendrites (c) and somas (d). (c: n = 23 paired events from 6 mice; d: n = 17 paired events from 8 mice). e Coupling fidelity in dendrites and somas (n = 47 from 6 mice in dendrites, n = 23 from 8 mice in soma). Data are presented as mean ± SEM. *P < 0.05. **P < 0.01. ***P < 0.0001, unpaired T-test. n.s.: no significance. Source data are provided as a Source Data file.
Fig. 4
Fig. 4
Enhanced [Ca2+]mito-to-[Ca2+]cyto coupling amidst exercise-elicited neuronal activity. a Schematic of transcranial two-photon imaging in the forelimb motor cortex of awake, head-restrained mice before, during and after running on treadmill. b, c Heatmaps of [Ca2+]cyto and [Ca2+]mito activity in dendrites and somas under different conditions. Vertical dashed lines partition records obtained in the pre-run, run, and post-run stages. Each row represents Ca2+ activity from a dendrite (b, n = 48 events) or a soma (c, n = 49 events). Pairs of [Ca2+]cyto(upper panels) and [Ca2+]mito activities (lower panels) were sorted by time of peak amplitude of [Ca2+]cyto activity. Scale bars: 20 s. d Averaged [Ca2+]cyto transients in dendrites (upper panel) and somas (lower panel) prior to and during treadmill running. 52–60 traces were used for each group. e Amplitudes of [Ca2+]cyto and [Ca2+]mito transients in dendrites (n = 18–55 dendrites from 6 mice) and somas (n = 21–60 somas from 7 mice) during pre-run and run stages. f, g Histogram of duration of [Ca2+]cyto and [Ca2+]mito transients in dendrites (f) and somas (g) during pre-run and run stages. (f: n = 66 dendrites from 6 mice; g: n = 67 somas from 7 mice. Mann–Whitney U-Test). h, i Exercise increased [Ca2+]cyto frequency in dendrites (h, n = 7–26 from 6 mice) and somas (i, n = 11–17 from 7 mice). j Exercise increased [Ca2+]mito-to-[Ca2+]cyto coupling fidelity (n = 47–49 dendrites and 47–48 somas from 6–7 mice,). Data are presented as mean ± SEM. *P < 0.05. **P < 0.01. ***P < 0.0001, by one-way ANOVA and multiple comparisons. Source data are provided as a Source Data file.
Fig. 5
Fig. 5
Temporal analysis of [Ca2+]mito and [Ca2+]cyto coupling. a Schematic of eight selected time windows centered on the onset of [Ca2+]mito transient. Latency: the delay of the onset of a coupled [Ca2+]mito-to-[Ca2+]cyto event. b, c Statistics of the coupling latency in dendrites (b, n = 48 events) and somas (c, n = 49 events). di Distribution of the number (d, e), peak amplitude (f, g), and duration of [Ca2+]cyto transients (h, i) over different time windows in dendrites (d, f, h, n = 42–60 dendrites from 6 mice) and somas (e, f, i, n = 40–60 somas from 7 mice). Data are presented as mean ± SEM. *P < 0.05. **P < 0.01. ***P < 0.0001, by one-way ANOVA and multiple comparisons. n.s.:no signicance.  Source data are provided as a Source Data file.
Fig. 6
Fig. 6
Effects of CaMKII inhibition on [Ca2+]mito-to-[Ca2+]cyto coupling. a Heatmaps of [Ca2+]cyto and [Ca2+]mito activities in dendrites and somas with KN93 and KN92 treatment. Vertical dashed lines partition records obtained in the pre-run, run, and post-run stages. Each row represents Ca2+  activity from a dendrite (55 dendrites in KN93 group; 48 dendrites in KN92 group) or a soma (48 somas in KN93 group; 48 somas in KN92 group). Pairs of [Ca2+]cyto and [Ca2+]mito activities were sorted by time of maximum response of [Ca2+]cyto activity. Scale bars: 20 s. be Effect of CaMKII inhibitors on [Ca2+]cyto and [Ca2+]mito transient frequency before, during and after running on treadmill in dendrites (b, d) and somas (c, e). n = 4–5 mice. 100 μM KN62, 100 μM KN93, 100 μM KN92 (inactive analog of KN93) in ACSF, or ACSF were administrated on the brain with flapped skull for 20 min before imaging. f, g Effect of CaMKII inhibitors on [Ca2+]cyto amplitude in dendrites (f) and somas (g) before and during running. n = 4–5 mice. h, i CaMKII inhibition decreased coupling fidelity in dendrites (h) and somas (i). Data are presented as mean ± SEM. *P < 0.05. **P < 0.01. ***P < 0.0001, by one-way ANOVA and multiple comparisons. Source data are provided as a Source Data file.

References

    1. Green DR, Reed JC. Mitochondria and apoptosis. Science. 1998;281:1309–1312. doi: 10.1126/science.281.5381.1309. - DOI - PubMed
    1. Rizzuto R, De Stefani D, Raffaello A, Mammucari C. Mitochondria as sensors and regulators of calcium signalling. Nat. Rev. Mol. cell Biol. 2012;13:566–578. doi: 10.1038/nrm3412. - DOI - PubMed
    1. Shen E-Z, et al. Mitoflash frequency in early adulthood predicts lifespan in Caenorhabditis elegans. Nature. 2014;508:128–132. doi: 10.1038/nature13012. - DOI - PubMed
    1. Lin MT, Beal MF. Mitochondrial dysfunction and oxidative stress in neurodegenerative diseases. Nature. 2006;443:787–795. doi: 10.1038/nature05292. - DOI - PubMed
    1. Szabadkai G, Simoni AM, Rizzuto R. Mitochondrial Ca2+ uptake requires sustained Ca2+ release from the endoplasmic reticulum. J. Biol. Chem. 2003;278:15153–15161. doi: 10.1074/jbc.M300180200. - DOI - PubMed

Publication types

Substances