. 2019 Nov 21;10(1):5288.
doi: 10.1038/s41467-019-13296-x.

Coordination of cohabiting phage elements supports bacteria-phage cooperation

Affiliations

Coordination of cohabiting phage elements supports bacteria-phage cooperation

Tal Argov et al. Nat Commun. .

Abstract

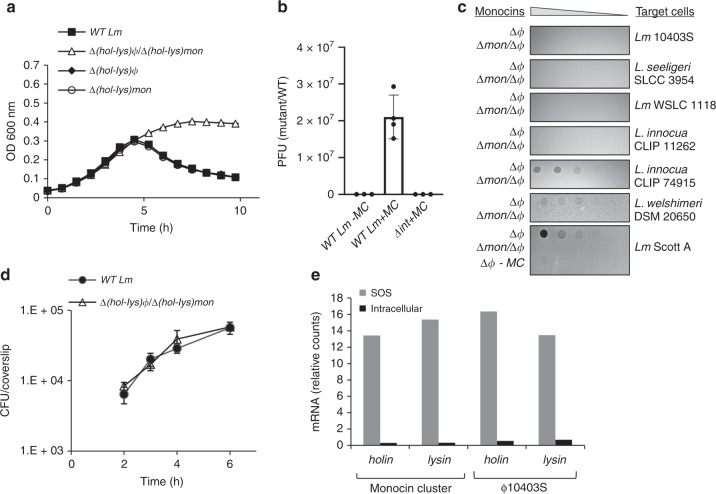
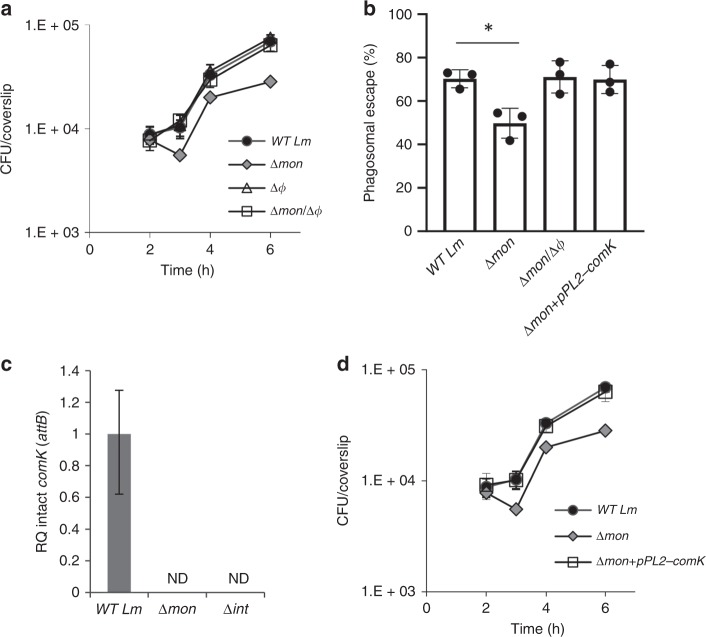
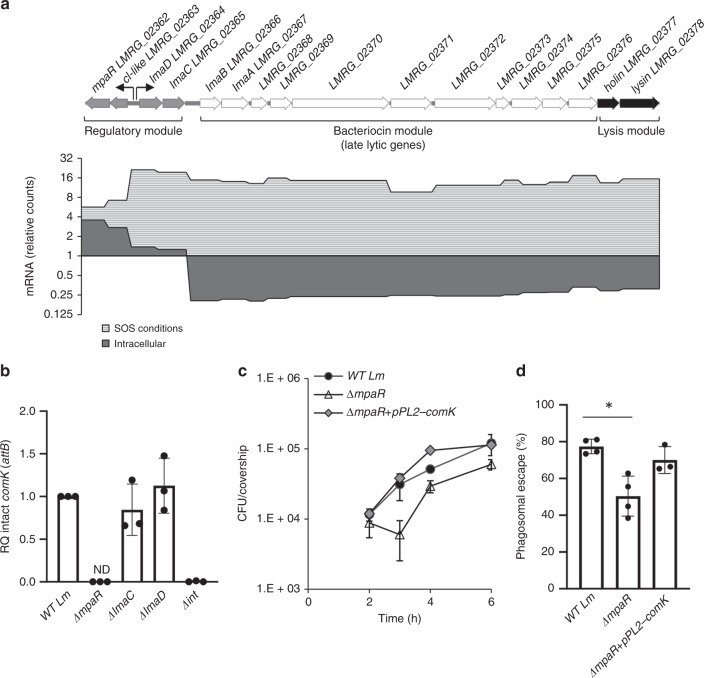
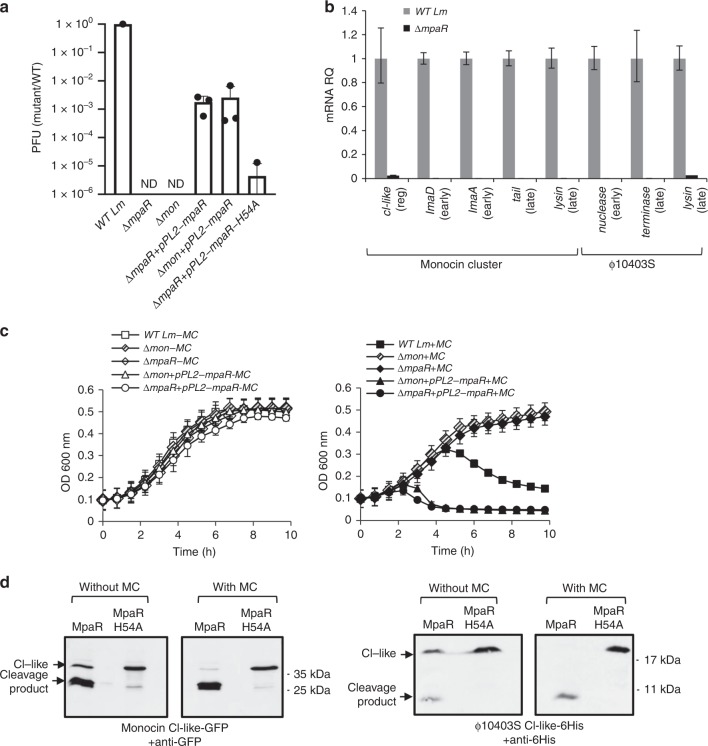
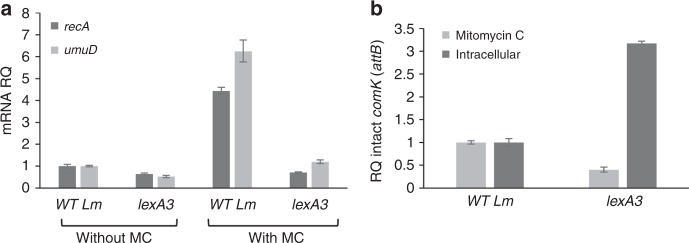
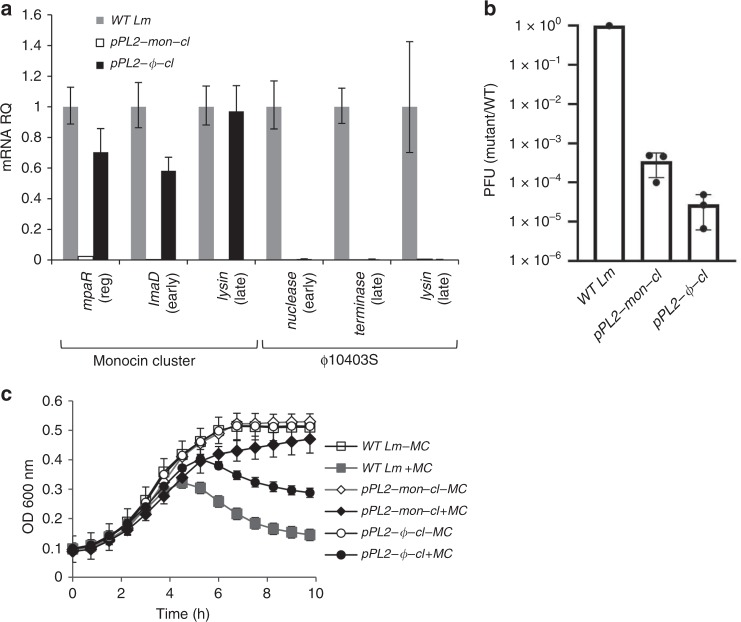
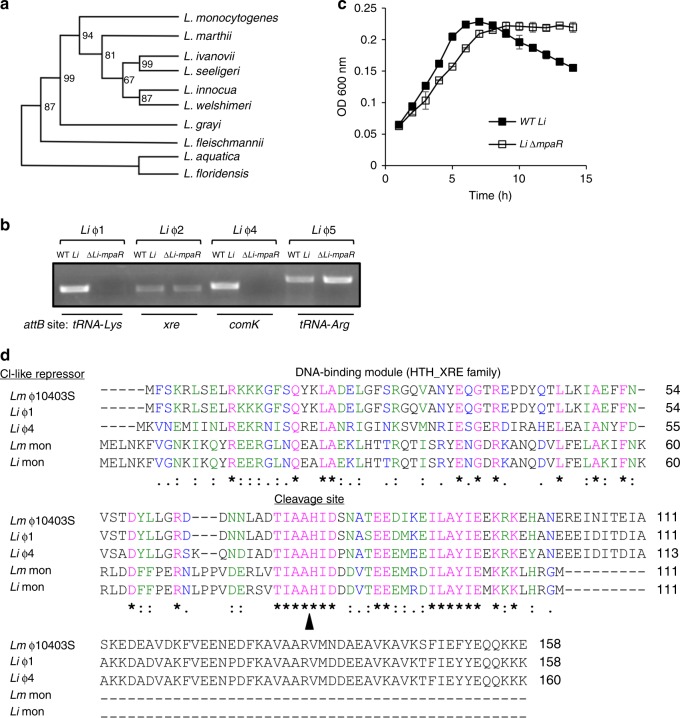
Bacterial pathogens often carry multiple prophages and other phage-derived elements within their genome, some of which can produce viral particles in response to stress. Listeria monocytogenes 10403S harbors two phage elements in its chromosome, both of which can trigger bacterial lysis under stress: an active prophage (ϕ10403S) that promotes the virulence of its host and can produce infective virions, and a locus encoding phage tail-like bacteriocins. Here, we show that the two phage elements are co-regulated, with the bacteriocin locus controlling the induction of the prophage and thus its activity as a virulence-associated molecular switch. More specifically, a metalloprotease encoded in the bacteriocin locus is upregulated in response to stress and acts as an anti-repressor for CI-like repressors encoded in each phage element. Our results provide molecular insight into the phenomenon of polylysogeny and its intricate adaptation to complex environments.


Conflict of interest statement

The authors declare no competing interests.

Figures

Fig. 1
Fig. 1
The Lm 10403S strain harbors two functional lytic phage elements. a Growth analysis of WT Lm and mutants harboring deletions of the elements lysis modules; LMRG_01552–4 of ϕ10403S (Δ(hol-lys)ϕ), and LMRG_02377-8 of monocin cluster (Δ(hol-lys)mon) or a mutant deleted of both lysis modules (Δhol-lys)ϕ/Δ(hol-lys)mon), in the presence of mitomycin C (MC). Growth analysis of the mutants without MC is presented in Supplementary Fig. 1. Error bars represent the standard deviation of three independent biological repeats, and are hidden by the symbols. b Plaque forming assay of WT Lm and a mutant deleted for the ϕ10403S integrase gene, Δint (LMRG_01511) with MC treatment (+MC). Virions obtained from MC treated bacterial cultures (4 h post MC treatment) or from bacteria grown to exponential phase (3 h, OD600 0.5) without MC treatment (WT Lm -MC), tested on an indicator strain for plaque forming units (PFU). Error bars represent the standard deviation of three independent experiments. c A monocin killing assay performed on monocins obtained from MC treated bacterial cultures of the Lm ϕ10403S-phage cured strain (Δϕ) and a mutant lacking both the monocin cluster (LMRG_02362-02378) and ϕ10403S-phage (Δmon/Δϕ), as a control. Five-fold serial dilutions of filtered supernatants (containing monocins) were applied on a lawn of different Listeria strains (target cells), and incubated for 1–2 days. The dark zones of growth inhibition indicate monocin killing activity. The experiment was performed three times. Monocins from Δϕ bacteria that were not treated with MC (Δϕ –MC) are shown at the bottom, as a reference. d Intracellular growth analysis of WT Lm and a deletion mutant lacking both lysis modules (Δ(hol-lys)ϕ/Δ(hol-lys)mon) in bone marrow derived macrophage (BMDM) cells. Growth curves represent one biological replicate, more independent experiments are shown in the source data file. Error bars represent standard deviation of a technical triplicate, sometimes hidden by the symbols. e Transcription analysis of the two phage elements holin and endolysin genes under SOS and intracellular growth conditions using NanoString technology (6 h post BMDM infection). Transcription levels are presented as fold change of relative counts for the indicated gene mRNA, relative to the levels observed during lysogeny (i.e., exponentially grown bacteria in BHI medium). Data represent 3 independent experiments. Source data are provided as a Source Data file.
Fig. 2
Fig. 2
The monocin element affects ϕ10403S excision within macrophage cells. a Intracellular growth analysis of WT Lm and mutants lacking each of the phage elements, Δmon and Δϕ (monocin cluster and ϕ10403S, respectively), and a double mutant lacking both phage elements Δmon/Δϕ, in BMDM cells. Growth curves represent one biological replicate, more independent experiments are shown in the source file. Error bars represent standard deviation of triplicate samples, and are hidden by the symbols. b A bacterial phagosomal escape assay. Percentage of bacteria that escaped the macrophage phagosomes at 2.5 h post infection, as determined by a microscope fluorescence assay. Macrophages were infected with WT Lm, Δmon and Δmon/Δϕ bacteria, as well as with a Δmon mutant that was complemented with an intact comK gene on the pPL2 plasmid (Δmon+pPL2-comK). The data is a mean of three independent experiments. The error bar represent standard deviation. Asterisk (*) indicates statistical significance of p = 0.01 calculated using Student's t-test. c qRT-PCR analysis of intact comK gene (representing ϕ10403S attB site) in WT Lm and indicated mutants grown intracellularly in BMDM cells (6 h post infection). Presented as relative quantity (RQ), relative to the levels in WT bacteria. The data represent three independent experiments. Error bars indicate a 95% confidence interval. d Intracellular growth analysis of WT Lm, Δmon and the Δmon mutant complemented with an intact comK gene with its native promoter (Δmon+pPL2-comK) in BMDM cells. Growth curves represent one biological replicate, more independent experiments are shown in Supplementary Fig. 2 and in the source data file. Error bars represent standard deviation of triplicate samples, and are hidden by the symbols. Source data are provided as a Source Data file.
Fig. 3
Fig. 3
MpaR is required for ϕ10403S excision. a Upper panel: schematic representation of the monocin locus. The mon consists of 17 genes comprising: a regulatory module, a bacteriocin module encoding tail-like structures, and a lysis module. Lower panel: transcription analysis of the monocin cluster genes under SOS and intracellular growth (in BMDM cells) conditions, using NanoString technology. Transcription levels are presented as relative counts, relative to the levels observed at the lysogenic state (i.e., exponentially grown bacteria in BHI medium at 37˚C). Data represent three independent experiments. b qRT-PCR analysis of intact comK gene (representing ϕ10403S attB site) in WT Lm and indicated mutants grown intracellularly in BMDM cells (6 h post infection). Presented as relative quantity (RQ), relative to the levels in WT bacteria. The data is a mean of three independent experiments. Error bars indicate a standard deviation. c Intracellular growth analysis of WT Lm, ΔmpaR and ΔmpaR mutant complemented with an intact comK gene under its native promoter (ΔmpaR+pPL2-comK). Growth curves represent one biological replicate, more independent experiments are shown in Supplementary Fig. 2 and in the source file. Error bars represent standard deviation of triplicate samples, sometimes are hidden by the symbols. d A bacterial phagosomal escape assay. Percentage of bacteria that escaped the macrophage phagosomes at 2.5 h post infection, as determined by a microscope fluorescence assay. Macrophages were infected with WT Lm, ΔmpaR and ΔmpaR mutant complemented with an intact comK gene on the pPL2 plasmid (ΔmpaR+pPL2-comK). The data is a mean of three independent experiments. The error bar represent standard deviation. Asterisk (*) indicates statistical significance of p < 0.01 calculated using Student's t-test. Source data are provided as a Source Data file.
Fig. 4
Fig. 4
MpaR functions as an anti-repressor of both monocin and ϕ10403S. a A plaque forming assay of WT Lm, ΔmpaR and Δmon mutants, as well as their complemented strains harboring mpaR gene on pPL2 (ΔmpaR+pPL2-mpaR and Δmon+pPL2-mpaR, respectively), 4 h post MC treatment at 30˚C. Also included ∆mpaR mutant that was introduced with mpaR-H54A variant on pPL2 (ΔmpaR+pPL2-mpaR-H54A). The results are normalized to PFU of WT bacteria. Error bars represent standard deviation of 3 independent experiments. b qRT-PCR analysis of transcription levels of indicated genes of monocin-cluster or ϕ10403S under SOS (4 h post MC treatment at 30˚C) in WT and ΔmpaR bacteria. Transcription levels are represented as relative quantity (RQ), relative to their levels in WT bacteria. The data represent three independent experiments. Error bars indicate a 95% confidence interval. c Growth of WT Lm, ΔmpaR and Δmon, as well as their complemented strains harboring the mpaR gene on pPL2 under the constitutive veg promoter (ΔmpaR+pPL2-mpaR and Δmon+pPL2-mpaR, respectively) without (left panel) and with (right panel) MC. The data shows the mean and the standard deviation of three independent biological repeats. d Western blot analysis of CI-like repressors cleavage by MpaR. Δmon/Δϕ bacteria harboring pPL2 expressing translational fusions of mon-CI-like-GFP (left panel) and ϕ10403S CI-like-6-His (right panel), in addition to MpaR or MpaR-H54A variant, under the tetR promoter. Equal amounts of total protein from bacteria grown in the presence and absence of MC were separated on 15% SDS-PAGE, blotted and probed with anti-GFP antibodies for mon-CI-like repressor or anti-6His antibodies for ϕ10403S-CI-like repressor. The experiment was performed 3 times, and the figure shows representative blots. Source data are provided as a Source Data file.
Fig. 5
Fig. 5
The role of the SOS response in MpaR activation. a qRT-PCR transcription analysis of SOS response representative genes (recA and umuD) in WT bacteria and bacteria harboring lexA3 mutation, with and without MC treatment at 30 ˚C. Transcription levels are presented as relative quantity (RQ), relative to their levels in untreated WT bacteria. The data represents three independent experiments. Error bars indicate a 95% confidence interval. b qRT-PCR transcription analysis of intact comK gene (attB site) in WT bacteria and bacteria harboring the lexA3 mutation upon MC treatment or during intracellular growth in macrophages (6 h post infection). attB levels are presented as relative quantity (RQ), relative to their levels in WT bacteria. The data represents three independent experiments. Error bars indicate a 95% confidence interval. Source data are provided as a Source Data file.
Fig. 6
Fig. 6
The monocin cluster CI-like repressor regulates ϕ10403S induction. a qRT-PCR transcription analysis of monocin cluster and ϕ10403S representative genes in WT bacteria and bacteria constitutively over-expressing mon-CI-like or ϕ-CI-like repressors from pPL2 (pPL2-mon-cI and pPL2-ϕ-cI, respectively), 4 h post MC treatment at 30 ˚C. Transcription levels are presented as relative quantity (RQ), relative to their levels in WT bacteria. The data represent 3 independent experiments. Error bars indicate a 95% confidence interval. b A plaque forming assay performed on WT Lm or bacteria constitutively over-expressing mon-CI-like or ϕ-CI-like repressors from pPL2 (pPL2-mon-cI and pPL2-ϕ-cI, respectively), 4 h post MC treatment at 30 ˚C. The results were normalized to the results with WT bacteria. Error bars represent the standard deviation of three independent experiments. c Growth analysis of WT Lm or bacteria constitutively over-expressing mon-CI-like or ϕ-CI-like repressors from pPL2 under the constitutive veg promoter (pPL2-mon-cI and pPL2-ϕ-cI, respectively) with or without MC. The data shows the mean and the standard deviation of three independent biological repeats. Source data are provided as a Source Data file.
Fig. 7
Fig. 7
MpaR functions as a multi-phage coordinator. a Phylogenetic tree of Listeria species based on the amino acid sequence of MpaR (using 12 selected Listeria strains that represent the different Listeria species, as performed by Orsi et al. 2016). Bootstrap values are indicated on the relevant branches. b PCR analysis of the genomic region around the attB sites of L. innocua Clip112624 prophages, performed in wild-type bacteria (WT Li) and in a strain deleted of the mpaR gene (∆Li-mpaR) under MC treatment. Visible PCR products indicate phage excision and restoration of the attB sites. The genes harboring the prophages attB sites are indicated at the bottom. c Growth analysis of WT L. innocua (WT Li) and its isogenic mpaR mutant (LimpaR) with MC (growth without MC is presented in Supplementary Fig. 6). The data shows the mean and the standard deviation of three independent biological repeats. Source data are provided as a Source Data file. d Multiple amino acid sequence alignment (by Clustal Omega) of the five different CI-like repressors that were found to be regulated by MpaR in Lm 10403S and L. innocua Clip112624 (Li). Identical amino acid residues (aa) are marked with (*), strongly similar aa are marked with (:), and weakly similar aa are marked with (.). The exact cleavage site of MpaR, as obtained by LC-MS/MS analysis of ϕ10403S CI-like repressor cleavage product, is indicated by a black arrowhead.

References

    1. Casjens S. Prophages and bacterial genomics: what have we learned so far? Mol. Microbiol. 2003;49:277–300. doi: 10.1046/j.1365-2958.2003.03580.x. - DOI - PubMed
    1. Oppenheim AB, Kobiler O, Stavans J, Court DL, Adhya S. Switches in bacteriophage lambda development. Annu. Rev. Genet. 2005;39:409–429. doi: 10.1146/annurev.genet.39.073003.113656. - DOI - PubMed
    1. Brussow H, Canchaya C, Hardt WD. Phages and the evolution of bacterial pathogens: from genomic rearrangements to lysogenic conversion. Microbiol. Mol. Biol. Rev. 2004;68:560–602. doi: 10.1128/MMBR.68.3.560-602.2004. - DOI - PMC - PubMed
    1. Swaminathan B, Gerner-Smidt P. The epidemiology of human listeriosis. Microbes Infect. 2007;9:1236–1243. doi: 10.1016/j.micinf.2007.05.011. - DOI - PubMed
    1. Freitag NE, Port GC, Miner MD. Listeria monocytogenes - from saprophyte to intracellular pathogen. Nat. Rev. Microbiol. 2009;7:623–628. doi: 10.1038/nrmicro2171. - DOI - PMC - PubMed

Publication types

MeSH terms