. 2019 Nov 21;9(1):17287.
doi: 10.1038/s41598-019-53599-z.

Effects of sampling strategy and DNA extraction on human skin microbiome investigations

Affiliations

Effects of sampling strategy and DNA extraction on human skin microbiome investigations

Rie Dybboe Bjerre et al. Sci Rep. .

Abstract

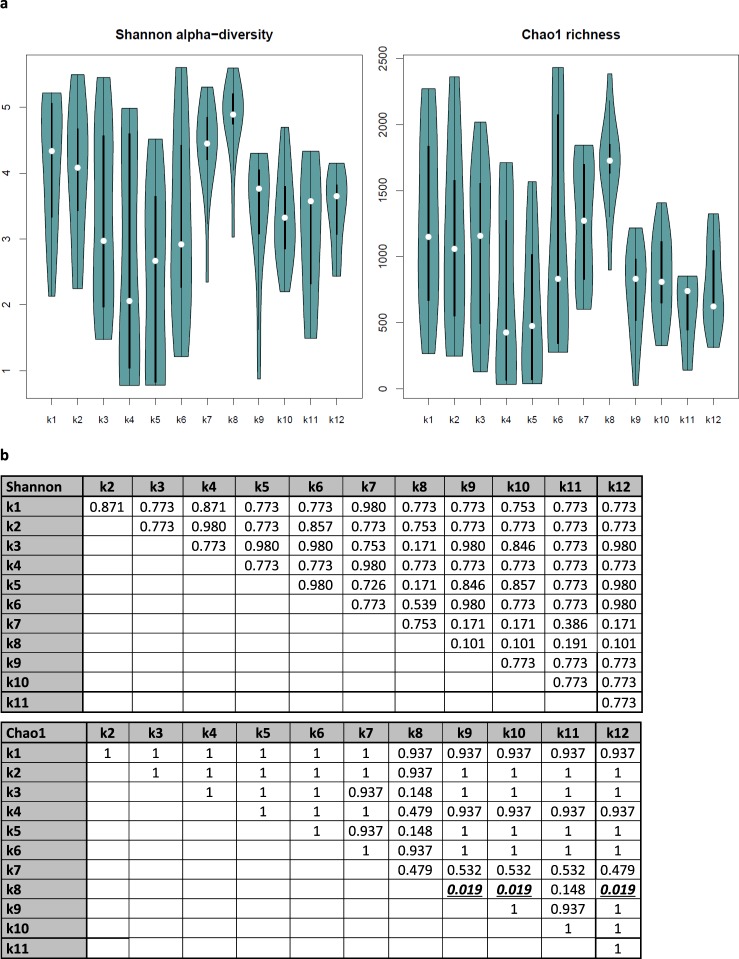
The human skin is colonized by a wide array of microorganisms playing a role in skin disorders. Studying the skin microbiome provides unique obstacles such as low microbial biomass. The objective of this study was to establish methodology for skin microbiome analyses, focusing on sampling technique and DNA extraction. Skin swabs and scrapes were collected from 9 healthy adult subjects, and DNA extracted using 12 commercial kits. All 165 samples were sequenced using the 16S rRNA gene. Comparing the populations captured by eSwabs and scrapes, 99.3% of sequences overlapped. Using eSwabs yielded higher consistency. The success rate of library preparation applying different DNA extraction kits ranged from 39% to 100%. Some kits had higher Shannon alpha-diversity. Metagenomic shotgun analyses were performed on a subset of samples (N = 12). These data indicate that a reduction of human DNA from 90% to 57% is feasible without lowering the success of 16S rRNA library preparation and without introducing taxonomic bias. Using swabs is a reliable technique to investigate the skin microbiome. DNA extraction methodology is crucial for success of sequencing and adds a substantial amount of variation in microbiome analyses. Reduction of host DNA is recommended for interventional studies applying metagenomics.


Conflict of interest statement

All authors declare that they have no financial competing interests. J.D.J. is head of the cosmetic counsel (unpaid position) advisory to the Danish Environmental Protection Agency.

Figures

Figure 1
Figure 1
Comparison of skin sampling method. (a) A Venn diagram illustrating overlap of OTUs with ≥98% similarity and percent of sequence reads overlapping in parenthesis. (b) Violin plots illustrating Shannon alpha-diversity and Chao1 richness according to sampling method. (c) Scatter plots comparing the proportion of reads from a pair of samples from the same clade at the genus taxonomic level. Each sample is a pair of samples from the same skin site in the same individual, extracted with different kits. Pearson’s product moment and Spearman’s rank correlation were calculated for each plot.
Figure 2
Figure 2
Influence of DNA extraction kit on microbiome diversity and richness. (a) Violin plots illustrating Shannon alpha-diversity and Chao1 richness according to DNA extraction kit. (b) Tables with p-values from Kruskal-Wallis-tests corrected for multiple testing by the Benjamini-Hochberg procedure, bold and underlined when statistical significance.
Figure 3
Figure 3
Variation by skin site. (a) A heatmap of Bray-Curtis distances between samples, with metadata plotted on the axis above and color code to the right. 0 indicates that samples share the same OTU and 1 that they are totally different. (b) Violin plots illustrating Shannon alpha-diversity and Chao1 richness according to skin site, * when statistical significance in a Kruskal-Wallis-test corrected for multiple testing by the Benjamini-Hochberg procedure (p < 0.05). (c) Bar charts depicting relative abundances of bacteria at the order taxonomic level. Samples are sorted by skin site and number of kit used is assigned above the charts. Individual subject numbers is indicated by the colour bar at the bottom of the figure.
Figure 4
Figure 4
Reduction of host DNA does not influence microbial communities. (a) A MetaPhlAn2 clustered heatmap showing the distribution of microbes in the 12 samples, each representing one nasal sample from the kits applied (Table S2). Kit number is annotated along the x-axis and detected species-level names on the y-axis on the right side. (b) Percent viral DNA (x-axis) in the samples from each kit (y-axis). (c) Scatter plots illustrating Shannon alpha-diversity and Chao1 richness.

Similar articles

Cited by

References

    1. Sogin ML, et al. Microbial diversity in the deep sea and the underexplored “rare biosphere”. Proceedings of the National Academy of Sciences. 2006;103:12115–12120. doi: 10.1073/pnas.0605127103. - DOI - PMC - PubMed
    1. Salter SJ, et al. Reagent and laboratory contamination can critically impact sequence-based microbiome analyses. BMC biology. 2014;12:87. doi: 10.1186/s12915-014-0087-z. - DOI - PMC - PubMed
    1. de Goffau MC, et al. Recognizing the reagent microbiome. Nat Microbiol. 2018;3:851–853. doi: 10.1038/s41564-018-0202-y. - DOI - PubMed
    1. Hannigan GD, et al. Culture-Independent Pilot Study of Microbiota Colonizing Open Fractures and Association with Severity, Mechanism, Location, and Complication from Presentation to Early Outpatient Follow-Up. J. Orthop. Res. 2014;32:597–605. doi: 10.1002/jor.22578. - DOI - PMC - PubMed
    1. Altunbulakli Can, Reiger Matthias, Neumann Avidan U., Garzorz-Stark Natalie, Fleming Megan, Huelpuesch Claudia, Castro-Giner Francesc, Eyerich Kilian, Akdis Cezmi A., Traidl-Hoffmann Claudia. Relations between epidermal barrier dysregulation and Staphylococcus species–dominated microbiome dysbiosis in patients with atopic dermatitis. Journal of Allergy and Clinical Immunology. 2018;142(5):1643-1647.e12. doi: 10.1016/j.jaci.2018.07.005. - DOI - PubMed

Publication types