. 2019 Oct 18;9(26):8155-8170.
doi: 10.7150/thno.37023. eCollection 2019.

Proliferative regulation of alveolar epithelial type 2 progenitor cells by human Scnn1d gene

Affiliations

Proliferative regulation of alveolar epithelial type 2 progenitor cells by human Scnn1d gene

Runzhen Zhao et al. Theranostics. .

Abstract

Lung epithelial sodium channel (ENaC) encoded by Scnn1 genes is essential for maintaining transepithelial salt and fluid homeostasis in the airway and the lung. Compared to α, β, and γ subunits, the role of respiratory δ-ENaC has not been studied in vivo due to the lack of animal models. Methods: We characterized full-length human δ802-ENaC expressed in both Xenopus oocytes and humanized transgenic mice. AT2 proliferation and differentiation in 3D organoids were analysed with FACS and a confocal microscope. Both two-electrode voltage clamp and Ussing chamber systems were applied to digitize δ802-ENaC channel activity. Immunoblotting was utilized to analyse δ802-ENaC protein. Transcripts of individual ENaC subunits in human lung tissues were quantitated with qPCR. Results: The results indicate that δ802-ENaC functions as an amiloride-inhibitable Na+ channel. Inhibitory peptide α-13 distinguishes δ802- from α-type ENaC channels. Modified proteolysis of γ-ENaC by plasmin and aprotinin did not alter the inhibition of amiloride and α-13 peptide. Expression of δ802-ENaC at the apical membrane of respiratory epithelium was detected with biophysical features similar to those of heterologously expressed channels in oocytes. δ802-ENaC regulated alveologenesis through facilitating the proliferation of alveolar type 2 epithelial cells. Conclusion: The humanized mouse line conditionally expressing human δ802-ENaC is a novel model for studying the expression and function of this protein in vivo .

Keywords: alveolar type epithelial cells; epithelial sodium channels; humanized transgenic mouse line; self-renewal.


Conflict of interest statement

Competing Interests: The authors have declared that no competing interest exists.

Figures

Figure 1
Figure 1
Bioelectric features of full-length human δ802 epithelial sodium channels (ENaC) in Xenopus oocytes. (A) Representative current trace of human δ802βγ ENaC. The channel activity of heterologously expressed δ802βγ-ENaC was recorded in cells bathed with Na+-, Li+-, K+-, and Cs+-rich bath solutions, respectively. Holding potentials were stepped from -120 mV to +80 mV in an interval of 20 mV. Currents were digitized by the CLAMPEX in the presence and absence of ENaC inhibitor amiloride (10 μM) and then the amiloride-sensitive fractions at each membrane potential were generated with the CLAMPFIT. Dashed line indicates zero current level when the membrane potential was clamped to 0 mV. Scale bars show current level and recording time. (B) Current-voltage relationship of δ802βγ-ENaC. Average amiloride-inhibitable currents (Current) were plotted as a function of membrane potentials (Voltage). The reversible potentials are approximate +13 mV for Na+ ions, +7 mV for Li+ ions, -54 mV for K+ ions, and -116 mV for Cs+ ions. n=9. (C) Dose-response curve for amiloride. Accumulating doses of amiloride were perfused to oocytes expressing δ802βγ-ENaC. Current levels at each dose were plotted against applied dose of amiloride and then fitted raw data with the Hill equation to calculate IC50 value (1.69 ± 0.3 μM). n=17. Dashed line (red) is generated with the fitted parameters. (D) Comparison of amino acid sequences at the N-terminal tails of δ802 (full-length) and δ2 clones (previously known as δ2-ENaC). Letters in red font show the extended N-terminal tails and three different amino acid residues in the δ802 clone only. Data in (B) and (C) are mean ± s.e.m. The data were analyzed using one-way ANOVA followed by Tukey post hoc analysis.
Figure 2
Figure 2
Responses of δ802-ENaC-containing channels to α-13 inhibitory peptide. (A) Representative current trace of αβγ- (left), δ802βγ- (middle), and δ802αβγ-ENaC (right) expressed in Xenopus oocytes. The horizontal lines under α-13 (300 μM) and amiloride (10 μM) indicate the time for application. Scale bars at the left bottom corner are for time and current amplitude. The current traces were digitized at the membrane potential of -100 mV. (B) Average current amplitude at -100 mV for the three types of ENaC channels in the absence (basal) and presence of α-13 inhibitory peptide and amiloride. n=5. * P < 0.05 and ** P < 0.01 vs basal current levels or as indicated by the horizontal lines. (C) Concentration-effect relationship of α-13 inhibitory peptide on αβγ-ENaC channels. Dashed (for αβγ) and dotted lines (for δ802βγ) are generated by fitting the raw data points except the most right one for amiloride with the Hill equation. The retrieved IC50 values for α-13 inhibitory peptide are 0.1 ± 0.01 μM (n=4, Chi2 = 0.44, R2 = 0.993), and 0.04 ± 0.07 μM (n=3, Chi2 = 0.77, R2 = 0.86), respectively. * indicates the current levels in the presence of amiloride (10 μM). (D) Effects of δ-15 peptide corresponding to α-13 sequence. δ-15 peptide was designed by aligning the amino acid sequences of δ802- and α-ENaC subunits. The sequence of 15 amino acid residues corresponding to that of α-13 inhibitory peptide was synthesized (Figure S2). The same concentration (30 μM) was perfused to the oocytes expressing δ802βγ- and δ802αβγ-ENaC channels. Amiloride (10 μM) was added to confirm the expression of ENaC. Current data at -100 mV were mean ± s.e.m. ** P<0.01 vs basal levels. n=3.
Figure 3
Figure 3
Activation of δ802-containing ENaC channels by serine proteases. (A) Activation of δ802βγ ENaC expressed in Xenopus oocytes by two-chain urokinase plasminogen activator (tc-uPA). ENaC activity was measured at the membrane potential of -100 mV at defined time points post incubation with 10 μg/ml tc-uPA. n = 9-15. mean ± s.e.m. * P<0.05 vs data at the zero minute (min). (B) Time course of stimulatory effects of plasmin on δ802βγ-ENaC activity. n=12. * P<0.05. (C) Identification of subunit responsible for plasmin activation. Fold of amiloride-sensitive current (ASI) of ENaC-associated current in the presence of plasmin over that in the absence of plasmin was computed for oocytes expressing δ802+β+γ (δβγ), δ802 alone (δ), δ802+β(δβ), and δ802+γ (δγ). n = 12-15. * P<0.05. (D) Inhibitory effects of α-13 peptide on δ802αβγ- (δαβγ) and αβγ-ENaC activity post treatment of plasmin and aprotinin. Currents (I) at -100 mV were compared in the absence of amiloride (basal, open bar), presence of α-13 peptide (α13, closed bar), and amiloride (amil, grey bar). n=5. * P<0.05 vs basal currents, & P < 0.05 vs those in the presence of α-13 peptide. (E) Fractions of α-13 sensitive currents in cells pre-treated with plasmin and aprotinin. n=8. Control, without pre-treatment. (F) Cleavage of V5-tagged δ802- and γ-ENaC subunits by serine proteases. NI, non-injected oocytes as negative controls for ENaC expression. Oocytes incubated with chymotrypsin (CT, 10 μg/ml), plasmin (PI, 10 μg/ml) for 45 minutes at room temperature. Cells treated with the same volume of saline (‑) were controls for serine proteases.
Figure 4
Figure 4
Humanized mouse line with inducible expression of human δ802-ENaC. (A) Schematic design for developing humanized mouse strain. δ802-ENaC was labelled with epitope tags of HA at the N-terminal and His at the C-terminal ends. The tagged hSCNN1D construct (HA-δ802 ENaC-His) was inserted into Rosa26 allele. Two lox and one stop codon were placed just prior to this construct. (B) RT-PCR analysis of inducible expression of δ802-ENaC. 3× stop primers were used with a size of 1,070 bp. The size is 199bp after removal of 3× stop codons. From left to right are samples from wild type lungs, Scnn1d Tg lungs, sox2 Cre lungs, δ802Tg/Cre lungs, and a negative control in the absence of RT enzyme. (C) Transcripts of ENaC subunits in the lung. The mRNA level of four ENaC subunits was analyzed by real-time RT-PCR. * P<0.05 and *** P<0.001 vs wt control. n=3. (D) Immunofluorescent images of δ802 ENaC proteins in the lung. Lung sections were stained with DAPI (blue for nuclei) and anti-His tag antibody to recognize δ802 ENaC (red). Scale bar, 10 μm. From left to right are images for wild type (WT, left), Scnn1d Tg (Tg, middle), and δ802Tg/Cre lungs (Tg/Cre, right). Top panels are for alveolar type 1 (AT1) cells stained with AQP5 as a biomarker. Bottom panels are for alveolar type 2 (AT2) cells stained with sftpc as a biomarker. (E) Detection of δ802 ENaC expression at the protein level with Western blotting assays. Tissue lysates of wt, Scnn1d (Tg), and induced lungs (Tg/Cre) were probed with anti-HA antibody. (F) Immunoblotting biotinylated apical proteins recognized by anti-HA antibody. Top blots are for δ-ENaC in apical and cytosolic proteins. β-actin was used as loading controls and quality control for biotinylation. These blots represent three experiments with similar results.
Figure 5
Figure 5
Functional analysis of δ802 ENaC activity in mouse tracheal epithelial (MTE) and alveolar type 2 (mAT2) monolayers. (A) Short-circuit current traces (Isc) in MTE monolayers mounted on an Ussing chamber setup for uninduced δ802Tg (Control, black line) and induced δ802Tg/Cre (δ-ENaC, red line). Primary MTE cells were cultured at the air-liquid interface for 13-15 days. n=3. Arrows indicate the time to add designed concentrations of amiloride. (B) Dose-response relationship of amiloride for δ-ENaC expressing MTE monolayers and controls. Raw data were fitted with the logistic function to compute ki values for amiloride. The resulting ki values were 0.68 ± 0.00 μM and 3.04 ± 0.26 μM, respectively, for control and δ-ENaC group. Data collected when cells were bathed with Na+-free solution were included but not used for fitting curves. n=5. (C) Representative Isc traces for control and δ-ENaC mAT2 monolayer cells. Accumulating amiloride from 1 to 1,000 μM were applied as indicated by arrows. (D) Dose-response curve for amiloride in mAT2 cells. (E) Transepithelial resistance measured with an EVOM meter. Resistance was read with a chopstick meter when the culture medium was replaced every other day. n=7, *** P<0.001 vs controls. (F) Representative Isc traces for α-13 peptide inhibition. α-13 inhibitory peptide (300 μM) was added to the apical counterpart followed by amiloride and finally by Na+-free bath solution as indicated. (G) Average Isc levels in the presence and absence of α-13 inhibitory peptide (300 μM), amiloride (100 μM), and Na+ ions (150 mM). n=6. * P<0.05 vs control. (H) Isc fractions associated with αβγ-ENaC and δ802βγ-ENaC subpopulations as computed as α-13 inhibitable (α-13 peptide sensitive) and the component inhibited by amiloride and removal of bath Na+ ions (α-13 peptide resistant). n=6. * P<0.05 vs controls. (I) α-13 and amiloride-sensitive alveolar fluid clearance in human lungs ex vivo. n=5 per group. * P<0.5 vs control. Data were presented as mean ± s.e.m., mean difference between two groups was computed by student t-test in (E-H).
Figure 6
Figure 6
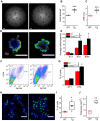
Contribution of δ802-ENaC to progenitor mAT2 cell-mediated alveologenesis. (A) DIC images of mAT2 organoids. Primary mAT2 cells of δ802Tg (left) and δ802Tg/Cre mice (right) were grown in 3D Matrigel for 7 days. Scale bar, 1 mm. (B) Organoid number per well. n=6. *** P<0.001. (C) Colony forming efficiency (CFE) of mAT2 cells. n=12. *** P<0.001. (D) Confocal imagines of organoids formed by mAT2 from δ802Tg (left) and δ802Tg/Cre mice. Scale bar, 100 μm. Organoids were stained with DAPI (blue), PDPN antibody for AT1 cells (red), and anti-sftpc antibody for AT2 cells (green). (E) AT2 renewal and differentiation into AT1 cells. n=6 organoids. * P<0.05 vs WT group. (F) FACS assay of AT1 and AT2 cells in organoids. Representative FACS analysis of AT1 (ICAM+) and AT2 (EpCAM+) cells for WT (left) and δ802Tg/Cre group (right). n=3. (G) % of AT1 and 2 cells. n=6. * P<0.05. (H) EdU stain of mAT2 monolayers for WT (left) and δ802Tg/Cre groups (right). Polarized mAT2 monolayers on day 7 post seeding were stained with EdU (green). (I) % of EdU+ cells. n=6 monolayers per group. * P<0.05. Student t-test. (J) Total surface area of organoids per well. n=6. ** P<0.01.

References

    1. Canessa CM, Schild L, Buell G, Thorens B, Gautschi I, Horisberger JD. et al. Amiloride-sensitive epithelial Na+ channel is made of three homologous subunits. Nature. 1994;367:463–7. - PubMed
    1. Waldmann R, Champigny G, Bassilana F, Voilley N, Lazdunski M. Molecular cloning and functional expression of a novel amiloride-sensitive Na+ channel. J Biol Chem. 1995;270:27411–4. - PubMed
    1. Lingueglia E, Voilley N, Waldmann R, Lazdunski M, Barbry P. Expression cloning of an epithelial amiloride-sensitive Na+ channel. A new channel type with homologies to Caenorhabditis elegans degenerins. FEBS Lett. 1993;318:95–9. - PubMed
    1. Ji HL, Benos DJ. Degenerin sites mediate proton activation of deltabetagamma-epithelial sodium channel. J Biol Chem. 2004;279:26939–47. - PubMed
    1. Chalfie M, Wolinsky E. The identification and suppression of inherited neurodegeneration in Caenorhabditis elegans. Nature. 1990;345:410–6. - PubMed

Publication types

Substances