. 2019 Oct 22;9(26):8344-8361.
doi: 10.7150/thno.30707. eCollection 2019.

p300/CBP inhibitor A-485 alleviates acute liver injury by regulating macrophage activation and polarization

Affiliations

p300/CBP inhibitor A-485 alleviates acute liver injury by regulating macrophage activation and polarization

Jinjin Peng et al. Theranostics. .

Abstract

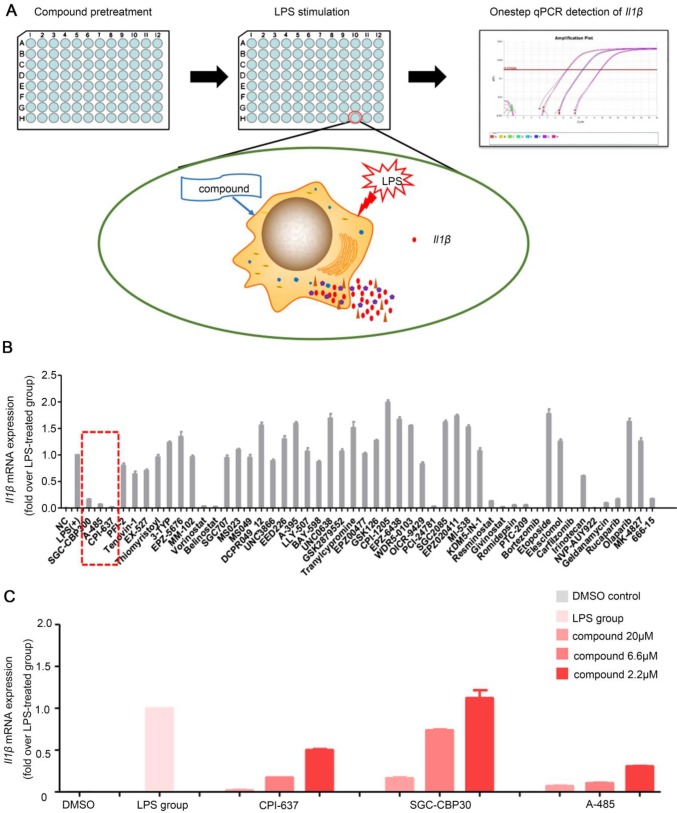
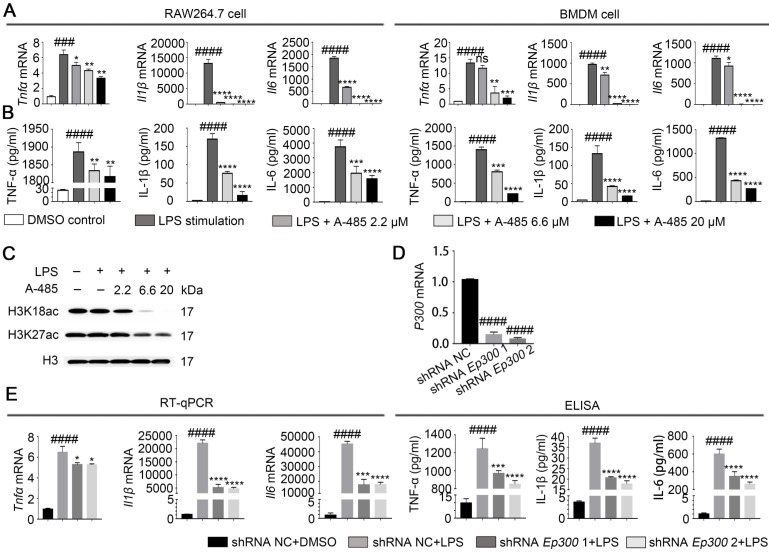
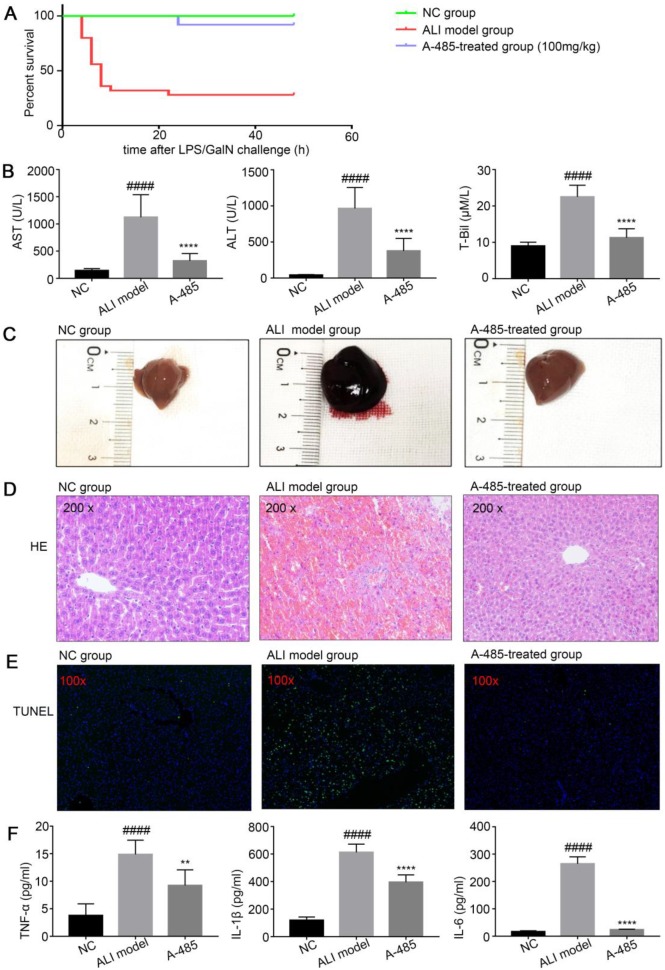
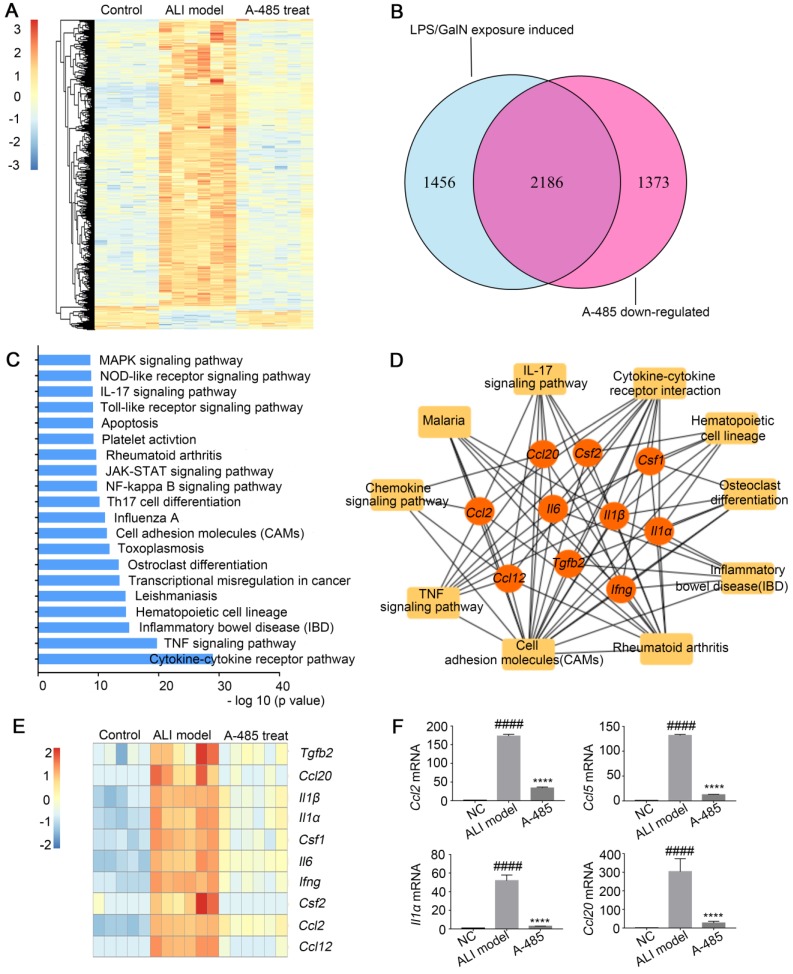
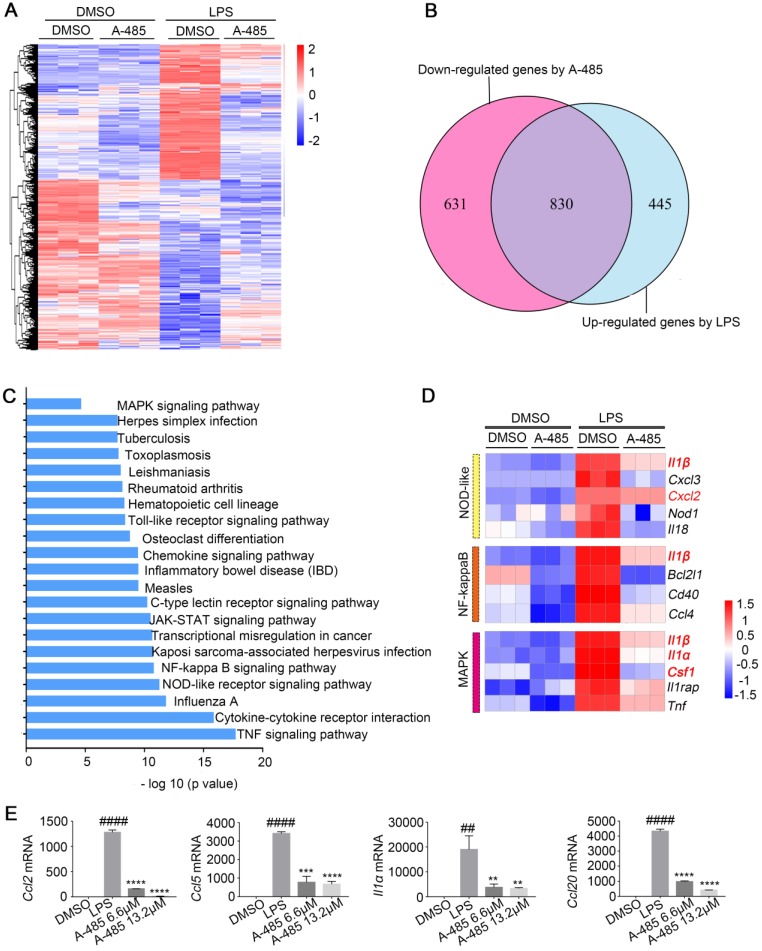
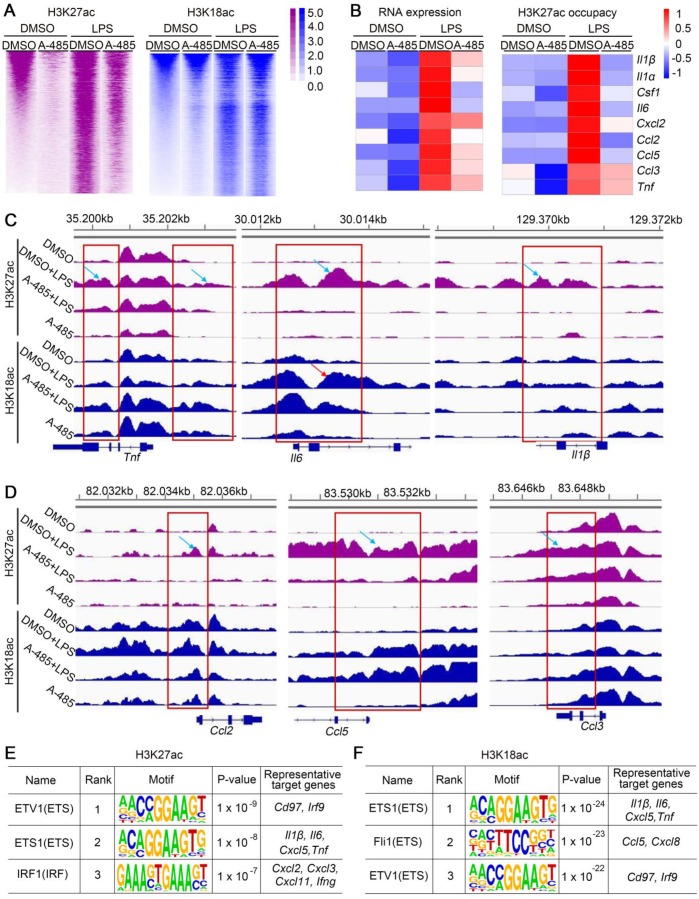
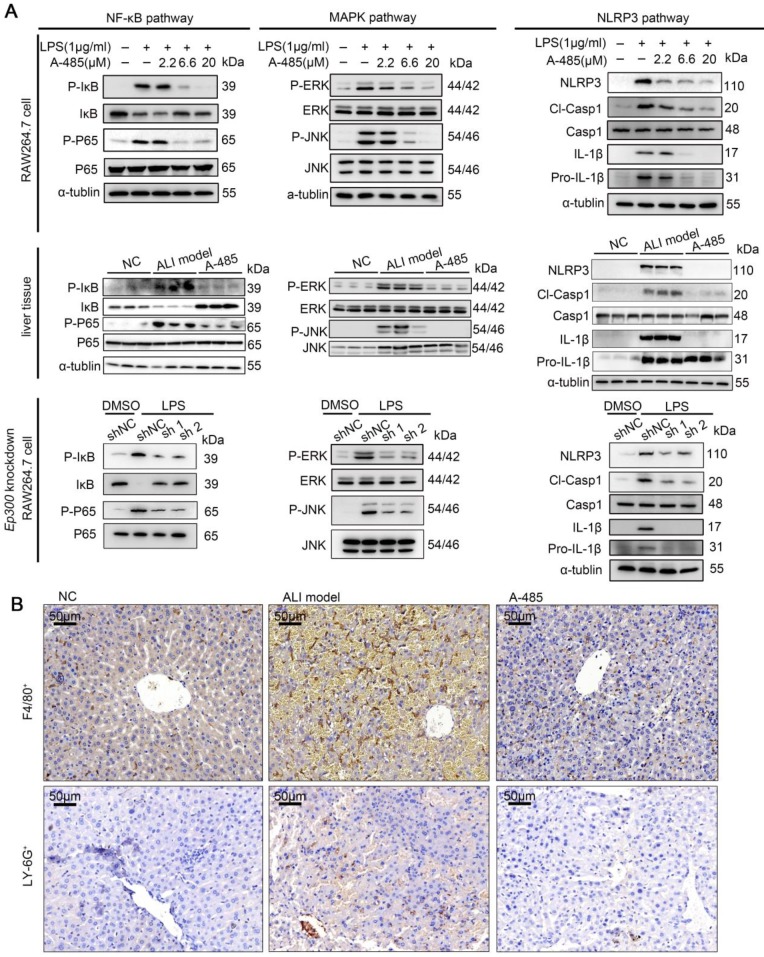
High morbidity and mortality are associated with acute liver injury (ALI) for which no effective targeted drugs or pharmacotherapies are available. Discovery of potential therapeutic targets as well as inhibitors that can alleviate ALI is imperative. As excessive inflammatory cytokines released by macrophages are a critical cause of liver injury, we aimed to find novel compounds that could inhibit macrophage expression of inflammatory cytokines and alleviate liver injury. Methods: A high throughput assay was established to screen a small molecule inhibitor library of epigenetic targets. A highly selective catalytic p300/CBP inhibitor A-485 was identified as a potent hit in vitro and administrated to the lipopolysaccharide (LPS)/D-galactosamine (GalN)-induced mice in vivo. For in vitro analysis, RAW264.7 cells and primary BMDM cells exposed to LPS were co-incubated with A-485. A model of acute liver injury induced by LPS and GalN was used for evaluation of in vivo treatment efficacy. Results: A-485 inhibited LPS-induced inflammatory cytokine expression in a concentration-dependent manner in vitro. Significantly, A-485 administration alleviated histopathological abnormalities, lowered plasma aminotransferases, and improved the survival rate in the LPS/GalN-stimulated mice. Integrative ChIP-Seq and transcriptome analysis in the ALI animal model and macrophages revealed that A-485 preferentially blocked transcriptional activation of a broad set of pathologic genes enriched in inflammation-related signaling networks. Significant inhibition of H3K27ac/H3K18ac at promoter regions of these pivotal inflammatory genes was observed, in line with their suppressed transcription after A-485 treatment. Reduced expression of these pathological pro-inflammatory genes resulted in a decrease in inflammatory pathway activation, M1 polarization as well as reduced leukocyte infiltration in ALI mouse model, which accounted for the protective effects of A-485 on liver injury. Conclusion: Using a novel strategy targeting macrophage inflammatory activation and cytokine expression, we established a high-throughput screening assay to discover potential candidates for ALI treatment. We demonstrated that A-485, which targeted pathological inflammatory signaling networks at the level of chromatin, was pharmacologically effective in vivo and in vitro. Our study thus provided a novel target as well as a potential drug candidate for the treatment of liver injury and possibly for other acute inflammatory diseases.

Keywords: acetyltransferase inhibitor; epigenetics; inflammation; liver injury; macrophages.


Conflict of interest statement

Competing Interests: The authors have declared that no competing interest exists.

Figures

Figure 1
Figure 1
One-step RT-qPCR identified a selective catalytic p300/CBP inhibitor A-485 that decreased LPS-stimulated macrophage Il1β production. (A) Flow chart of the high-throughput screening assay for small-molecule inhibitors of macrophage activation and cytokine expression. (B) Results of high-throughput screening using a library containing 50 small-molecule probes. Inhibitors highlighted by dashed line in red are categorized as p300/CBP inhibitors. (C) Effects of p300/CBP inhibitors. SGC-CBP30, CPI-673, and A-485 are inhibitors of p300/CBP, inhibiting the bromodomain (SGC-CBP30 and CPI-673) or the histone acetyltransferase domain (A-485). The RT-qPCR data were normalized to a reference gene, Gapdh, and are shown as mean ± SD based on three independent experiments.
Figure 2
Figure 2
A-485 inhibited inflammatory responses through inhibition of the catalytic function of p300. (A) RAW264.7 and BMDM cells were treated with LPS and A-485 for 4 h, after which the Tnfα, Il1β, and Il6 mRNAs were quantified by RT-qPCR analysis. (B) RAW264.7 and BMDM cells were treated with LPS and A-485 for 24 h. The TNF-α, IL-1β and IL-6 concentrations in culture supernatants were determined by ELISA. (C) Western blot analysis of H3K27 and H3K18 acetylation in LPS-challenged RAW264.7 cells. (D) The knockdown efficiency of shRNAs targeting Ep300 in RAW264.7 cells at the mRNA level. (E) RT-qPCR analysis of Tnfα, Il1β and Il6 mRNA in Ep300 knockdown and DMSO control RAW264.7 cells stimulated with LPS for 4 h (E, Left). TNF-α, IL-1β, and IL-6 concentrations in culture supernatants were detected by ELISA after stimulating with LPS for 24 h (E, Right). (n=3) Data are shown as mean ± SD. ns P>0.05, *P<0.05, **P<0.01, ***P<0.001 and ****P<0.0001 vs LPS group, ### P<0.001 and ####P<0.0001 vs control group.
Figure 3
Figure 3
A-485 exerted protective effects on the LPS/GalN-induced ALI model in mice. (A) Survival curves for mice from the NC group (n=15), ALI model group (n=25), and A-485-treated group (n=25). (B) Serum ALT, AST, and T-Bil in mice from the NC group, ALI model group, and A-485-treated group (n=15). (C) Morphological changes of livers in mice from the indicated groups. (D and E) Histological examination of liver tissues. H&E (D) and TUNEL (E) staining of liver tissues of mice from the indicated groups. (F) ELISA detected the TNF-α, IL-1β, and IL-6 concentrations in liver tissues (n=6). Data are shown as mean ± SD. ****P<0.0001 vs ALI model group, ####P<0.0001 vs control group.
Figure 4
Figure 4
A-485 regulated inflammatory gene expression in vivo as determined by RNA sequencing. (A-D) RNA-seq analysis was performed on liver tissues extracted from mice in the control (n=5), ALI model (n=6), and A-485-treated groups (n=6). (A) The heat map of genes with adjusted P value <0.05, and absolute value of log2 fold-change >1.5. (B) Venn diagram showing the overlap between the gene set of LPS/GalN-induced upregulated genes and the gene set subsequently downregulated by A-485 in vivo. (C) KEGG pathway analysis using differentially expressed genes between the LPS/GalN-exposed ALI group and the control group, showing that the most significantly enriched pathways are related to the inflammatory response. (D) Visualization of inflammation network and top 10 hub genes. Inflammatory gene network was constructed by mapping genes from the top 10 most significantly affected pathways to the PPI network using Maximal Clique Centrality method. (E) Heat map of top 10 hub genes. (F) RT-qPCR analysis was performed to validate the repression of hub genes by A-485 (n=5). Data are shown as mean ± SD. ****P<0.0001 vs ALI model group, ####P<0.0001 vs control group.
Figure 5
Figure 5
A-485 regulated inflammatory gene expression in RAW264.7 cells as determined by RNA sequencing. (A-E) RNA-seq analysis was performed using RAW264.7 cells treated with DMSO or LPS (1 μg/ml) for 4 h, or treated with LPS and A-485 (13.2 μM) for 4 h (n=3). (A) Heat map of genes with adjusted P value <0.05, and absolute value of log2 fold-change >1.5. (B) Venn diagram showing the overlap between the LPS-induced genes and the genes whose activation was reduced by A-485. (C) KEGG pathway analysis using differentially expressed genes between the LPS-exposed and A-485-treated groups. (D) Heat map of representative key genes in the NF-κB signaling pathway, NOD-like receptor signaling pathway, and MAPK signaling pathway. Hub genes are highlighted in red. (E) RT-qPCR analysis was performed to validate the repression of hub genes by A-485 (n=3). Data are shown as mean ± SD. **P<0.01, ***P<0.001 and ****P<0.0001 vs ALI model group; ##P<0.01, and ####P<0.0001 vs DMSO group.
Figure 6
Figure 6
A-485 suppressed H3K27ac and/or H3K18ac density at promoter regions of pivotal pro-inflammatory genes. (A) Heat map displaying ChIP-Seq signal enrichment changes in H3K27ac (left) and H3K18ac (right) between indicated groups. (B) Heat map of gene expression (left) and H3K27ac occupancy (right) of representative inflammatory genes. (C-D) Read density of H3K27ac and H3K18ac at pivotal cytokine and chemokine genes (such as Tnf, Il6, Il1β, Ccl2, Ccl5, and Ccl3) in macrophages from four indicated groups. Gene tracks were visualized using Integrative Genomics Viewer. (E-F) Top 3 most enriched A-485 affected motifs in H3K27ac ChIP-seq data (E) and H3K18ac ChIP-seq data (F). Representative target genes for these TF are identified using ENCODE Transcription Factor Binding Site Profiles database, CHEA Transcription Factor Targets database and Cistrome Data Browser.
Figure 7
Figure 7
A-485 inhibited activation of inflammatory pathways and inflammatory cell infiltration. (A) Western blotting was performed to validate the activation of NF-κB, MAPK and NLRP3 signaling pathways in RAW264.7 cells, liver tissues, and Ep300 knockdown RAW264.7 cells. (B) Immunohistochemical staining of macrophages (F4/80+) and neutrophils (LY-6G+) within liver tissue.

References

    1. Kim SJ, Lee SM. NLRP3 inflammasome activation in D-galactosamine and lipopolysaccharide-induced acute liver failure: role of heme oxygenase-1. Free Radic Biol Med. 2013;65:997–1004. - PubMed
    1. Thawley V. Acute Liver Injury and Failure. Vet Clin North Am Small Anim Pract. 2017;47:617–30. - PubMed
    1. Possamai LA, Thursz MR, Wendon JA, Antoniades CG. Modulation of monocyte/macrophage function: a therapeutic strategy in the treatment of acute liver failure. J Hepatol. 2014;61:439–45. - PubMed
    1. Sica A, Mantovani A. Macrophage plasticity and polarization: in vivo veritas. J Clin Invest. 2012;122:787–95. - PMC - PubMed
    1. Sica A, Invernizzi P, Mantovani A. Macrophage plasticity and polarization in liver homeostasis and pathology. Hepatology. 2014;59:2034–42. - PubMed

Publication types

MeSH terms