. 2019 Nov 13:8:100.
doi: 10.1038/s41377-019-0210-6. eCollection 2019.

Satellite UV-Vis spectroscopy: implications for air quality trends and their driving forces in China during 2005-2017

Affiliations

Satellite UV-Vis spectroscopy: implications for air quality trends and their driving forces in China during 2005-2017

Chengxin Zhang et al. Light Sci Appl. .

Abstract

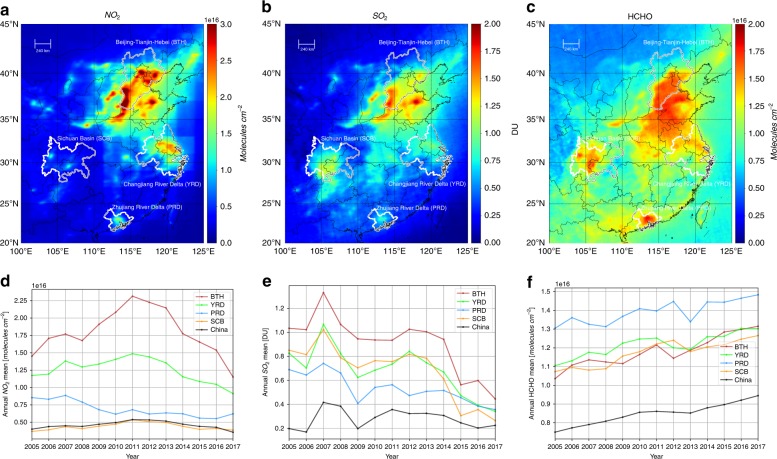
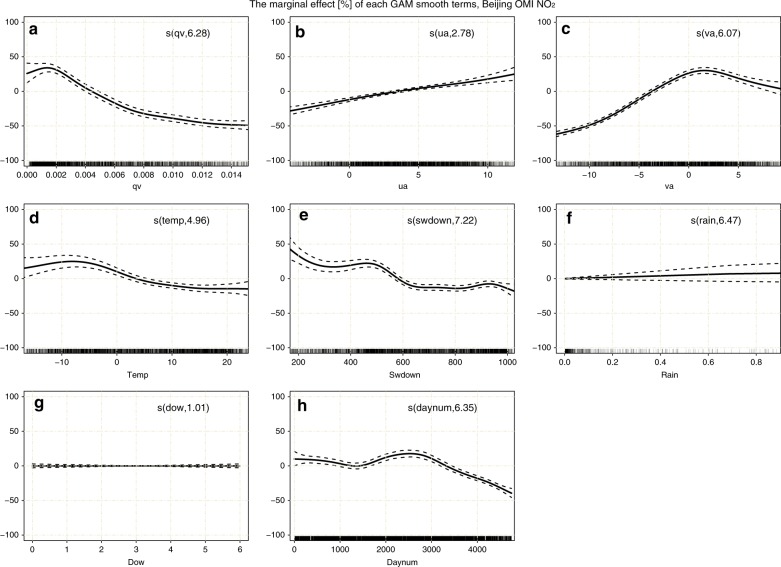
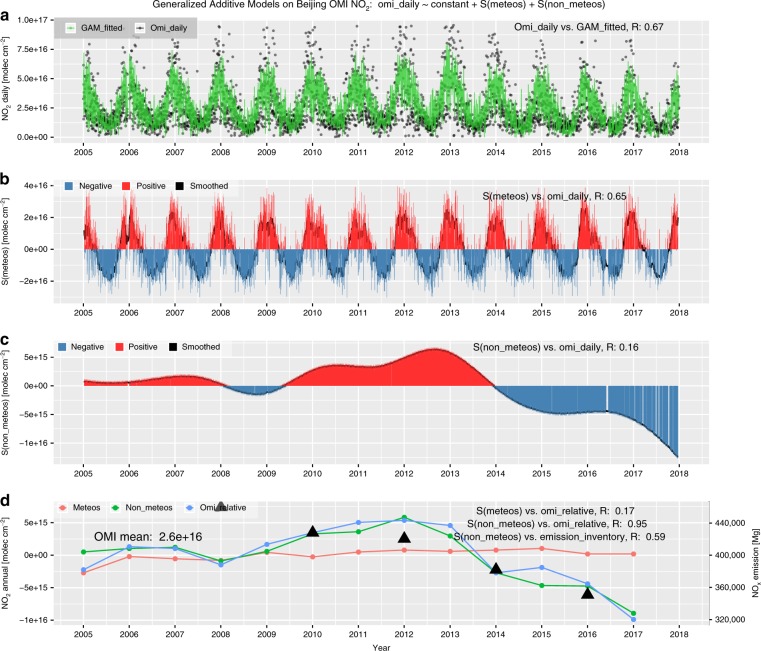
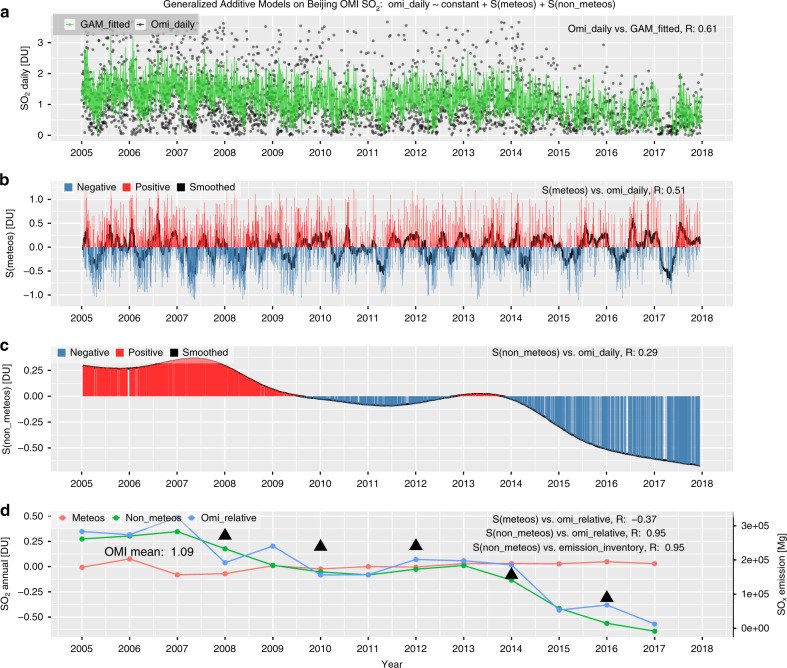
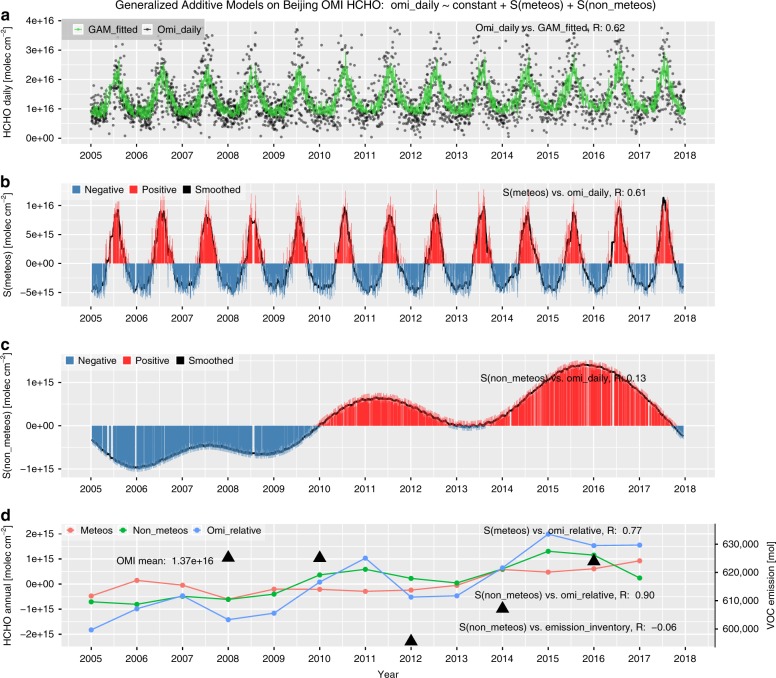
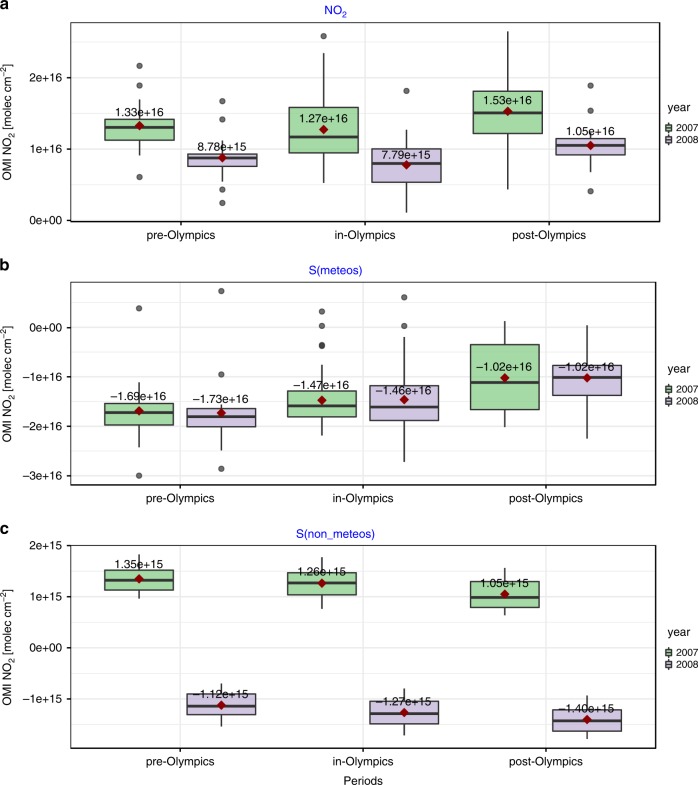
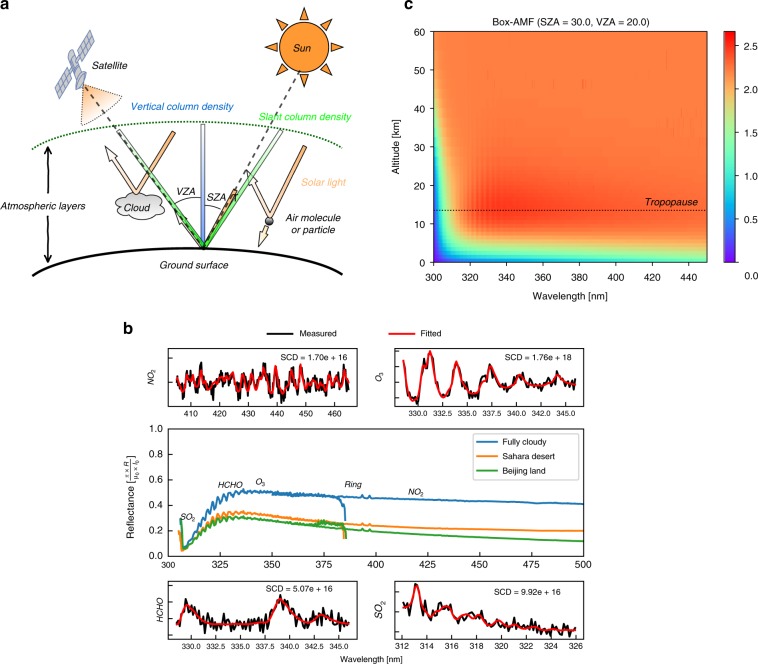
Abundances of a range of air pollutants can be inferred from satellite UV-Vis spectroscopy measurements by using the unique absorption signatures of gas species. Here, we implemented several spectral fitting methods to retrieve tropospheric NO2, SO2, and HCHO from the ozone monitoring instrument (OMI), with radiative simulations providing necessary information on the interactions of scattered solar light within the atmosphere. We analyzed the spatial distribution and temporal trends of satellite-observed air pollutants over eastern China during 2005-2017, especially in heavily polluted regions. We found significant decreasing trends in NO2 and SO2 since 2011 over most regions, despite varying temporal features and turning points. In contrast, an overall increasing trend was identified for tropospheric HCHO over these regions in recent years. Furthermore, generalized additive models were implemented to understand the driving forces of air quality trends in China and assess the effectiveness of emission controls. Our results indicated that although meteorological parameters, such as wind, water vapor, solar radiation and temperature, mainly dominated the day-to-day and seasonal fluctuations in air pollutants, anthropogenic emissions played a unique role in the long-term variation in the ambient concentrations of NO2, SO2, and HCHO in the past 13 years. Generally, recent declines in NO2 and SO2 could be attributed to emission reductions due to effective air quality policies, and the opposite trends in HCHO may urge the need to control anthropogenic volatile organic compound (VOC) emissions.

Keywords: Atmospheric optics; Optical spectroscopy.


Conflict of interest statement

Conflict of interestThe authors declare that they have no conflict of interest.

Figures

Fig. 1
Fig. 1. The spatiotemporal characteristics of OMI-measured pollutant concentrations.
ac Tropospheric mean VCDs during 2005–2017 for NO2, SO2, and HCHO, respectively. The regional boundaries of BTH, YRD, PRD and SCB are delineated by gray lines. df The corresponding annual mean VCDs for NO2, SO2, and HCHO, respectively. Note that the mean values for the four regions and China are shown by different colors
Fig. 2
Fig. 2. Plots of the marginal effects of individual covariates in the GAM on daily tropospheric NO2 in Beijing.
a–h Covariates of qv, ua, va, temp, swdown, rain, dow, and daynum are shown in the panels. The EDF for the GAM smooth term is noted inside the bracket of the text. Each marginal effect is denoted by a solid line with a 95% confidence interval (dashed lines), and the vertical lines adjacent to the lower x-axis represent the distributions of these covariates
Fig. 3
Fig. 3. Time series components by GAMs of the tropospheric NO2 column over Beijing.
a NO2 daily series of both OMI-measured and GAM-fitted data, as indicated by black dots and a green line, respectively. b The bar plot of the daily series of accumulated meteorological smooth terms, i.e., S(meteos), where positive and negative S(meteos) are indicated with red and blue, respectively, while the black solid line denotes the smoothed series using a moving average with a window of 15 days. c same as b but for the non-meteorological terms, i.e., S(non-meteos). d Interannual series of S(meteos), S(non-meteos), and relative NOx variation compared to the overall mean, as shown with red, green, and blue dotted lines, respectively, while the triangular dots denote the MEIC NOx emissions over Beijing, corresponding to the right y-axis
Fig. 4
Fig. 4. Similar to Fig. 3 but for tropospheric SO2 in Beijing.
a SO daily series of both OMI-measured and GAM-fitted data, as indicated by black dots and a green line, respectively. b The bar plot of the daily series of accumulated meteorological smooth terms, i.e., S(meteos), where positive and negative S(meteos) are indicated with red and blue, respectively, while the black solid line denotes the smoothed series using a moving average with a window of 15 days. c Same as b but for the non-meteorological terms, i.e., S(non-meteos). d Interannual series of S(meteos), S(non-meteos), and relative SO2 variation compared to the overall mean, as shown with red, green, and blue dotted lines, respectively, while the triangular dots denote the MEIC SO2 emissions over Beijing, corresponding to the right y-axis
Fig. 5
Fig. 5. Similar to Fig. 3 but for tropospheric HCHO in Beijing.
a HCHO daily series of both OMI-measured and GAM-fitted data, as indicated by black dots and a green line, respectively. b The bar plot of the daily series of accumulated meteorological smooth terms, i.e., S(meteos), where positive and negative S(meteos) are indicated with red and blue, respectively, while the black solid line denotes the smoothed series using a moving average with a window of 15 days. c Same as b but for the non-meteorological terms, i.e., S(non-meteos). d Interannual series of S(meteos), S(non-meteos), and relative HCHO variation compared to the overall mean, as shown with red, green, and blue dotted lines, respectively, while the triangular dots denote the MEIC VOCs emissions over Beijing, corresponding to the right y-axis
Fig. 6
Fig. 6. The box plots of period-averaged components of GAM NO2 modeling before, during, and after the Beijing Summer Olympics in 2008.
The GAM components, such as OMI NO2, S(meteos), and S(non-meteos), are presented in a, b, and c, respectively. Within each box plot, the lower and upper bounds correspond to the 25th and 75th quartiles, while the solid line represents the median; the top and bottom whiskers extend from the hinges to the largest values by no more than 1.5* IQR (interquartile range) from the hinges. The mean values are noted by red square points with numbers. The black points outside the whisker are outliers
Fig. 7
Fig. 7. Illustration of the satellite spectroscopy principle of trace gas retrieval.
a The viewing geometry of a typical satellite UV-Vis instrument and atmospheric radiation transfer processes, including absorption, reflection, and scattering. The definitions of the satellite solar zenith angle (SZA) and viewing zenith angle (VZA) and the slant column density (SCD) and vertical column density (VCD) of trace gases are noted. b An example of OMI-measured top-of-atmosphere reflectance in the UV2 and VIS1 channels is shown in the middle panel under different surface conditions, and the DOAS fitting of the SCDs of NO2, O3, HCHO and SO2 at different wavelength ranges are shown in four surrounding panels. c The altitude-resolved box AMF as a function of spectral wavelength. The tropopause height is denoted with a dotted line. The box AMF was calculated by the VLIDORT model for a satellite nadir viewing geometry of SZA = 30°; VZA = 20°; surface albedo of 0.075; and typical atmospheric profiles of pressure, temperature, O3 and NO2 from the U.S. Standard Atmosphere for mid-latitude summer

References

    1. Seinfeld, J. H. & Pandis, S. N. Atmospheric Chemistry and Physics: from Air Pollution to Climate Change (John Wiley & Sons, Hoboken, 2016).
    1. Atkinson R. Atmospheric chemistry of VOCs and NOx. Atmos. Environ. 2000;34:2063–2101. doi: 10.1016/S1352-2310(99)00460-4. - DOI
    1. Schroeder JR, et al. New insights into the column CH2O/NO2 ratio as an indicator of near-surface ozone sensitivity. J. Geophys. Res. 2017;122:8885–8907.
    1. Wang C, et al. Sources and potential photochemical roles of formaldehyde in an urban atmosphere in South China. J. Geophys. Res. 2017;122:11934–11947. doi: 10.1002/2017jd027266. - DOI
    1. Huang RJ, et al. High secondary aerosol contribution to particulate pollution during haze events in China. Nature. 2014;514:218–222. doi: 10.1038/nature13774. - DOI - PubMed