. 2019 Nov 20:8:102.
doi: 10.1038/s41377-019-0216-0. eCollection 2019.

Deep spectral learning for label-free optical imaging oximetry with uncertainty quantification

Affiliations

Deep spectral learning for label-free optical imaging oximetry with uncertainty quantification

Rongrong Liu et al. Light Sci Appl. .

Abstract

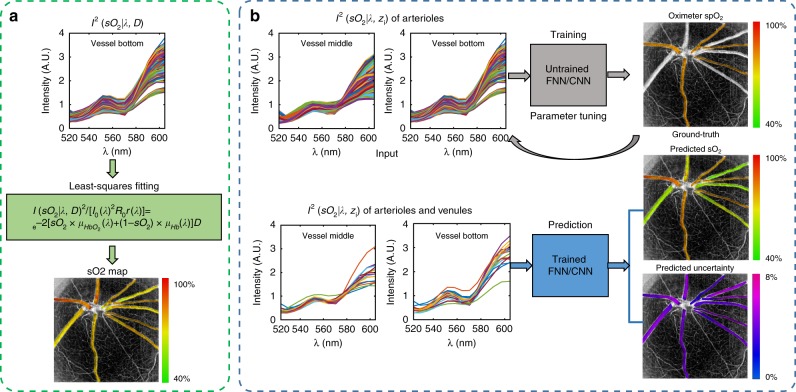
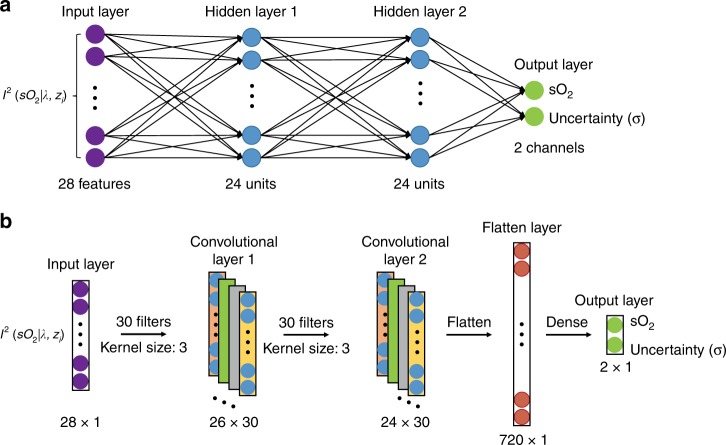
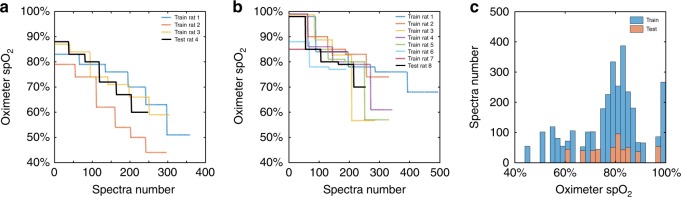
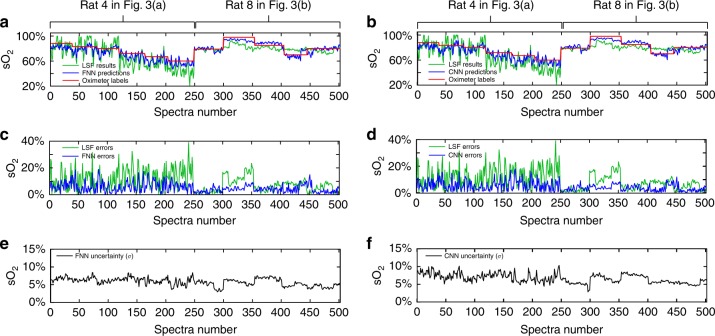
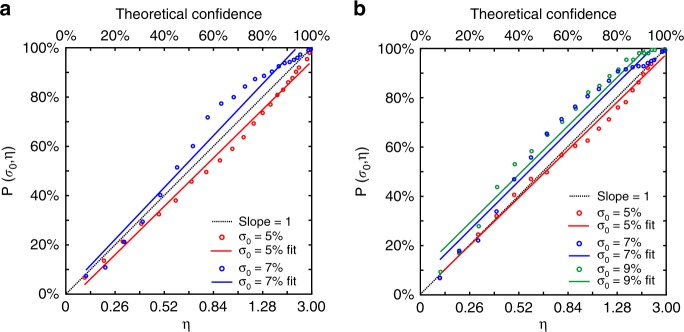
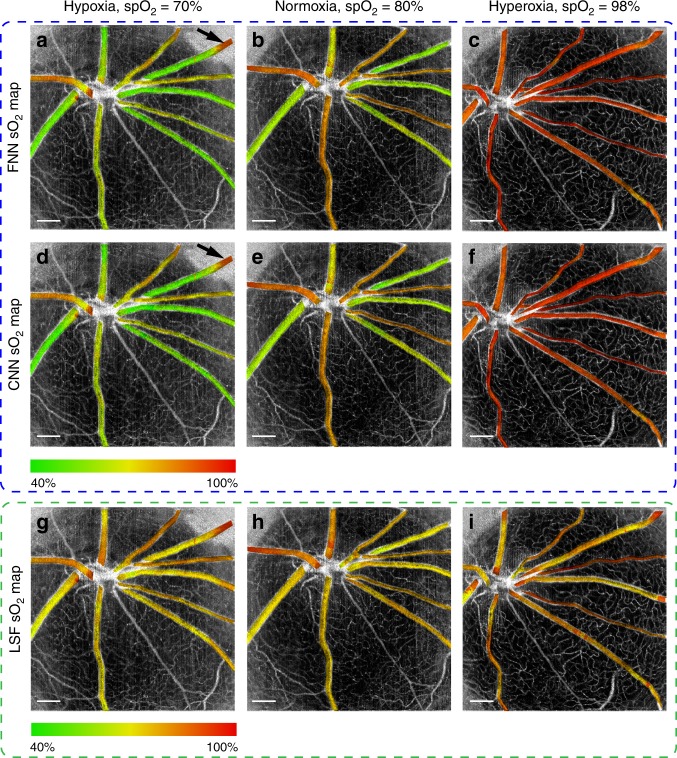
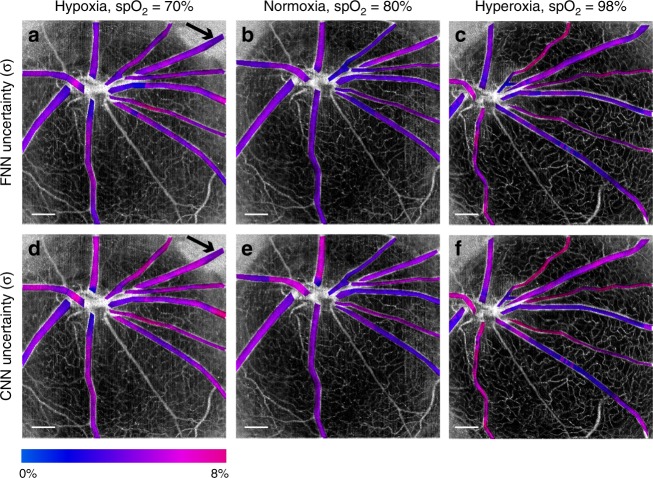
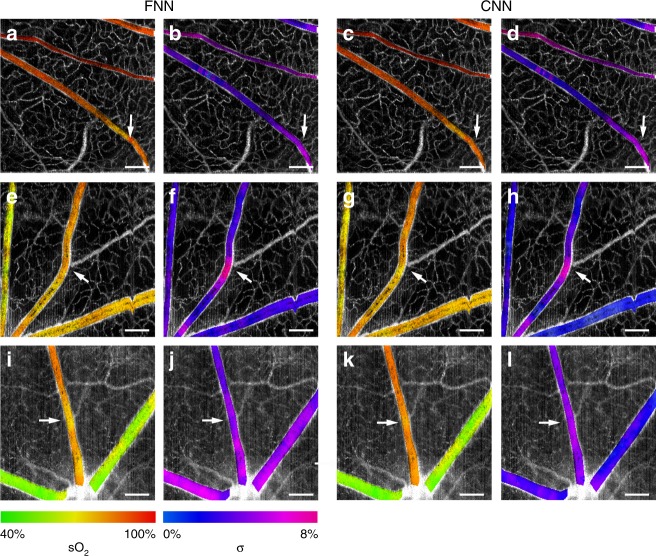
Measurement of blood oxygen saturation (sO2) by optical imaging oximetry provides invaluable insight into local tissue functions and metabolism. Despite different embodiments and modalities, all label-free optical-imaging oximetry techniques utilize the same principle of sO2-dependent spectral contrast from haemoglobin. Traditional approaches for quantifying sO2 often rely on analytical models that are fitted by the spectral measurements. These approaches in practice suffer from uncertainties due to biological variability, tissue geometry, light scattering, systemic spectral bias, and variations in the experimental conditions. Here, we propose a new data-driven approach, termed deep spectral learning (DSL), to achieve oximetry that is highly robust to experimental variations and, more importantly, able to provide uncertainty quantification for each sO2 prediction. To demonstrate the robustness and generalizability of DSL, we analyse data from two visible light optical coherence tomography (vis-OCT) setups across two separate in vivo experiments on rat retinas. Predictions made by DSL are highly adaptive to experimental variabilities as well as the depth-dependent backscattering spectra. Two neural-network-based models are tested and compared with the traditional least-squares fitting (LSF) method. The DSL-predicted sO2 shows significantly lower mean-square errors than those of the LSF. For the first time, we have demonstrated en face maps of retinal oximetry along with a pixel-wise confidence assessment. Our DSL overcomes several limitations of traditional approaches and provides a more flexible, robust, and reliable deep learning approach for in vivo non-invasive label-free optical oximetry.

Keywords: Imaging and sensing; Interference microscopy; Optical spectroscopy.


Conflict of interest statement

Conflict of interestThe authors declare that they have no conflict of interest.

Figures

Fig. 1
Fig. 1
Methods for calculating retinal blood vessel sO2 by a the traditional LSF and b our neural-network-based DSL with uncertainty quantification. Traditional LSF optimizes a rigid parametric model to best fit the spectral measurements for sO2. DSL bypasses any rigid models and trains neural networks with paired arterial spectra and oximeter spO2 readings as the ground truth. After training, the neural network models predict both sO2 and its uncertainty.
Fig. 2
Fig. 2
Structures of the FNN model a and the CNN model b for sO2 prediction, with uncertainty quantified by the predicted standard deviation σ.
Fig. 3
Fig. 3. Oximeter spO2 readings (ground truth labels) for training and testing.
a The readings of rat retinal arterioles from normoxia to hypoxia from ref. . b The readings of rat retinal arterioles from hyperoxia, 5% CO2, normoxia to hypoxia from ref. . c Histograms of all spO2 readings for both the training and testing sets.
Fig. 4
Fig. 4. Rat retinal arteriolar sO2 of the testing data under different ventilation conditions predicted by the FNN, CNN, and LSF models.
sO2 predicted by the FNN a and CNN b, compared with the oximeter spO2 readings and LSF calculations. Errors of sO2 predicted by the FNN c and the CNN d model compared to the LSF results. Predicted uncertainties of sO2 obtained by the FNN e and the CNN f model measured by the standard deviations (σ). The first 248 spectra were from ref. , and the rest were from ref. .
Fig. 5
Fig. 5. Statistical analysis of the sO2 predictions with the quantified uncertainty.
a The linear fits of P(σ0, η) to η and the confidence for the FNN model when the uncertainty measured by the standard deviation (σ0) is 5% and 7%. b The same graph for the CNN model when the standard deviation (σ0) is 5%, 7%, and 9%.
Fig. 6
Fig. 6
The en face sO2 maps of the testing data for rat retinal oximetry obtained by the FNN ac, CNN df and LSF gi at hypoxia in a, d and g, normoxia in b, e and h, and hyperoxia in c, f and i. The oximeter spO2 readings at hypoxia, normoxia, and hyperoxia are 70%, 80%, and 98%, respectively. Black arrows in a and d point to a region with inconsistent sO2 predictions in the same vessel. Scale bar: 500 μm.
Fig. 7
Fig. 7. The en face uncertainty (σ) maps for sO2 predictions corresponding to Fig. 6a, f.
ac Uncertainty maps predicted by the FNN model under three ventilation conditions. df Uncertainty maps obtained by the CNN model under three ventilation conditions. Black arrows in a and d point to a region with inconsistent sO2 predictions in the same vessel. Scale bar: 500 μm.
Fig. 8
Fig. 8. Zoomed-in views of the sO2 and the corresponding uncertainty maps.
ad The sO2 and uncertainty at hyperoxia obtained by the FNN and CNN, respectively, with spO2 = 98%. eh The sO2 and uncertainty at normoxia obtained by the FNN and CNN, respectively, with spO2 = 76%. il The sO2 and uncertainty at normoxia obtained by the FNN and CNN, respectively, with spO2 = 80%. Scale bar: 500 μm. Arrows point to the locations where sO2 prediction shows inconsistency within a vessel, which are successfully detected by increased uncertainty levels in the corresponding uncertainty map.

Similar articles

Cited by

References

    1. Stefánsson E. Ocular oxygenation and the treatment of diabetic retinopathy. Surv. Ophthalmol. 2006;51:364–380. doi: 10.1016/j.survophthal.2006.04.005. - DOI - PubMed
    1. Vajkoczy P, Ullrich A, Menger MD. Intravital fluorescence videomicroscopy to study tumor angiogenesis and microcirculation. Neoplasia. 2002;2:53–61. doi: 10.1038/sj.neo.7900062. - DOI - PMC - PubMed
    1. Levy BI, et al. Impaired tissue perfu37sion: a pathology common to hypertension, obesity, and diabetes mellitus. Circulation. 2008;118:968–976. doi: 10.1161/CIRCULATIONAHA.107.763730. - DOI - PubMed
    1. Edwards-Richards A, et al. Capillary rarefaction: an early marker of microvascular disease in young hemodialysis patients. Clin. Kidney J. 2014;7:569–574. doi: 10.1093/ckj/sfu106. - DOI - PMC - PubMed
    1. Kalaria RN. Neurodegenerative disease: diabetes, microvascular pathology and Alzheimer disease. Nat. Rev. Neurol. Vol. 2009;5:305–306. doi: 10.1038/nrneurol.2009.72. - DOI - PubMed