. 2019 Nov 18:4:48.
doi: 10.1038/s41392-019-0084-3. eCollection 2019.

Chemical compound cinobufotalin potently induces FOXO1-stimulated cisplatin sensitivity by antagonizing its binding partner MYH9

Affiliations

Chemical compound cinobufotalin potently induces FOXO1-stimulated cisplatin sensitivity by antagonizing its binding partner MYH9

YongHao Li et al. Signal Transduct Target Ther. .

Abstract

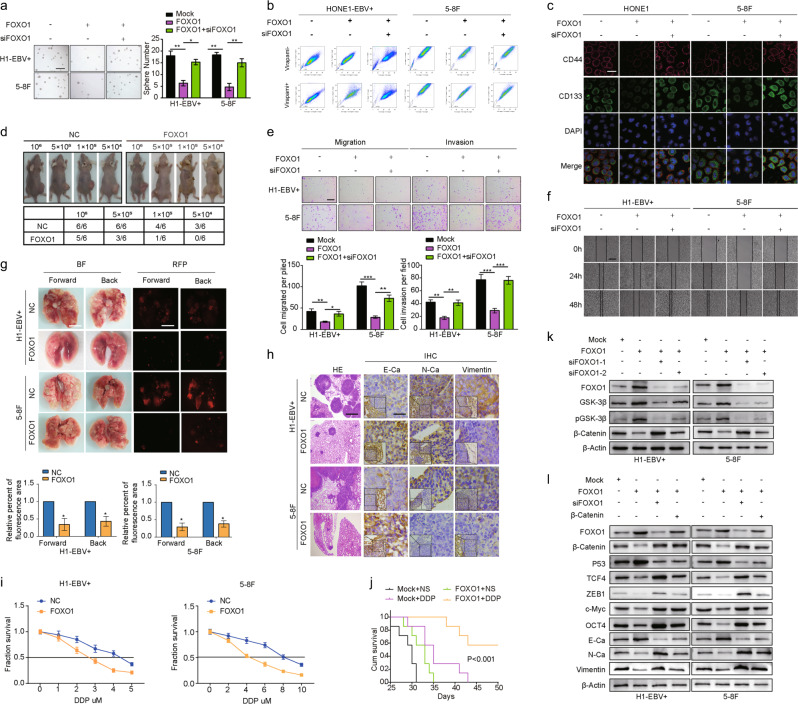
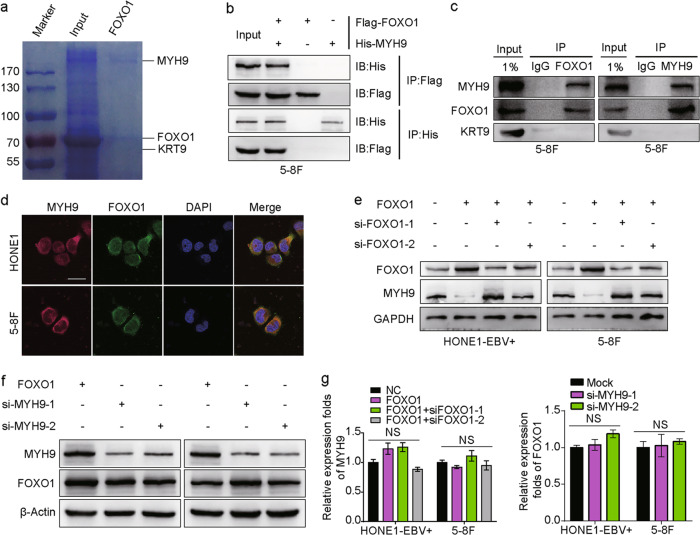
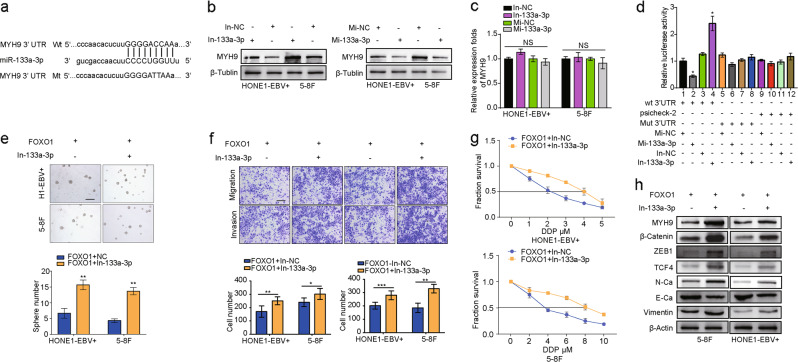
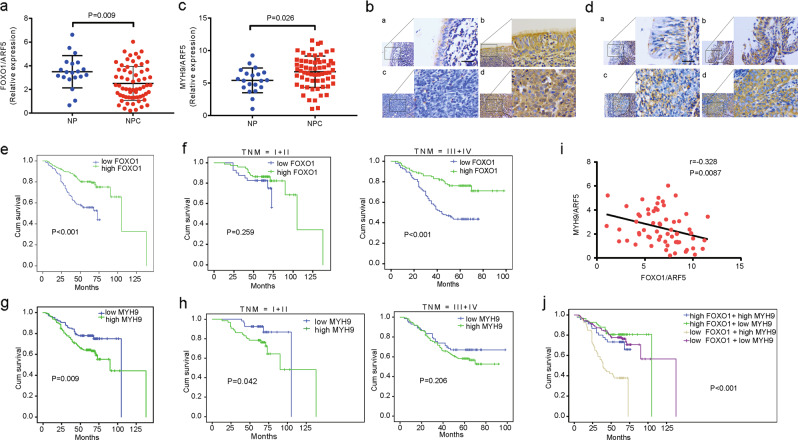
In this study, we present novel molecular mechanisms by which FOXO1 functions as a tumor suppressor to prevent the pathogenesis of nasopharyngeal carcinoma (NPC). First, we observed that FOXO1 not only controlled tumor stemness and metastasis, but also sensitized NPC cells to cisplatin (DDP) in vitro and in vivo. Mechanistic studies demonstrated that FOXO1-induced miR-200b expression through the GSK3β/β-catenin/TCF4 network-mediated stimulation of ZEB1, which reduced tumor stemness and the epithelial-mesenchymal transition (EMT) signal. Furthermore, we observed FOXO1 interaction with MYH9 and suppression of MYH9 expression by modulating the PI3K/AKT/c-Myc/P53/miR-133a-3p pathway. Decreased MYH9 expression not only reduced its interactions with GSK3β, but also attenuated TRAF6 expression, which then decreased the ubiquitin-mediated degradation of GSK3β protein. Increased GSK3β expression stimulated the β-catenin/TCF4/ZEB1/miR-200b network, which increased the downstream tumor stemness and EMT signals. Subsequently, we observed that chemically synthesized cinobufotalin (CB) strongly increased FOXO1-induced DDP chemosensitivity by reducing MYH9 expression, and the reduction in MYH9 modulated GSK3β/β-catenin and its downstream tumor stemness and EMT signal in NPC. In clinical samples, the combination of low FOXO1 expression and high MYH9 expression indicated the worst overall survival rates. Our studies demonstrated that CB potently induced FOXO1-mediated DDP sensitivity by antagonizing its binding partner MYH9 to modulate tumor stemness in NPC.

Keywords: Cancer genomics; Cancer stem cells; Head and neck cancer.


Conflict of interest statement

Competing interestsThe authors declare no competing interests.

Figures

Fig. 1
Fig. 1
FOXO1 attenuates the stemness, migration, invasion and DDP chemoresistance of NPC cells in vitro and in vivo. a Sphere-forming assay (scale bar: 500 μm.), side population assay (b), immunofluorescence discrimination assay (c, scale bar: 25 μm), migration assay, invasion assays (e, scale bar: 200 μm) and scratch assays (f, scale bar: 200 μm) of NPC cells were performed after transfection with NC, NC, and/or FOXO1 lentiviral vector, or siRNA as indicated. Student’s t-test. Mean ± s.d. **P < 0.01; ***P < 0.001. d The in vivo effect of FOXO1 was evaluated in xenograft mouse models bearing tumors originating from HONE1-EBV + and 5–8F cells, n = 6/group. g Pulmonary metastases were assessed following mouse tail vein injections of HONE1-EBV + and 5–8F cells, n = 6/group. h Representative H&E staining and IHC staining for E-Ca, N-Ca, and Vimentin in primary tumor tissues are shown. Scale bar: 60 mm. i Dose–response curves of HONE1-EBV + and 5–8F cells treated with NC or FOXO1 48 h after treatment with DDP. A parametric generalized linear model with random effects is shown. j Survival analysis showed cumulative overall survival time ranked low to high, as follows: Mock + NS < Mock + DDP < FOXO1 + NS < FOXO1 + DDP, n = 5/group. Log-rank tests were used for analysis. k FOXO1, GSK3β, p-GSK3β, and β-catenin were measured by western blot after transfection with mock and FOXO1 vectors, siFOXO1–1, and siFOXO1–2 as indicated. β-Actin served as a loading control. l FOXO1, β-catenin, P53, TCF4, ZEB1, c-Myc, OCT4, E-Ca, N-Ca, and Vimentin were measured by western blot after transfection with mock and FOXO1 vectors, siFOXO1, and β-catenin as indicated. β-Actin served as a loading control
Fig. 2
Fig. 2
Interaction between FOXO1 and MYH9 in NPC cells. a Coomassie brilliant blue staining showed the proteins that interacted with FOXO1 in 5–8F cells and the molecular weights of FOXO1, KRT9 and MYH9. b Co-IP experiments detected the interaction of exogenous FOXO1 and MYH9 in 5–8F cells. c Co-IP experiments detected the interaction of endogenous FOXO1 and MYH9 in 5–8F cells. d Cytosolic colocalization of FOXO1 protein and MYH9 protein in NPC cells is visualized by immunofluorescence staining. Scale bar, 25 μm. e MYH9 and FOXO1 expression after FOXO1 was overexpressed or knocked down is shown by western blot analysis. f FOXO1 and MYH9 expression after MYH9 was knocked down is shown by western blot analysis. g MYH9 mRNA expression is shown after FOXO1 overexpression and knockdown; FOXO1 expression is shown after MYH9 knockdown, and data are normalized to ARF5. One-way ANOVA and Dunnett multiple comparison tests were used for analysis
Fig. 3
Fig. 3
miR-133a-3p directly targets MYH9 to inactivate the Wnt/β-catenin signal. a Bioinformatics analysis revealed that the 3’UTR of MYH9 was well matched with the seed sequence of miR-133a-3p. Mutants were generated in the binding region of the MYH9 3’UTR. b MYH9 protein levels in miR-133a-3p-overexpressing/suppressing 5–8F cells and HONE1-EBV + cells were detected by western blot analysis. c MYH9 mRNA levels in miR-133a-3p-overexpressing/suppressing 5–8F cells and HONE1-EBV + cells were detected by qPCR assays. d miR-133a-3p directly targets MYH9, as confirmed by a dual-luciferase reporter assay. One-way ANOVA and Dunnett multiple comparison tests were used for analysis. *P < 0.05. Sphere-forming assay (e, scale bar: 500 μm), migration assay, invasion assays (f, scale bar: 200 μm) and IC50 (g) of NPC cells were performed after transfection with a FOXO1 lentiviral vector or miR-133a-3p inhibitor as indicated. Student’s t-tests were used for analysis. Mean ± s.d., *P < 0.05; **P < 0.01; ***P < 0.001. h Expression of MYH9, β-catenin, ZEB1, TCF4, N-Ca, E-Ca, and Vimentin following miR-133a-3p suppression in FOXO1-overexpressing NPC cells. Abbreviations: Mi-133a-3p: miR-133a-3p mimics; In-133a-3p: miR-133a-3p inhibitor
Fig. 4
Fig. 4
MYH9 interacts with GSK3β and degrades GSK3β by ubiquitination in FOXO1-overexpressing NPC cells. a Co-IP detected the interaction of exogenous GSK3β and MYH9 in 5–8F cells. b Cytosolic colocalization of GSK3β protein and MYH9 protein in NPC cells was visualized by immunofluorescence staining. Scale bar, 25 μm. c GSK3β expression was measured in MYH9-overexpressing NPC cells; one-way ANOVA and Dunnett’s multiple comparison test were used for analysis. d, e Western blotting and quantification analysis were performed to analyze the effect of MYH9 overexpression on GSK3β and β-catenin stability in NPC cells treated with cycloheximide at different time points and with the presence of MG132. f Coimmunoprecipitation analysis of the effect of FOXO1 and MYH9 on the interaction between GSK3β, MYH9, ubiquitin, and TRAF6 in FOXO1-overexpressing NPC cells. g Coimmunoprecipitation analysis of GSK3β, TRAF6, and ubiquitin in NPC cells treated with wild-type GSK3β or mutant GSK3β. h Nuclear and cytoplasmic extraction assays showed protein levels of β-catenin in the nucleus and cytoplasm of FOXO1-overexpressing NPC cells
Fig. 5
Fig. 5
Cinobufotalin increased the sensitivity of FOXO1-overexpressing NPC cells to DDP. a Dose–response curves are shown for HONE1-EBV + -FOXO1 and 5–8F-FOXO1 after treatment with DDP and/or CB for 48 h. b Survival analysis data show the cumulative overall survival time of mice in the FOXO1 + DDP group, FOXO1 + CB-treated group, FOXO1 + DDP + CB group and control group (n = 10, log-rank test). c Mean weight of mice in the FOXO1 + DDP group, FOXO1 + CB-treated group, FOXO1 + DDP + CB group and control group (n = 10, log-rank test) are shown. Sphere-forming assay (d, scale bar: 500 μm), migration assay, invasion assays (e, scale bar: 200 μm) and scratch assays (f, scale bar: 200 μm) of NPC cells were performed after transfection with the FOXO1 lentiviral vector and CB (750 nM) as indicated. Student’s t-test. Mean ± s.d. *P < 0.05; **P < 0.01; ***P < 0.001. g Expression levels of MYH9, PI3K, p-PI3K, AKT, p-AKT, C-Myc, P53, β-catenin, GSK3β, p-GSK3β, and ubiquitin in FOXO1-suppressed NPC cells treated with CB. h MYH9 expression was measured in FOXO1-suppressed NPC cells treated with CB; data are normalized to ARF. One-way ANOVA and Dunnett multiple comparison tests were used for analysis. **P < 0.01 ***P < 0.001. i miR-133a-3p expression was measured in FOXO1-suppressed NPC cells treated with CB; data are normalized to U6. One-way ANOVA and Dunnett multiple comparison test. *P < 0.05 ***P < 0.001. j Expression levels of PI3K, p-PI3K, AKT, p-AKT, C-Myc, P53, and MYH9 in FOXO1-suppressed NPC cells treated with CB. k Amplification of mir-133a-3p-binding sites after Ch-IP using an antibody against P53 in FOXO1-suppressed NPC cells treated with CB. An IgG antibody was used as the negative control. Student’s t-test. Mean ± s.d. *P < 0.05; **P < 0.01. l Expression of N-Ca, E-Ca and Vimentin, OCT4, SOX2, and β-actin following CB treatment in FOXO1-suppressed NPC cells
Fig. 6
Fig. 6
Pathoclinical features of FOXO1 and MYH9 expression and their correlation. a Levels of FOXO1 were detected by qPCR in NP and NPC tissue specimens; data are normalized to the ARF5. Student’s t-tests were used for analysis, mean ± s.d., P = 0.009. b IHC staining of FOXO1 in NPC tissues and NP tissues; a: low expression of FOXO1 in NP tissues; b: strong staining of FOXO1 in NP tissues; c: negative expression of FOXO1 in NPC samples; d: strong staining of FOXO1 in NPC samples. Scale bar, 40 μm. c Levels of MYH9 were detected by qPCR in NPC and NP tissue specimens; data are normalized to ARF5. Student’s t-tests were used for analysis, mean ± s.d., P = 0.026. d IHC staining of MYH9 in NPC tissues and NP tissues; a: low expression of MYH9 in NP tissues; b: strong staining of MYH9 in NP tissues; c: negative expression of MYH9 in NPC samples; d: strong staining of MYH9 in NPC samples. Scale bar, 40 μm. e Kaplan–Meier survival analysis of the overall survival of 321 NPC patients on the basis of FOXO1 expression. A log-rank test was used to calculate P-values, P < 0.001. f A stratified analysis was calculated for the overall survival of 321 NPC patients based on FOXO1 expression levels. A log-rank test was used to calculate P-values; P = 0.259; P < 0.001. g Kaplan–Meier survival analysis is shown for the overall survival of 321 NPC patients on the basis of MYH9 expression. A log-rank test was used to calculate P-values, P = 0.009. h A stratified analysis was calculated for the overall survival of 321 NPC patients based on MYH9 expression levels. A log-rank test was used to calculate P-values, P = 0.042; P = 0.206. i Correlations between FOXO1 and MYH9 expression levels were calculated. Two-tailed Spearman’s correlation analysis was performed. Mean ± s.d. P = 0.0087; r = –0.328. j Kaplan–Meier survival analysis of the overall survival of 321 NPC patients on the basis of FOXO1 and MYH9 expression. A log-rank test was used to calculate P-values, P < 0.001

References

    1. Oikawa T. Cancer Stem cells and their cellular origins in primary liver and biliary tract cancers. Hepatology. 2016;64:645–651. doi: 10.1002/hep.28485. - DOI - PubMed
    1. Batlle E, Clevers H. Cancer stem cells revisited. Nat. Med. 2017;23:1124–1134. doi: 10.1038/nm.4409. - DOI - PubMed
    1. Kalluri R, Weinberg RA. The basics of epithelial-mesenchymal transition. J. Clin. Invest. 2009;119:1420–1428. doi: 10.1172/JCI39104. - DOI - PMC - PubMed
    1. Peixoto P, et al. EMT is associated with an epigenetic signature of ECM remodeling genes. Cell Death Dis. 2019;10:205. doi: 10.1038/s41419-019-1397-4. - DOI - PMC - PubMed
    1. Shibue T, Weinberg RA. EMT, CSCs, and drug resistance: the mechanistic link and clinical implications. Nat. Rev. Clin. Oncol. 2017;14:611–629. doi: 10.1038/nrclinonc.2017.44. - DOI - PMC - PubMed

Publication types