. 2019 Nov 14:2:414.
doi: 10.1038/s42003-019-0666-1. eCollection 2019.

Metabolic gene alterations impact the clinical aggressiveness and drug responses of 32 human cancers

Affiliations

Metabolic gene alterations impact the clinical aggressiveness and drug responses of 32 human cancers

Musalula Sinkala et al. Commun Biol. .

Abstract

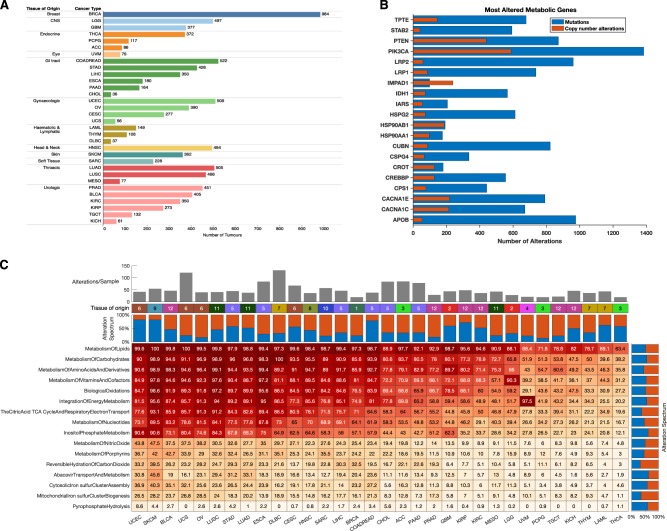
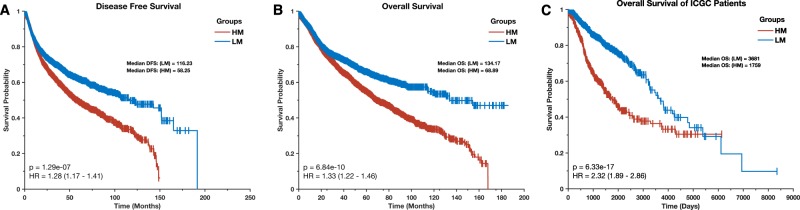
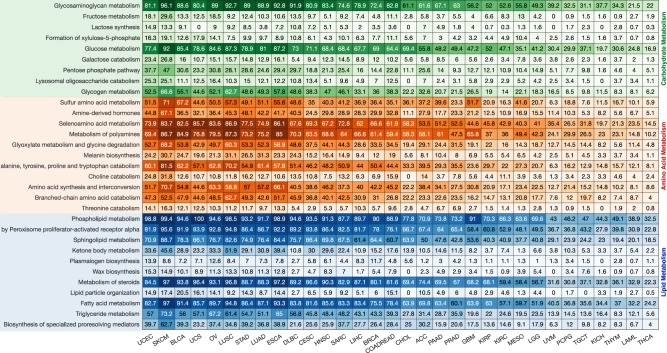
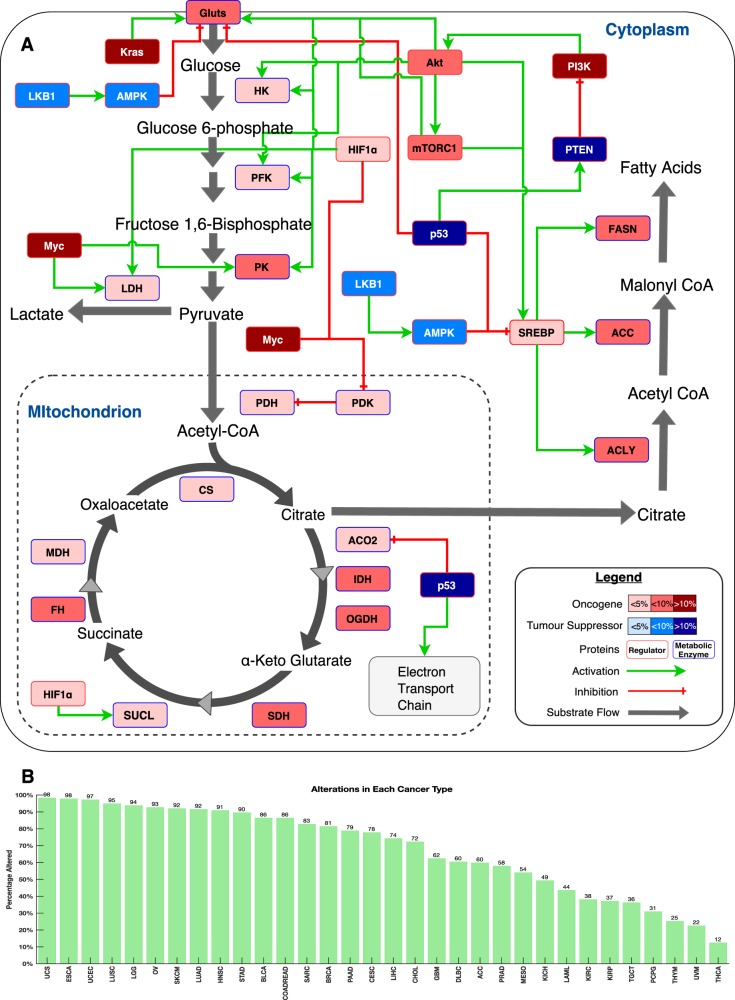
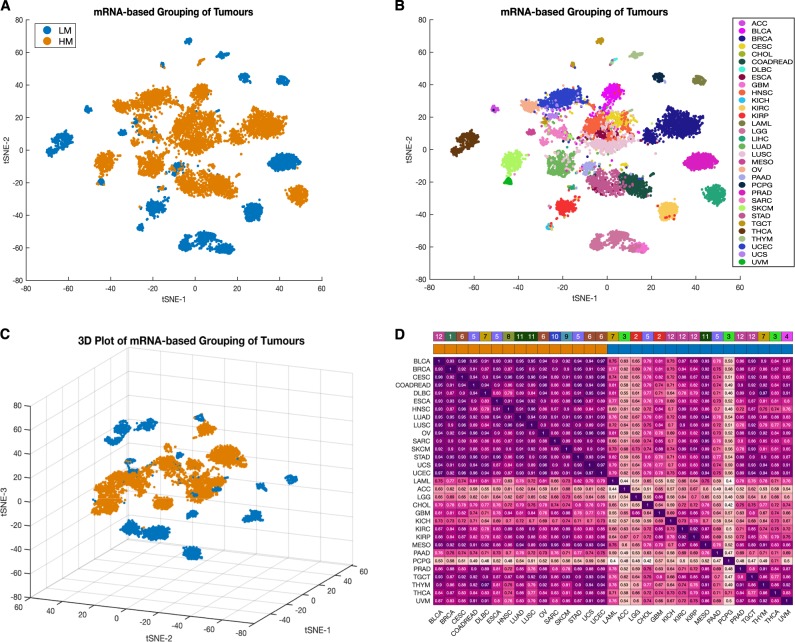
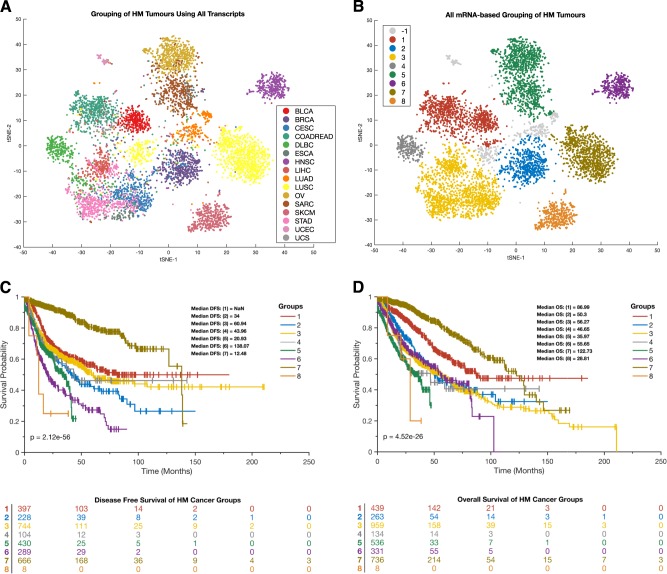
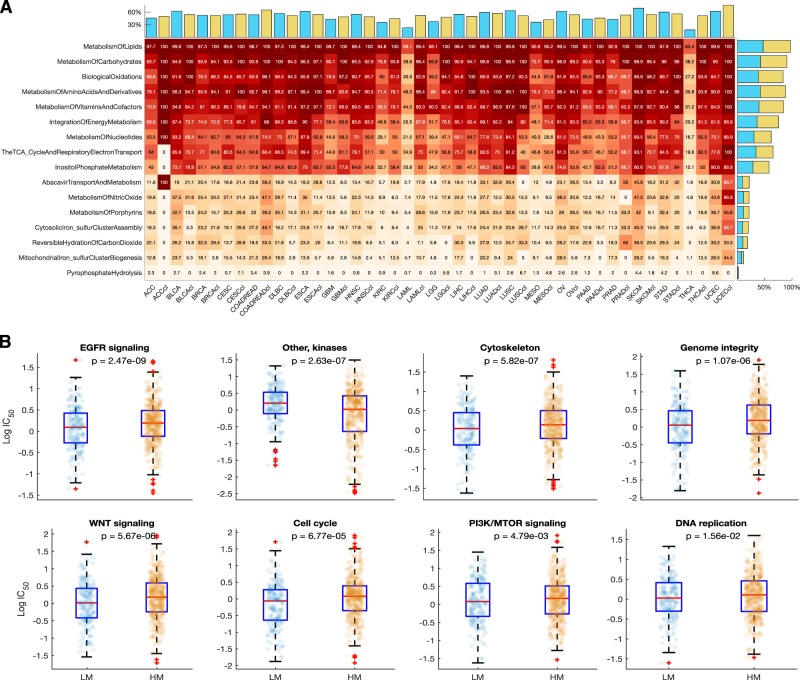
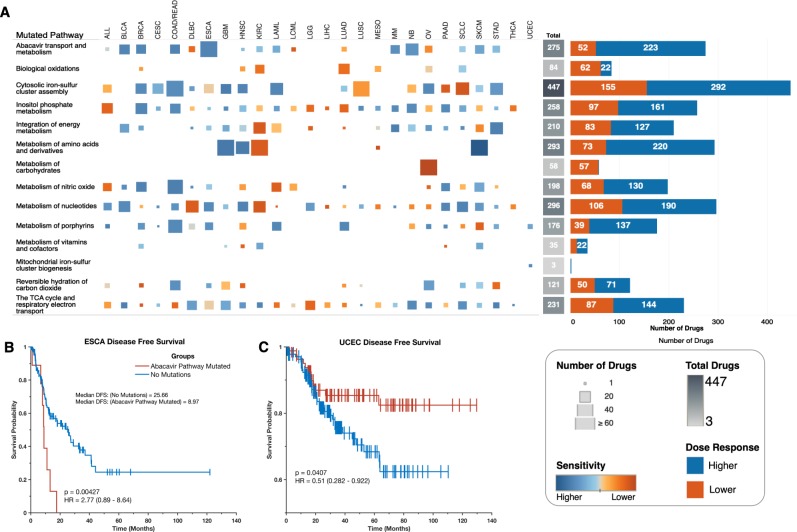
Malignant cells reconfigure their metabolism to support oncogenic processes such as accelerated growth and proliferation. The mechanisms by which this occurs likely involve alterations to genes that encode metabolic enzymes. Here, using genomics data for 10,528 tumours of 32 different cancer types, we characterise the alterations of genes involved in various metabolic pathways. We find that mutations and copy number variations of metabolic genes are pervasive across all human cancers. Based on the frequencies of metabolic gene alterations, we further find that there are two distinct cancer supertypes that tend to be associated with different clinical outcomes. By utilising the known dose-response profiles of 825 cancer cell lines, we infer that cancers belonging to these supertypes are likely to respond differently to various anticancer drugs. Collectively our analyses define the foundational metabolic features of different cancer supertypes and subtypes upon which discriminatory strategies for treating particular tumours could be constructed.

Keywords: Biochemical reaction networks; Cancer genomics; Data integration; Tumour heterogeneity.


Conflict of interest statement

Competing interestsThe authors declare no competing interests.

Figures

Fig. 1
Fig. 1
a Distribution of 10,528 TCGA tumours across 32 human cancer types broken down by tissue of origin. TCGA disease codes and abbreviations: UCEC, uterine corpus endometrial carcinoma; SKCM, skin cutaneous melanoma; BLCA, bladder urothelial carcinoma; UCS, uterine carcinosarcoma; OV, ovarian serous cystadenocarcinoma; LUSC, lung squamous cell carcinoma; STAD, stomach adenocarcinoma; LUAD, lung adenocarcinoma; ESCA, oesophageal adenocarcinoma; DLBC, diffuse large b-cell lymphoma; CESC, cervical squamous cell carcinoma; HNSC, head and neck squamous cell carcinoma; SARC, sarcoma; LIHC, liver hepatocellular carcinoma; BRCA, breast invasive carcinoma; COADREAD, colorectal adenocarcinoma; CHOL, cholangiocarcinoma; ACC, adrenocortical carcinoma; PAAD, pancreatic adenocarcinoma; PRAD, prostate adenocarcinoma; GBM, glioblastoma multiforme; KIRP, kidney renal papillary cell carcinoma; KIRC, kidney renal clear cell carcinoma; MESO, mesothelioma; LGG, brain lower grade glioma; UVM, uveal melanoma; PCPG, pheochromocytoma and paraganglioma; TGCT, testicular germ cell tumours; KICH, kidney chromophobe; THYM, thymoma; LAML, acute myeloid leukaemia; THCA, thyroid carcinoma. b Genes involved in metabolism found to be most altered across all human cancers. c Clustered heatmap of cancer types using the percentage of tumours with first-tier metabolic pathway genes displaying alterations. Pathways are ordered by decreasing frequencies of alterations. Increasing colour intensities denote higher percentages. The heat map was produced using unsupervised hierarchical clustering with the Euclidean distance metric and complete linkage (see Supplementary Fig. 1). The coloured bars on the heatmap show the tissue of origin for each cancer: 1 = Breast; 2 = CNS, 3 = Endocrine; 4 = Eye; 5 = GI tract; 6 = Gynaecologic; 7 = Haematologic & Lymphatic; 8 = Head & Neck; 9 = Skin; 10 = Soft Tissue; 11 = Thoracic; 12 = Urologic. The bar graph represents the overall frequency of genomic alterations in each human cancer
Fig. 2
Fig. 2
Kaplan–Meier curve of the disease-free survival periods (a) and overall survival periods (b) of TCGA patients afflicted by the HM (high metabolic gene alteration frequencies) and LM (low metabolic gene alteration frequencies) cancer supertypes. c Kaplan–Meier curve of the overall survival periods of ICGC patients afflicted by the HM and LM cancer supertypes
Fig. 3
Fig. 3
Frequency of tumours of different cancer types with altered genes that are involved in second-tier metabolic pathways of carbohydrate, lipid and amino acid metabolism. The cancers are arranged according to how they clustered based on similarities between their first-tier metabolic pathway gene alterations (as in Fig. 1c). Increasing colour intensities denote higher percentages of tumours with gene alterations)
Fig. 4
Fig. 4
a Major catabolic and anabolic pathways of glucose and lipid metabolism in human cells. Nodes represent either enzymes (blue outline colour) or metabolic regulators (red outline colour). Node colours represent tumour suppressors (blue) and oncogenes (red) and their increasing colour intensities denote higher percentages of tumours with alterations in the genes encoding these enzymes or regulatory proteins. Edges indicate known types of interaction: red for inhibition and green arrows for activation. Abbreviations: GLUTs, all glucose transporters; HK, hexokinase; PFK, phosphofructokinase; PK, pyruvate kinase; LDH, lactate dehydrogenase; PDH, pyruvate dehydrogenase complex; PDK; pyruvate dehydrogenase kinase; CS, citrate synthase; ACO2, cis-aconitase; IDH, isocitrate dehydrogenase; OGDH, α-ketoglutarate; SDH, succinate dehydrogenase; SUCL, succinyl-CoA lyase; FH, fumarate hydratase; MDH, malate dehydrogenase; ACLY, ATP-dependent citrate lyase; ACC, acetyl-CoA carboxylase; FASN, fatty acid synthase; PTEN, phosphatase and tensin homologue; AMPK, 5’-AMP-activated protein kinase; mTORC1, mechanistic target of rapamycin complex-1; PI3K, phosphoinositide-3 kinase; SREBP, Sterol regulatory element-binding protein; Akt, RAC-alpha serine/threonine-protein kinase; Kras, Kirsten rat sarcoma viral oncogene homologue; Myc, MYC proto-oncogene; HIF1α, hypoxia-inducible factor 1-alpha; LKB1, Liver Kinase B1; p53, p53 tumour suppressor. b overall fraction of samples with the central metabolic pathways gene alterations across 32 human cancers
Fig. 5
Fig. 5
a Clustering of HM (orange points) and LM (blue points) tumours based on mRNA transcript levels. b Clustering of 32 different cancer types based on mRNA transcript levels. Points are coloured according to the type of cancer they represent. For both plots (a and b), t-SNE was used to visualise the tumour classes using the exact algorithm and standardised Euclidean distance metric. c Three-dimensional plot of the HM/LM tumour supertype grouping based on mRNA transcript levels. d The integrated plot of mRNA expression correlations ordered by whether cancers belong to the HM or LM supertypes. From top to bottom, panels indicate: the tissue of origin; whether tumours belong to the HM or LM supertype; heatmap of inter-tumour linear Pearson’s correlation scores with increasing colour intensities denoting higher degrees of correlation
Fig. 6
Fig. 6
a Clustering of HM tumours based on all 20,502 mRNA transcript levels that were measured by the TCGA project. The colour legend represents different cancer types. b Clustering of HM tumours based on all 20,502 mRNA transcript levels that were measured by the TCGA. Points are coloured according to the clustering of the tumour using DBSCAN. -1 indicates the outlier points. For both plots (a and b), t-SNE was used to visualise the tumour classes using the exact algorithm and standardised Euclidean distance metric. c Kaplan–Meier curve of the disease-free survival periods and the life table of patients afflicted with each DBSCAN disease subtype. d Kaplan–Meier curve of the overall survival periods and life table of patients afflicted with each DBSCAN disease subtype. For both survival curve plots (c and d), the colours represent the tumour groupings yielded by DBSCAN in panel B
Fig. 7
Fig. 7
Distribution of 1001 cancer cell lines derived from 32 human cancer types broken down by tissue of origin
Fig. 8
Fig. 8
a Heatmap of the fraction of altered GDSC cancer cell line genes that are involved in each first-tier metabolic pathway in relation to corresponding patient tumour data from TCGA. Pathways are ordered according to numbers of observed alterations within genes that are involved in the pathways. Increasing colour intensities denote higher percentages of tumours containing alterations in the genes involved in the represented pathways. Bar graphs above the heatmap indicate overall percentages of gene alterations within GDSC cell lines (blue bars) or TCGA tumours (tan bars) of a particular cancer type. Bar graphs on the right of the heatmap indicate the overall percentage of alterations within each first-tier metabolic pathway for the GDSC cell lines (blue bars) and TCGA tumours (tan bars). b Comparison of the dose-response profiles between the LM and HM supertypes of the GDSC cancer cell lines for selected drugs. Boxplots show  the logarithm transformed mean IC50 values of the cancer cell lines that correspond to the HM and LM cancer supertypes. On each box, the central red mark indicates the median, and the bottom edge represents the 25th percentiles, whereas the top edge of the box represents 75th percentiles. The whiskers extend to the most extreme data points not considered outliers, and the outliers are plotted individually using the ‘ + ‘ symbol
Fig. 9
Fig. 9
a Dose-response profiles for drugs that have a degree of efficacy that is influenced by alterations in genes involved in specific metabolic pathways. From left to right: the columns represent GDSC cancer cell lines of various cancer types. The sizes of squares represent the number of drugs with efficacies that differ significantly between cell lines with and without gene alterations in the pathways indicated along the rows. The marks are coloured based on the overall influence of the metabolic gene alterations on drug efficacy: with increasing blue intensities denoting increasing sensitivity and increasing orange intensity denoting increasing resistance. The heatmap represents the overall numbers of drugs whose efficacy is influenced by the altered metabolic genes that are involved in the represented pathways. The bar graphs represent the total numbers of drugs whose dose-responses are increased (blue) or decreased (orange) by alterations of genes that are involved in the respective pathways. b Kaplan–Meier curve of the disease-free survival periods of patients afflicted with oesophageal adenocarcinoma with or without alterations to genes involved in the abacavir metabolism pathway. c Kaplan–Meier curve of the disease-free survival periods of patients afflicted with uterine corpus endometrial carcinoma, with or without alterations to genes involved in the abacavir metabolism pathway

References

    1. DeBerardinis RJ, Lum JJ, Hatzivassiliou G, Thompson CB. The biology of cancer: metabolic reprogramming fuels cell growth and proliferation. Cell Metab. 2008;7:11–20. doi: 10.1016/j.cmet.2007.10.002. - DOI - PubMed
    1. Courtnay R, et al. Cancer metabolism and the Warburg effect: the role of HIF-1 and PI3K. Mol. Biol. Rep. 2015;42:841–851. doi: 10.1007/s11033-015-3858-x. - DOI - PubMed
    1. Pavlova NN, Thompson CB. The emerging hallmarks of cancer metabolism. Cell Metab. 2016;23:27–47. doi: 10.1016/j.cmet.2015.12.006. - DOI - PMC - PubMed
    1. Hanahan, D. & Weinberg, R. A. Hallmarks of cancer: the next generation. Cell144, 646–674 (2011). - PubMed
    1. Johnson C, Warmoes MO, Shen X, Locasale JW. Epigenetics and cancer metabolism. Cancer Lett. 2015;356:309–314. doi: 10.1016/j.canlet.2013.09.043. - DOI - PMC - PubMed

Publication types

Substances