. 2019 Nov 15:2:419.
doi: 10.1038/s42003-019-0670-5. eCollection 2019.

Rab5-mediated endosome formation is regulated at the trans-Golgi network

Affiliations

Rab5-mediated endosome formation is regulated at the trans-Golgi network

Makoto Nagano et al. Commun Biol. .

Abstract

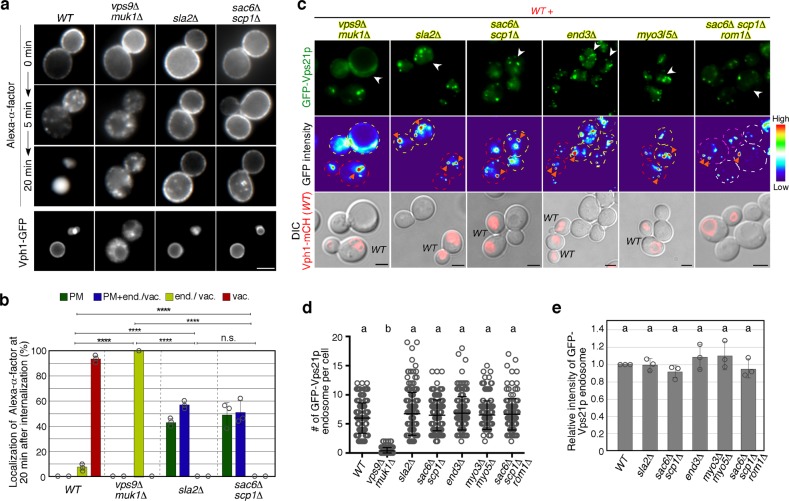
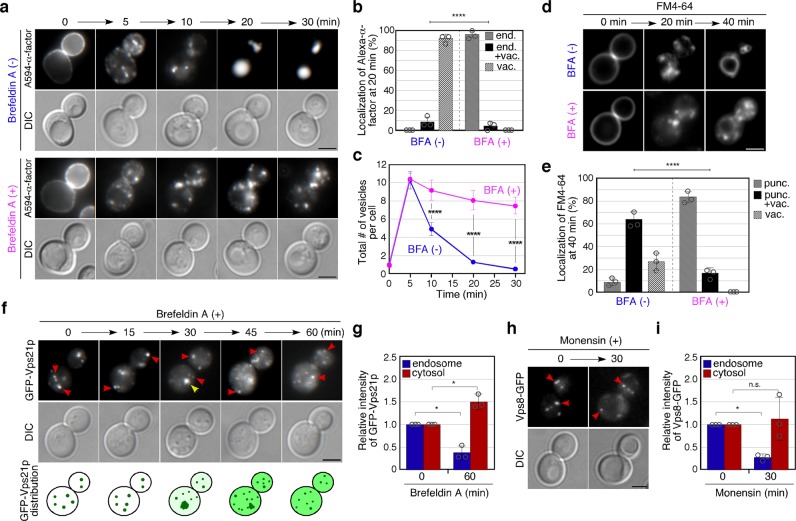
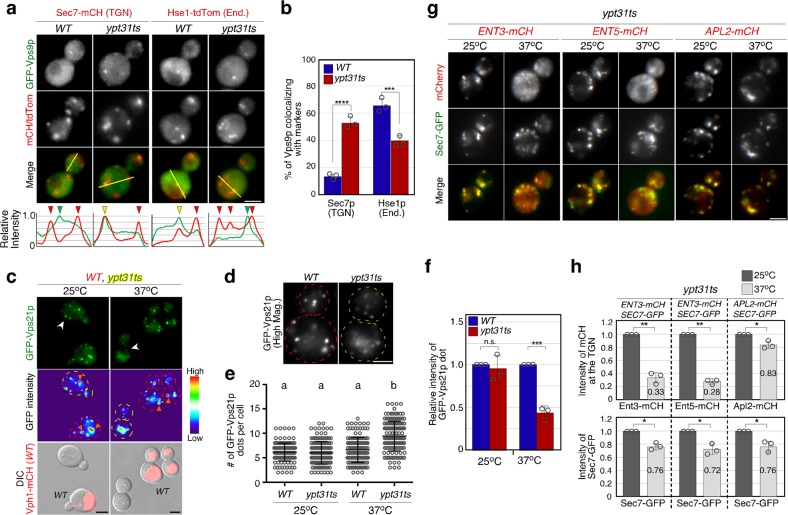
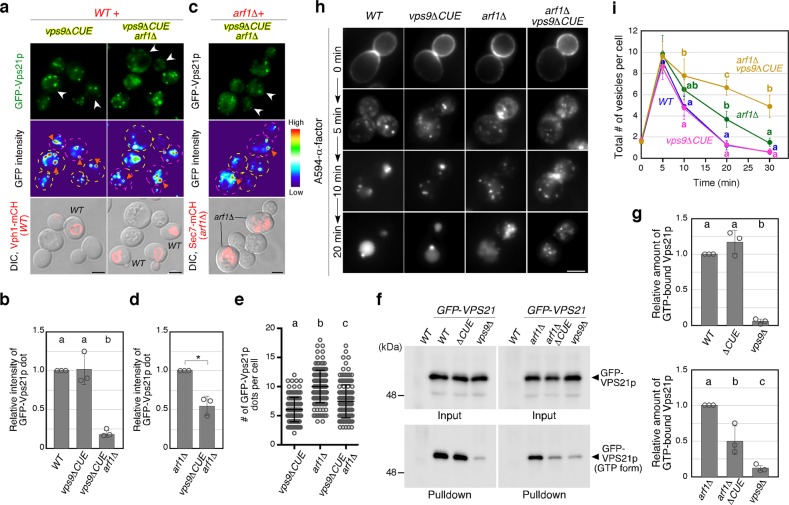
Early endosomes, also called sorting endosomes, are known to mature into late endosomes via the Rab5-mediated endolysosomal trafficking pathway. Thus, early endosome existence is thought to be maintained by the continual fusion of transport vesicles from the plasma membrane and the trans-Golgi network (TGN). Here we show instead that endocytosis is dispensable and post-Golgi vesicle transport is crucial for the formation of endosomes and the subsequent endolysosomal traffic regulated by yeast Rab5 Vps21p. Fittingly, all three proteins required for endosomal nucleotide exchange on Vps21p are first recruited to the TGN before transport to the endosome, namely the GEF Vps9p and the epsin-related adaptors Ent3/5p. The TGN recruitment of these components is distinctly controlled, with Vps9p appearing to require the Arf1p GTPase, and the Rab11s, Ypt31p/32p. These results provide a different view of endosome formation and identify the TGN as a critical location for regulating progress through the endolysosomal trafficking pathway.

Keywords: Endocytosis; Endosomes; Golgi.


Conflict of interest statement

Competing interestsThe authors declare no competing interests.

Figures

Fig. 1
Fig. 1
Defective endocytosis does not affect Vps21p-mediated endosome formation. a Effect of the deletion of Rab5-specific GEFs or endocytosis-related proteins on the internalization of Alexa Fluor594-labeled α-factor (Alexa-α-factor) or Vhp1-GFP transport to the vacuole. The images were acquired at 0, 5, and 20 min after washing out unbound Alexa-α-factor (Alexa-α-factor). b Quantification of the intracellular compartments accumulating Alexa-α-factor in the indicated cells at 20 min after internalization. The compartments were categorized into four classes; plasma membrane only (PM), PM and endosome and/or vacuole (PM + end./vac.), endosome and/or vacuole (end./vac.), and vacuole only (vac.). c Localization of GFP-Vps21p in wild-type (WT) and mutant cells. WT and mutant cells expressing GFP-Vps21p were grown to early-logarithmic to mid-logarithmic phase, mixed, and acquired in the same images. Fluorescence images or heat maps showing GFP levels are shown in the panels labeled GFP-Vps21p or GFP intensity, respectively. WT or mutant cells are indicated with red or yellow dashed lines, respectively. WT cells are labeled by the expression of Vph1-mCherry (red) which is shown in the lower images overlaid with DIC images. d, e Quantification of the (d) number or (e) fluorescence intensity of GFP-Vps21p-positive endosomes displayed in (c). Data show mean ± SEM from at three independent experiments, (b) with 50 cells or (e) 100 endosomes, or (d) mean ± SD with 150 cells. *p< 0.05, ***p< 0.001, ****p< 0.0001, n.s., not significant, chi-square test for trend (b). Different letters indicate significant difference at p < 0.0001, one-way ANOVA with Tukey’s post-hoc test (d, e). Scale bar in all panels, 2.5 μm
Fig. 2
Fig. 2
The effect of inhibiting post-Golgi traffic on Vps21p-mediated vesicle formation and trafficking. a The spatio-temporal localization of Alexa-α-factor in Brefeldin A-treated cells. Cells were labeled with Alexa-α-factor in the presence or absence of 100 μg m−1 L−1 Brefeldin A (BFA). The images were acquired at the indicated time after internalization of Alexa-α-factor. b Quantification of Alexa-α-factor localization in the cells at 20 min after internalization. Endosome only (end.), endosome and vacuole (end. + vac.) and vacuole only (vac.). c Quantification of the number of Alexa-α-factor-positive vesicles displayed in a. d Effect of BFA treatment on FM4-64 transport from the PM to the vacuole. After treatment of the cells with 100 μg m−1 L−1 BFA for 15 min, cells were labeled with 200 μM FM4-64 for 15 min on ice and observed at 0, 20, and 40 min after washing out unbound FM4-64 and incubating the cells at 25 °C. e Quantification of FM4-64 localization in the cells at 40 min after internalization. Puncta only (punc.), puncta and vacuole (punc. + vac.), and vacuole only (vac.). f The effect of BFA on the localization of Vps21p. Cells expressing GFP-Vps21p were incubated with 100 μg m−1 L−1 BFA at 25 °C and observed at the indicated time after the incubation. Red arrows indicate the example of GFP-Vps21p endosomes and yellow arrow shows aberrant accumulation of GFP-Vps21p. g The graph shows quantification of the fluorescence intensity of GFP-Vps21p at the endosomes and in the cytoplasm. h The effect of Monensin on the localization of Vps8p. Cells expressing Vps8-GFP were incubated with 50 μM Monensin at 25 °C and observed at the indicated time after the incubation. i The graph shows quantification of the fluorescence intensity of Vps8-GFP at the endosomes and in the cytoplasm. Data show mean ± SEM from three independent experiments, with 50 cells b, c, 100 cells e or 100 endosomes g, i. ****p< 0.0001, chi-square test for trend b, e, two-way ANOVA with Bonferroni’s post-hoc test c. *p< 0.05, unpaired t-test with Welch’s correction g, i. Scale bar in all panels, 2.5 μm
Fig. 3
Fig. 3
The effect of deleting Arf1p or adaptor proteins on the localization and activity of Vps21p. a, b The localization of GFP-Vps21p in wild-type (WT) and mutant cells. Fluorescence images were acquired as shown in Fig. 1c. High magnification images indicated by arrowhead in a were shown in b. c Quantification of the number of GFP-Vps21p-positive endosomes displayed in a and Supplementary Fig. 2a. d Fluorescence intensity of GFP-Vps21p-positive endosomes displayed in c. e Immunoblots showing active levels of Vps21p. Endogenous Vps21p was tagged with GFP in the indicated cells, and 3 μg of total cell lysate (2% input) were loaded and immunoblotted with an anti-GFP antibody (Input panel). Active Vps21p from 150 μg of total cell lysate was pulled down with GST-tagged N terminal portion of human EEA1 (GST-EEA1NT) and probed with an anti-GFP antibody (Pulldown panel). f Quantification of active Vps21p levels displayed in e. Graph shows mean ± SEM from three independent experiments. Data show mean ± SD with 150 cells c or mean ± SEM with 100 endosomes d from three independent experiments. Different letters indicate significant difference at p < 0.05, one-way ANOVA with Tukey’s post-hoc test c, d, f. Scale bar, 2.5 μm. Uncropped blots for e can be found in Supplementary Fig. 11
Fig. 4
Fig. 4
Arf1p and Ent3p/5p-dependent localization of Vps9p. a Immunoblots showing the expression levels of GFP-tagged Vps9p in the cells. GFP-Vps9p was expressed under the control of the authentic promoter from the endogenous locus. Total cell lysates were loaded and immunoblotted with an anti-GFP antibody (α-GFP panel). GAPDH was used as a loading control (α-GAPDH panel). Graph shows mean ± SEM from three independent experiments. b Localization of GFP-Vps9p in the cells. Fluorescence images (GFP-Vps9p), heat maps showing GFP levels (GFP intensity) and DIC images (DIC) are shown. c Quantification of the number of GFP-Vps9p puncta displayed in b. d, e Dynamic behavior of GFP-Vps9p puncta in the cells. Time series of the regions in the boxed area indicated in d. Blue and red arrowheads indicate appearing and disappearing points of GFP-Vps9p. f Graph shows the GFP-Vps9p lifetime in the cells. n= 100 puncta. Top and bottom bars are the 95% confidence limits. Data show the mean ± SEM of three independent experiments, with 100 cells. g Colocalization of GFP-Vps9p and Sec7p-mCherry (TGN) or Hse1p-tdTomato (Endosome; End) in the cells. Representative intensity profiles of GFP-Vps9p and Sec7-mCherry or Hse1-tdTomato along the yellow line in the merged images are indicated in the lower graphs. Yellow or red/green arrowheads indicate the presence or absence of colocalization, respectively. h The percentages of colocalization were calculated as the ratio of mCH/tdTom-tagged marker (n= 100) colocalizing with GFP-Vps9p-positive puncta. i Analysis of the interaction between Arf1p and Vps9p using the BioID assay. Vps9p and Arf1p were tagged with GFP and BirA*-S, respectively. Total cell lysate (1% input) or biotinylated proteins were loaded and immunoblotted with an anti-GFP (α-GFP panel) or anti-S-tag antibody (S-tag panel). Data show mean ± SD with 150 cells c or mean ± SEM with 100 puncta f, h from three independent experiments. Different letters indicate significant difference at p < 0.05, one-way ANOVA with Tukey’s post-hoc test a and c. ****p< 0.0001, unpaired t-test with Welch’s correction f. ***p< 0.001, ****p< 0.0001, two-way ANOVA with Tukey’s post-hoc test h. Scale bar in all panels, 2.5 μm. Uncropped blots for a and i can be found in Supplementary Fig. 11
Fig. 5
Fig. 5
Ypt31p/32p-dependent localization of Vps9p at endosomes. a Colocalization of GFP-Vps9p and Sec7p-mCherry (Sec7-mCH) or Hse1p-tdTomato (Hse1-tdTom) in wild-type or ypt31-temperature-sensitive (ypt31ts) mutant cells. Ypt31p function was diminished by incubating cells at 37 °C for 2 h. Representative intensity profiles of GFP-Vps9p and Sec7-mCherry or Hse1-tdTomato along the yellow line in the merged images are indicated in the lower graphs. Yellow or red/green arrowheads indicate the presence or absence of colocalization, respectively. b The percentages of colocalization were calculated as the ratio of mCH/tdTom-tagged marker (n= 100) colocalizing with GFP-Vps9p-positive puncta in each experiment. c Localization of GFP-Vps21p in the cells. Fluorescence images (GFP-Vps21p), heat maps showing GFP levels (GFP intensity) are shown. WT cells are labeled by the expression of Vph1-mCherry (red) which is shown in the images overlaid with DIC images. d High magnification images of the cells indicated with white arrows in c are shown. e, f Quantification of the number e or fluorescence intensity f of GFP-Vps21p dots displayed in c. g Localization of mCherry-tagged Ent3p (ENT3-mCH), Ent5p (ENT5-mCH), or Apl2p (APL2-mCH) in ypt31ts cells. Sec7-GFP was expressed as a control to evaluate the effect of Ypt31p dysfunction on Golgi/TGN function. h Quantification of the fluorescence intensity of mCherry-fused Ent3p, Ent5p, and Apl2p at the TGN (as labeled by Sec7-GFP) in ypt31ts cells. Intensity of Sec7-GFP was used as a control. Data show mean ± SEM with 100 puncta b, f, h or mean ± SD with 150 cells e from three independent experiments. ***p< 0.001, ****p< 0.0001, n.s., not significant, two-way ANOVA with Tukey’s post-hoc test b. Different letters indicate significant difference at p < 0.05, one-way ANOVA with Tukey’s post-hoc test e and f. **p< 0.01, n.s., not significant, unpaired t-test with Welch’s correction h. Scale bar in all panels, 2.5 μm
Fig. 6
Fig. 6
Role of Vps9’s CUE domain in Vps21p-mediated endosomal formation and trafficking. a, c Localization of GFP-Vps21p in vps9ΔCUE and wild-type (WT) a or arf1Δ cells c. Fluorescence images (GFP-Vps21p), heat maps showing GFP levels (GFP intensity) are shown. WT or arf1Δ cells are labeled by the expression of Vph1-mCherry a or Sec7-mCherry c, respectively, which is shown in the images overlaid with DIC images. b and d Quantification of the number of GFP-Vps21p dots displayed in a or c. e Quantification of the fluorescence intensity of GFP-Vps21p dots displayed in a and c. f Immunoblots showing active levels of Vps21p. Endogenous Vps21p was tagged with GFP in the indicated cells, and 3 μg of total cell lysate (2% input) were loaded and immunoblotted with an anti-GFP antibody (GFP-Vps21p panels). Active Vps21p from 150 μg of total cell lysate was pulled down with GST-EEA1NT and probed with an anti-GFP antibody (GFP-Vps21p (GTP form) panels). g Graph showing mean ± SEM of the relative amount of active GFP-Vsp21p bound to GST-EEA1NT from three independent experiments. h Spatio-temporal localization of Alexa-α-factor in the indicated genotypes. The images were acquired at 0, 5, 10, and 20 min after washing out unbound Alexa-α-factor and incubating the cells at 25 °C. i Quantification of the number of Alexa-α-factor-positive vesicles displayed in h. Data show mean ± SD with 150 cells e, or mean ± SEM with 100 puncta b, d from three independent experiments. *p< 0.05, unpaired t-test with Welch’s correction d. Different letters indicate significant difference at p < 0.05, one-way ANOVA with Tukey’s post-hoc test b, e, and g, two-way ANOVA with Bonferroni’s post-hoc test i. Scale bar in all panels, 2.5 μm. The uncropped blot for f can be found in Supplementary Fig. 11
Fig. 7
Fig. 7
Model for the role of post-Golgi vesicle transport in Vps21p-mediated endosomal formation and trafficking. Vps9p is first recruited to the TGN and then transported to the endosomal compartments where it activates Vps21p. During this process, Arf1p directly recruits Vps9p to the TGN, and Ypt31p/32p regulates transport of Vps9p to the endosome via transport vesicles on which Ent3/5p resides. CUE domain-dependent Vps9p recruitment to the TGN or endocytic vesicles additionally regulates Vps21p activity

References

    1. Grant BD, Donaldson JG. Pathways and mechanisms of endocytic recycling. Nat. Rev. Mol. Cell Biol. 2009;10:597–608. doi: 10.1038/nrm2755. - DOI - PMC - PubMed
    1. Luzio JP, Parkinson MD, Gray SR, Bright NA. The delivery of endocytosed cargo to lysosomes. Biochem. Soc. Trans. 2009;37:1019–1021. doi: 10.1042/BST0371019. - DOI - PubMed
    1. Huotari J, Helenius A. Endosome maturation. EMBO J. 2011;30:3481–3500. doi: 10.1038/emboj.2011.286. - DOI - PMC - PubMed
    1. Mellman I. Endocytosis and molecular sorting. Annu. Rev. Cell Dev. Biol. 1996;12:575–625. doi: 10.1146/annurev.cellbio.12.1.575. - DOI - PubMed
    1. Russell MR, Nickerson DP, Odorizzi G. Molecular mechanisms of late endosome morphology, identity and sorting. Curr. Opin. Cell Biol. 2006;18:422–428. doi: 10.1016/j.ceb.2006.06.002. - DOI - PubMed

Publication types