. 2020 Feb;63(2):351-361.
doi: 10.1007/s00125-019-05032-3. Epub 2019 Nov 21.

Clinical and genetic correlates of islet-autoimmune signatures in juvenile-onset type 1 diabetes

Affiliations

Clinical and genetic correlates of islet-autoimmune signatures in juvenile-onset type 1 diabetes

Laura A Claessens et al. Diabetologia. 2020 Feb.

Abstract

Aims/hypothesis: Heterogeneity in individuals with type 1 diabetes has become more generally appreciated, but has not yet been extensively and systematically characterised. Here, we aimed to characterise type 1 diabetes heterogeneity by creating immunological, genetic and clinical profiles for individuals with juvenile-onset type 1 diabetes in a cross-sectional study.

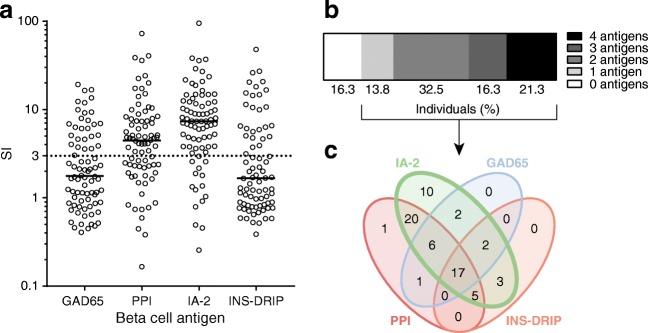
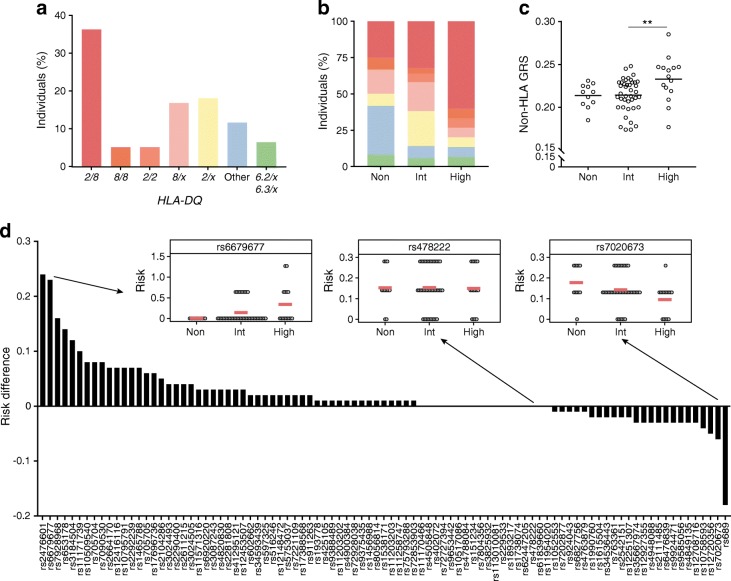
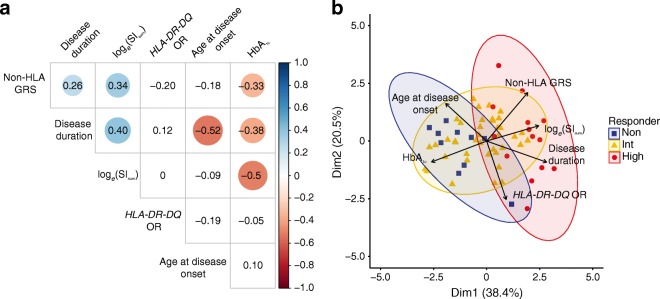
Methods: Participants were HLA-genotyped to determine HLA-DR-DQ risk, and SNP-genotyped to generate a non-HLA genetic risk score (GRS) based on 93 type 1 diabetes-associated SNP variants outside the MHC region. Islet autoimmunity was assessed as T cell proliferation upon stimulation with the beta cell antigens GAD65, islet antigen-2 (IA-2), preproinsulin (PPI) and defective ribosomal product of the insulin gene (INS-DRIP). Clinical parameters were collected retrospectively.

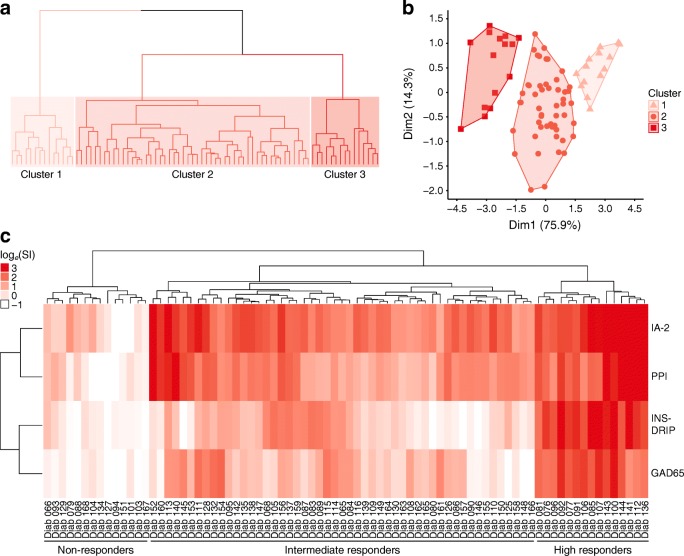
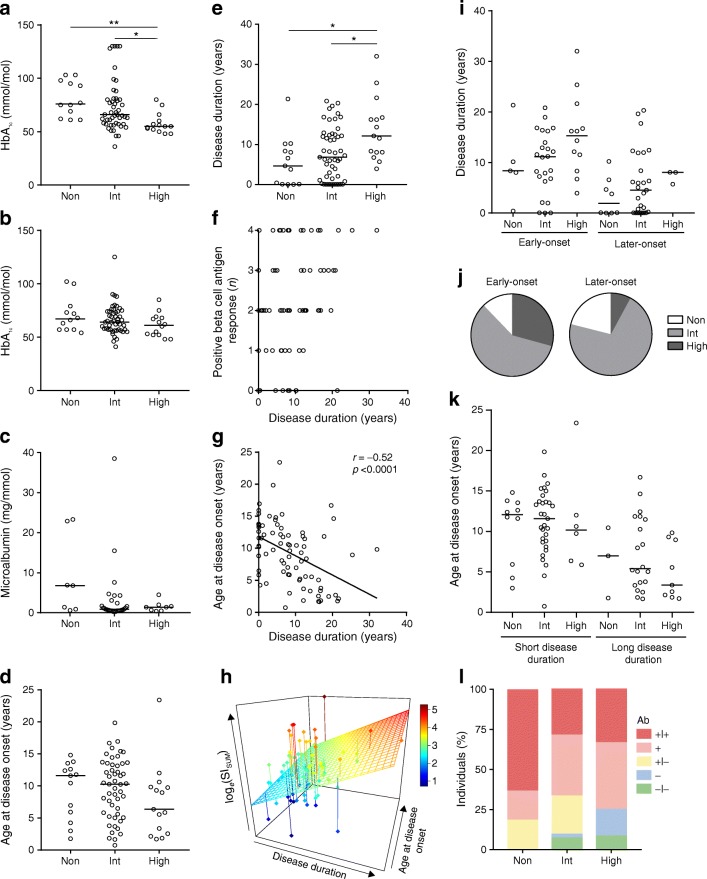
Results: Of 80 individuals, 67 had proliferation responses to one or more islet antigens, with vast differences in the extent of proliferation. Based on the multitude and amplitude of the proliferation responses, individuals were clustered into non-, intermediate and high responders. High responders could not be characterised entirely by enrichment for the highest risk HLA-DR3-DQ2/DR4-DQ8 genotype. However, high responders did have a significantly higher non-HLA GRS. Clinically, high T cell responses to beta cell antigens did not reflect in worsened glycaemic control, increased complications, development of associated autoimmunity or younger age at disease onset. The number of beta cell antigens that an individual responded to increased with disease duration, pointing to chronic islet autoimmunity and epitope spreading.

Conclusions/interpretation: Collectively, these data provide new insights into type 1 diabetes disease heterogeneity and highlight the importance of stratifying patients on the basis of their genetic and autoimmune signatures for immunotherapy and personalised disease management.

Keywords: Autoimmune disease; Autoreactive T cells; Disease endotypes; Disease heterogeneity; Epitope spreading; Immunotherapy; Islet autoantigen; Patient heterogeneity; Personalised medicine; Precision medicine.


Figures

Fig. 1
Fig. 1
Multitude and amplitude of beta cell-specific T cell proliferation. (a) SI values for proliferation of PBMC upon stimulation with the beta cell antigens GAD65, PPI, IA-2 and INS-DRIP in n = 80 individuals. Horizontal bars indicate group medians. SI ≥ 3 is considered positive and is indicated by the dotted line. The y-axis is on a log10 scale. (b) Percentage of individuals with a positive proliferation response against n = 0, n = 1, n = 2, n = 3 or n = 4 beta cell antigens. (c) Venn diagram of the number of individuals with positive proliferation responses against single beta cell antigens or all possible combinations of antigens. Red, PPI; green, IA-2; blue, GAD65; orange, INS-DRIP
Fig. 2
Fig. 2
Hierarchical clustering of individuals based on beta cell-specific T cell proliferation. Stimulation indices of beta cell-specific T cell proliferation were loge-transformed [loge(SI)] and clustered with Euclidian distance and complete linkage methods. Clustering was visualised in a dendrogram (a), PCA plot (b) and heat map (c). In (a), the height of the dendrogram is relative to the dissimilarity (the higher the dendrogram, the more dissimilar the data). The different clusters are highlighted by different shades of red. (b) PCA plot of principal component 1 (Dim1) and principal component 2 (Dim2). Colours for clusters 1, 2 and 3 in (b) correspond to those in (a). In (a) and (b): cluster 1, non-responders; cluster 2, intermediate responders; cluster 3, high responders. (c) Heat map with participant ID
Fig. 3
Fig. 3
HLA and non-HLA genetic profile of different types of immune responders. (a) Distribution of HLA-DR-DQ haplotypes in 77 individuals, from high- to low-risk: DR3-DQ2/DR4-DQ8 (2/8); DR4-DQ8/DR4-DQ8 (8/8); DR3-DQ2/DR3-DQ2 (2/2); DR4-DQ8/x (8/x); DR3-DQ2/x (2/x); DR15-DQ6.2/x (6.2/x); DR13-DQ6.3/x (6.3/x); or other. (b) Percentage of individuals per HLA-DR-DQ haplotype in the different responder groups. Significance was tested using χ2 test. Colours in (b) correspond with the haplotypes shown in (a). (c) Non-HLA GRS based on 93 type 1 diabetes-associated SNP variants for 67 individuals and plotted per responder group. Horizontal bars indicate group means. **p < 0.01, Tukey’s multiple comparison test. (d) SNP variants ranked from high to low based on the difference between mean genetic risk in high responders and mean genetic risk in non- and intermediate responders combined for each SNP variant. Inset graphs are representative examples of SNP variants, showing genetic risk among responder groups; horizontal red bars indicate group means. High, high responders; Int, intermediate responders; Non, non-responders
Fig. 4
Fig. 4
Clinical profile of different types of immune responders. (a) HbA1c at the date of blood sampling in 75 individuals. (b) Mean HbA1c of measurements taken up to 12 months before or after the date of blood sampling. (c) Microalbumin at date of blood sampling in 44 individuals. (d) Age at disease onset per responder group. (e) Disease duration at the date of blood sampling per responder group. (f) Disease duration plotted against the number of positive beta cell-specific T cell responses per individual. The number of beta cell antigens a single individual responded to increased with longer disease duration (p = 0.035). (g) Scatter plot of disease duration and age at disease onset. Spearman correlation was performed and the linear regression line was plotted. (h) 3D plot of loge(SISUM), disease duration and age at disease onset. The regression plane was plotted. The colour bar represents loge(SISUM) values. (i) Disease duration per responder group for individuals stratified into early-onset (<10 years; n = 41) and later-onset (≥10 years; n = 38) disease. (j) Pie-chart of proportion of responders in the early-onset (<10 years) and later-onset (≥10 years) groups. (k) Age at disease onset per responder group for individuals stratified into short disease duration (<10 years; n = 47) and long disease duration (≥10 years; n = 32). (l) Percentage of individuals (n = 68) that were double-positive for IA-2 and GAD autoantibodies (+|+), single-positive when only one was measured (+), single-positive when both are measured (+|−), single-negative when only one was measured (−) and double-negative (−|−). For (ae) and (i) and (k): horizontal bars indicate group medians; significance was tested using Dunn’s multiple comparison test. For (j) and (l), significance was tested using a χ2 test. *p < 0.05, **p < 0.01. Ab, antibodies; High, high responders; Int, intermediate responders; Non, non-responders
Fig. 5
Fig. 5
Multi-parameter analyses. (a) Spearman correlation of all variables (n = 80 individuals). Indicated values represent Spearman correlation coefficient (r). Values are encircled if correlation is significant (p < 0.05). The size and colour of circles represent strength of correlation and significance (larger circles indicate greater significance; blue indicates positive correlations, whilst red indicates negative correlations). (b) PCA plot of principal component 1 (Dim1) and principal component 2 (Dim2) using loge(SISUM), HLA-DR-DQ OR, non-HLA GRS, age at disease onset, disease duration and HbA1c at date of sampling (n = 64 individuals)

References

    1. Woittiez NJ, Roep BO. Impact of disease heterogeneity on treatment efficacy of immunotherapy in type 1 diabetes: different shades of gray. Immunotherapy. 2015;7(2):163–174. doi: 10.2217/imt.14.104. - DOI - PubMed
    1. Atkinson Mark A, Eisenbarth George S, Michels Aaron W. Type 1 diabetes. The Lancet. 2014;383(9911):69–82. doi: 10.1016/S0140-6736(13)60591-7. - DOI - PMC - PubMed
    1. Koeleman BP, Lie BA, Undlien DE, et al. Genotype effects and epistasis in type 1 diabetes and HLA-DQ trans dimer associations with disease. Genes Immun. 2004;5(5):381–388. doi: 10.1038/sj.gene.6364106. - DOI - PubMed
    1. Erlich H, Valdes AM, Noble J, et al. HLA DR-DQ haplotypes and genotypes and type 1 diabetes risk: analysis of the type 1 diabetes genetics consortium families. Diabetes. 2008;57(4):1084–1092. doi: 10.2337/db07-1331. - DOI - PMC - PubMed
    1. Noble JA, Valdes AM. Genetics of the HLA region in the prediction of type 1 diabetes. Curr Diab Rep. 2011;11(6):533–542. doi: 10.1007/s11892-011-0223-x. - DOI - PMC - PubMed

Publication types

MeSH terms