. 2019 Nov 21;9(1):97.
doi: 10.1186/s13550-019-0563-0.

Association of metabolic and genetic heterogeneity in head and neck squamous cell carcinoma with prognostic implications: integration of FDG PET and genomic analysis

Affiliations

Association of metabolic and genetic heterogeneity in head and neck squamous cell carcinoma with prognostic implications: integration of FDG PET and genomic analysis

Jinyeong Choi et al. EJNMMI Res. .

Abstract

Purpose: The linkage between the genetic and phenotypic heterogeneity of the tumor has not been thoroughly evaluated. Herein, we investigated how the genetic and metabolic heterogeneity features of the tumor are associated with each other in head and neck squamous cell carcinoma (HNSC). We further assessed the prognostic significance of those features.

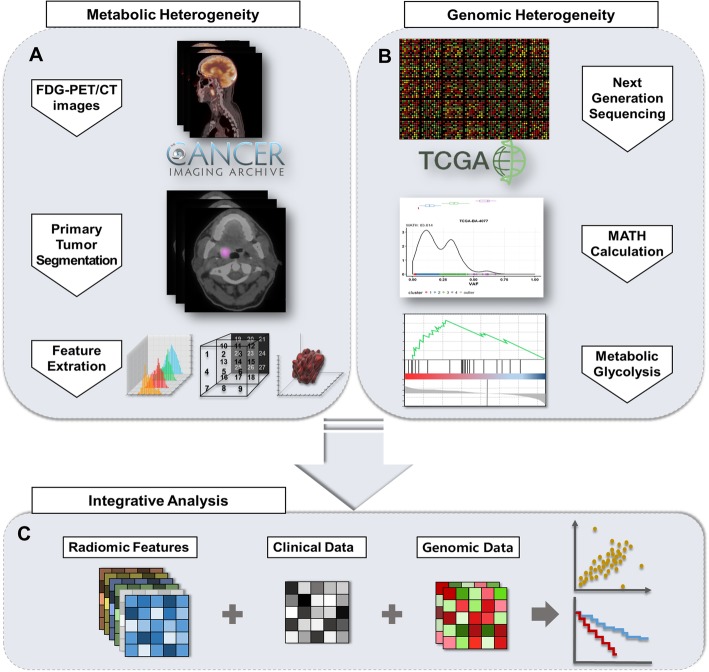
Methods: The mutant-allele tumor heterogeneity (MATH) score (n = 508), a genetic heterogeneity feature, and tumor glycolysis feature (GlycoS) (n = 503) were obtained from the HNSC dataset in the cancer genome atlas (TCGA). We identified matching patients (n = 33) who underwent 18F-fluorodeoxyglucose positron emission tomography (FDG PET) from the cancer imaging archive (TCIA) and obtained the following information from the primary tumor: metabolic, metabolic-volumetric, and metabolic heterogeneity features. The association between the genetic and metabolic features and their prognostic values were assessed.

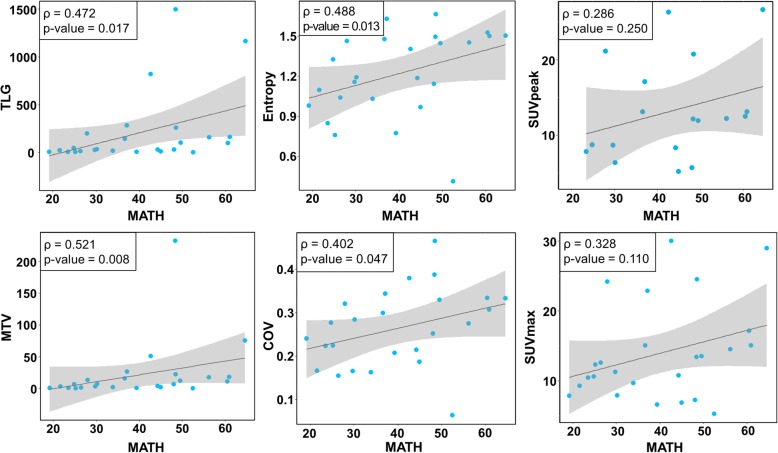
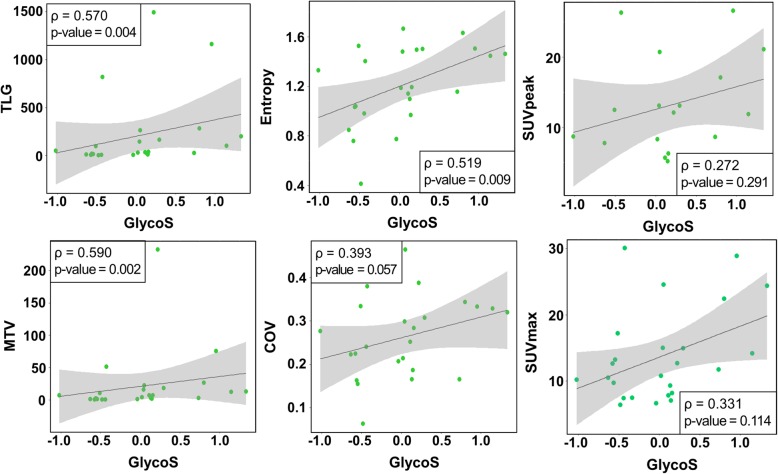
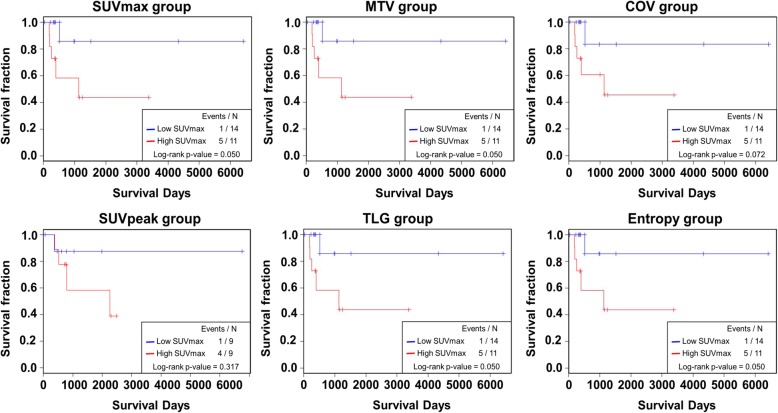
Results: Tumor metabolic heterogeneity and metabolic-volumetric features showed a mild degree of association with MATH (n = 25, ρ = 0.4~0.5, P < 0.05 for all features). The patients with higher FDG PET features and MATH died sooner. Combination of MATH and tumor metabolic heterogeneity features showed a better stratification of prognosis than MATH. Also, higher MATH and GlycoS were associated with significantly worse overall survival (n = 499, P = 0.002 and 0.0001 for MATH and GlycoS, respectively). Furthermore, both MATH and GlycoS independently predicted overall survival after adjusting for clinicopathologic features and the other (P = 0.015 and 0.006, respectively).

Conclusion: Both tumor metabolic heterogeneity and metabolic-volumetric features assessed by FDG PET showed a mild degree of association with genetic heterogeneity in HNSC. Both metabolic and genetic heterogeneity features were predictive of survival and there was an additive prognostic value when the metabolic and genetic heterogeneity features were combined. Also, MATH and GlycoS were independent prognostic factors in HNSC; they can be used for precise prognostication once validated.

Keywords: 18F-fluorodeoxyglucose; Heterogeneity; MATH; Positron emission tomography; Radiogenomics.


Conflict of interest statement

The authors declare that they have no competing interests.

Figures

Fig. 1
Fig. 1
Study scheme. A scheme for integrative study of radiogenomics. FDG PET data and genomic mutation data for TCGA-HNSC dataset were obtained from each database of TCIA and TCGA. a The primary tumor was manually assigned, and then ROIs were computed for feature extraction. b MATH calculation using MAF files were done in R. Also, metabolic glycolysis (GlycoS) value was obtained using gene set enrichment analysis. c Clinical data of TCGA-HNSC was gained from TCGA. Total six features were selected and used for radiogenomic analysis. We statistically analyzed radiomic, clinical and genomic data using correlation analysis, Kaplan-Meier analysis, log-rank test
Fig. 2
Fig. 2
Correlation between MATH and FDG PET features. Scatter plots for correlation analysis of MATH and FDG PET features. Each blue dots represent patients available for MATH and radiomic data (N = 25). Upper left box shows Spearman correlation coefficient (ρ) and P value. The dark gray line means a linear regression line and the gray region is 95% confidence region
Fig. 3
Fig. 3
Correlation between GlycoS and FDG PET features. Scatter plots for correlation analysis of GlycoS and FDG PET features. Each green dots represent patients available for MATH and radiomic data (N = 25). Upper left box shows Spearman correlation coefficient (ρ) and P value. The dark gray line means a linear regression line and the gray region is 95% confidence region
Fig. 4
Fig. 4
Representative cases. a A patient had a tongue cancer with high metabolic heterogeneity (high entropy and high COV groups). Genomic analysis of the patient revealed that the tumor had high genetic heterogeneity (high MATH group). b A patient had a left tonsillar cancer with low metabolic heterogeneity (low entropy and low COV group) based on FDG PET. Genomic analysis of the patient revealed that the tumor had low genetic heterogeneity (low MATH group). Of note, low and high entropy, COV, and MATH groups are divided according to the optimized cut-offs obtained by cut-off finder (http://molpath.charite.de/cutoff/index.jsp)
Fig. 5
Fig. 5
Prognostic value of FDG PET features. Kaplan-Meier curves of each group divided with adjusted cutoff value of FDG features. Survival analysis and log-rank test were performed to compare each group. Low and high FDG subsets for 25 patients. Red, high subset; blue, low subset. Of note, low and high MATH and GlycoS groups are divided according to the optimized cut-offs obtained by cut-off finder (http://molpath.charite.de/cutoff/index.jsp)
Fig. 6
Fig. 6
Predictive value of combined MATH and FDG PET features. Kaplan-Meier curves of each group divided with adjusted cutoff value of the features. a MATH showed a trend of prediction of OS (P = 0.086). b, c When MATH and FDG features were combined, the predictive value became more robust (B: MATH+COV, P = 0.024, C: MATH + Entropy, P = 0.012). Low group = patients in low group for both features; High group = patients in high group at least one feature. Of note, low and high groups are divided according to the optimized cut-offs obtained by cut-off finder (http://molpath.charite.de/cutoff/index.jsp)
Fig. 7
Fig. 7
Prognostic value of MATH and GlycoS. Kaplan-Meier curves of each group divided with adjusted cutoff value of genetic signatures. Survival analysis and log-rank test were performed to compare each group. a Low MATH and high MATH subsets for 499 patients. Red, high MATH (MATH > 37.17); blue, low MATH (MATH < 37.17). b Same analysis as (a) comparing low GlycoS and high GlycoS subsets. Red, high GlycoS (GlycoS > 0.80); blue, low GlycoS (GlycoS < 0.80). Of note, low and high MATH and GlycoS groups are divided according to the optimized cut-offs obtained by cut-off finder (http://molpath.charite.de/cutoff/index.jsp)

Similar articles

Cited by

References

    1. Dagogo-Jack I, Shaw AT. Tumour heterogeneity and resistance to cancer therapies. Nat Rev Clin Oncol. 2017;15:81–94. doi: 10.1038/nrclinonc.2017.166. - DOI - PubMed
    1. Jamal-Hanjani M, Quezada SA, Larkin J, Swanton C. Translational implications of tumor heterogeneity. Clin Cancer Res. 2015;21:1258–1266. doi: 10.1158/1078-0432.CCR-14-1429. - DOI - PMC - PubMed
    1. Marusyk A, Almendro V, Polyak K. Intra-tumour heterogeneity: a looking glass for cancer? Nat Rev Cancer. 2012;12:323–334. doi: 10.1038/nrc3261. - DOI - PubMed
    1. Kleppe M, Levine RL. Tumor heterogeneity confounds and illuminates: assessing the implications. Nat Med. 2014;20:342–344. doi: 10.1038/nm.3522. - DOI - PubMed
    1. McGranahan N, Swanton C. Clonal heterogeneity and tumor evolution: past, present, and the future. Cell. 2017;168:613–628. doi: 10.1016/j.cell.2017.01.018. - DOI - PubMed

LinkOut - more resources