Review
. 2020 Nov;52(5):1321-1339.
doi: 10.1002/jmri.26991. Epub 2019 Nov 21.

Rapid Knee MRI Acquisition and Analysis Techniques for Imaging Osteoarthritis

Affiliations
Review

Rapid Knee MRI Acquisition and Analysis Techniques for Imaging Osteoarthritis

Akshay S Chaudhari et al. J Magn Reson Imaging. 2020 Nov.

Abstract

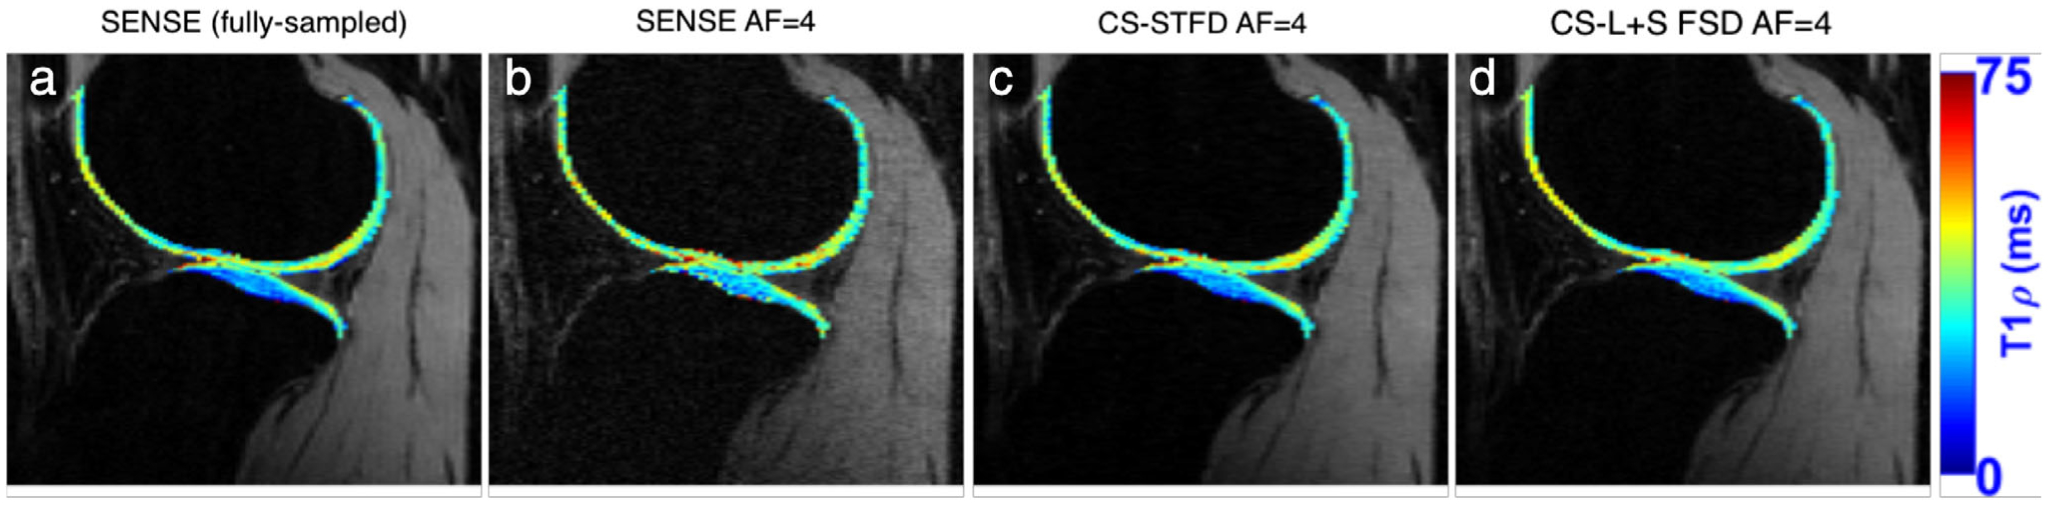
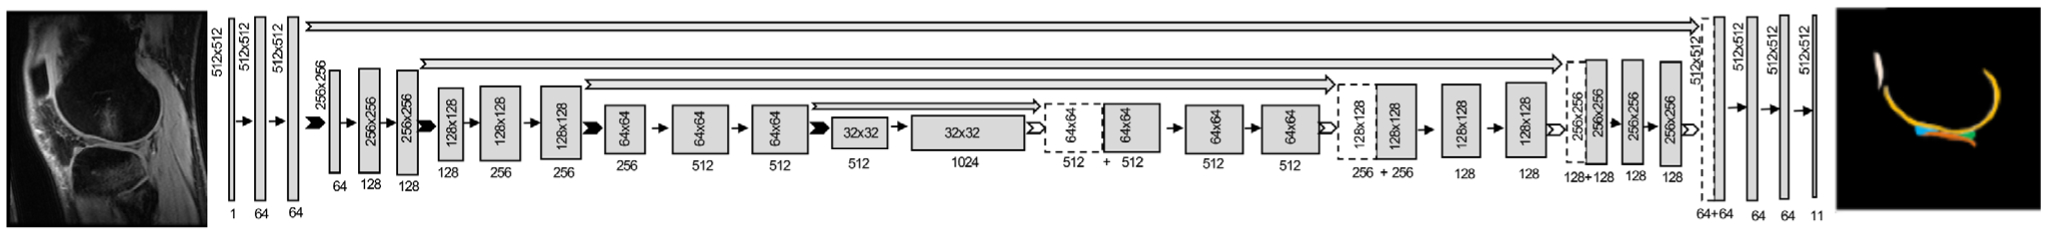
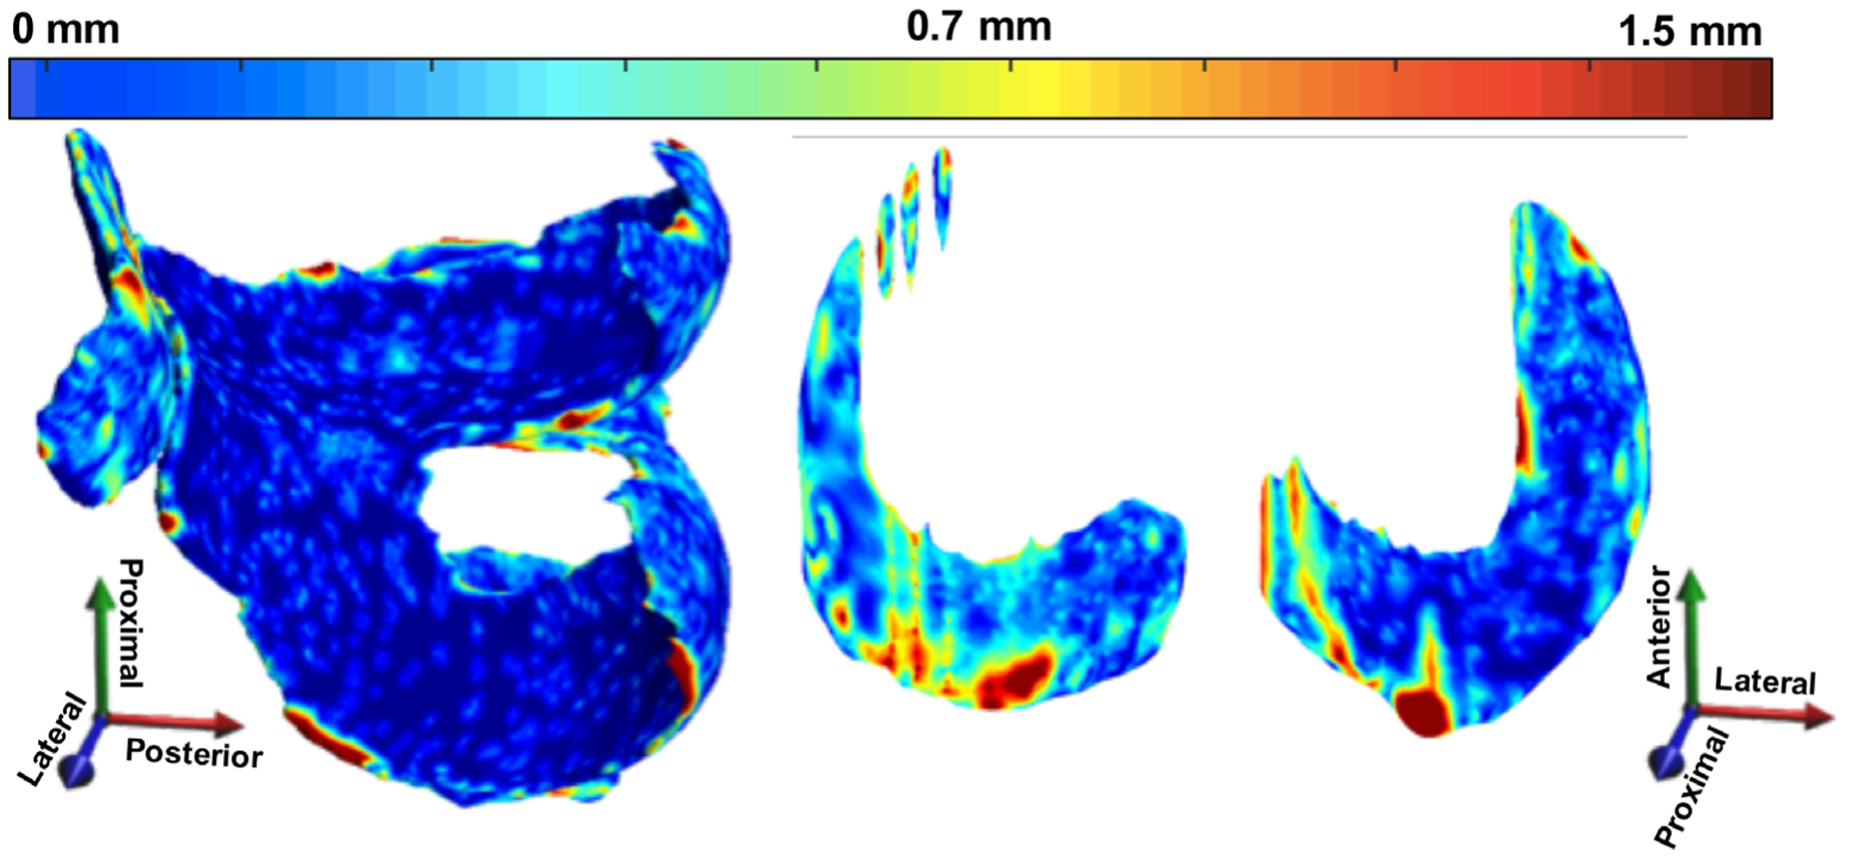
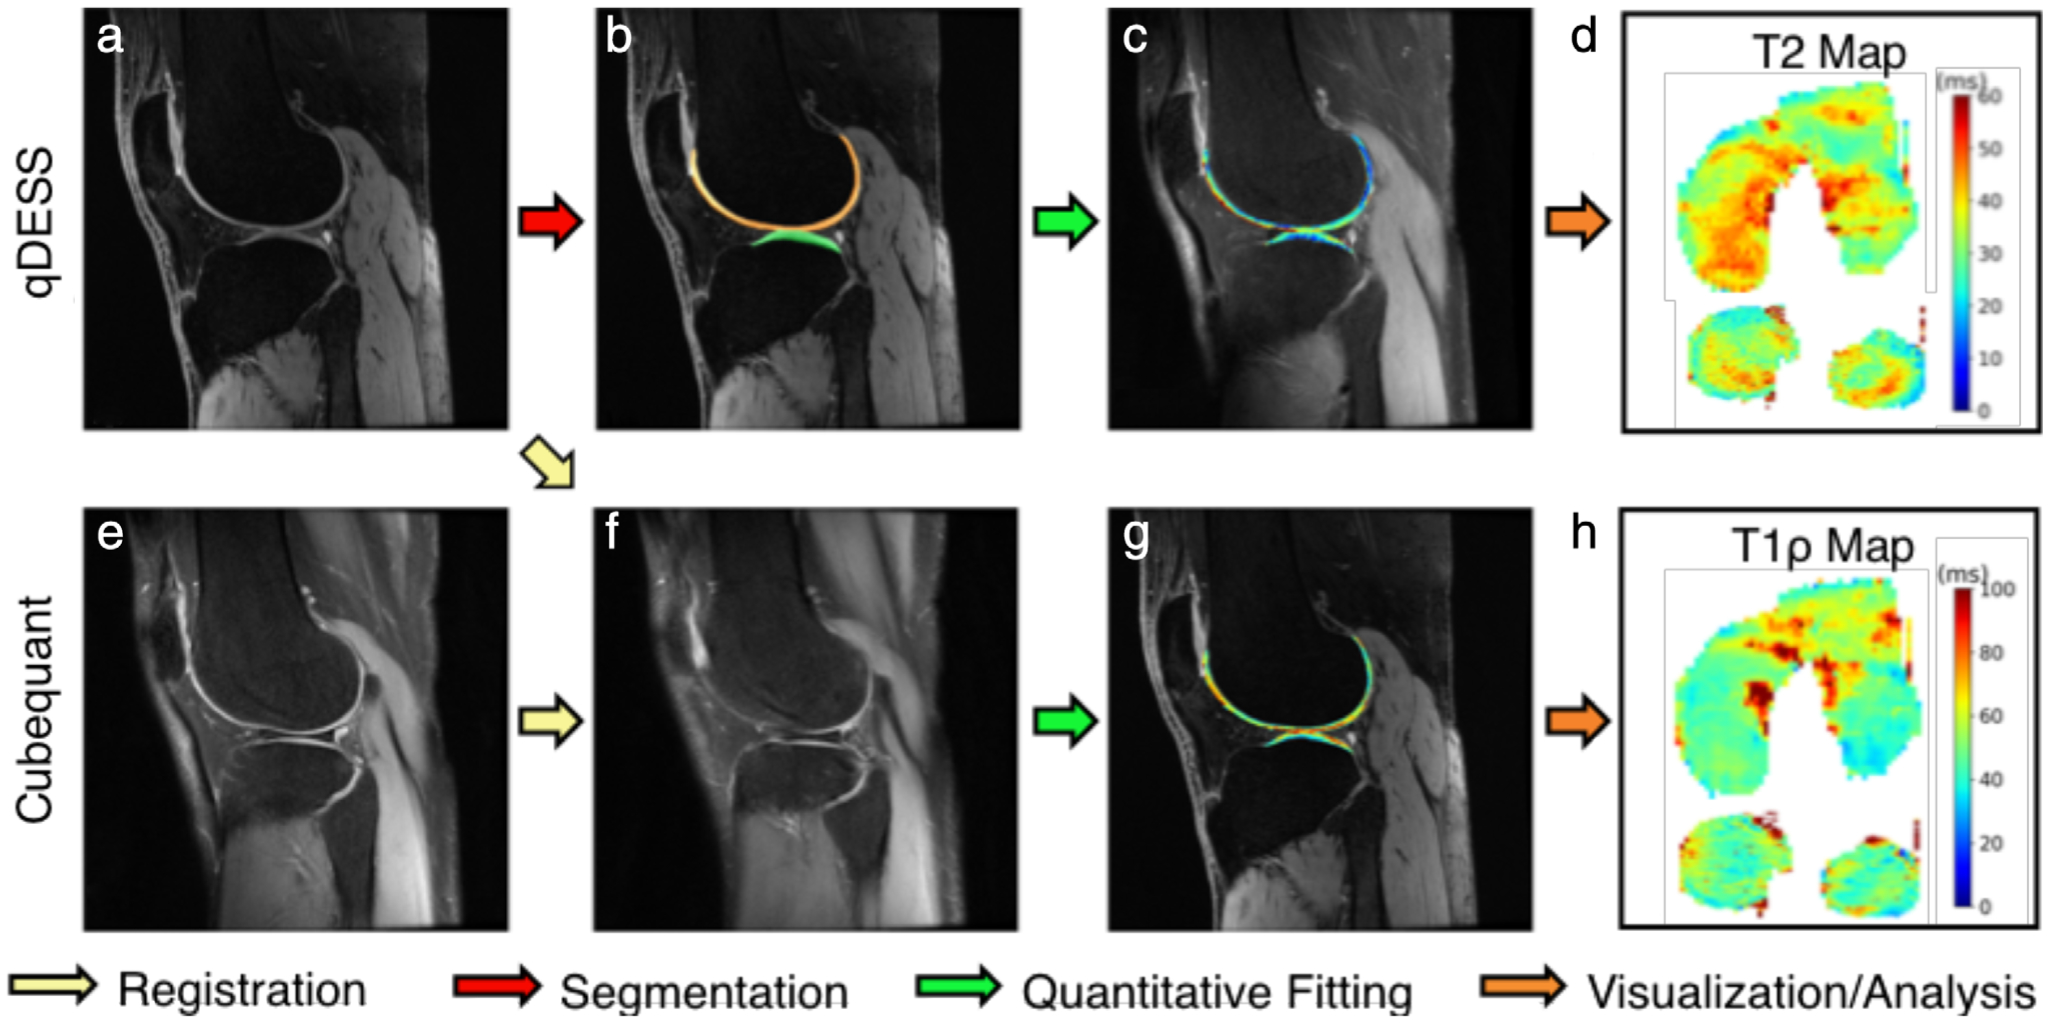
Osteoarthritis (OA) of the knee is a major source of disability that has no known treatment or cure. Morphological and compositional MRI is commonly used for assessing the bone and soft tissues in the knee to enhance the understanding of OA pathophysiology. However, it is challenging to extend these imaging methods and their subsequent analysis techniques to study large population cohorts due to slow and inefficient imaging acquisition and postprocessing tools. This can create a bottleneck in assessing early OA changes and evaluating the responses of novel therapeutics. The purpose of this review article is to highlight recent developments in tools for enhancing the efficiency of knee MRI methods useful to study OA. Advances in efficient MRI data acquisition and reconstruction tools for morphological and compositional imaging, efficient automated image analysis tools, and hardware improvements to further drive efficient imaging are discussed in this review. For each topic, we discuss the current challenges as well as potential future opportunities to alleviate these challenges. LEVEL OF EVIDENCE: 5 TECHNICAL EFFICACY STAGE: 3.

Keywords: compositional imaging; deep learning; morphological imaging; quantitative MRI; rapid MRI; segmentation.


Figures

FIGURE 1:
FIGURE 1:
An example tear of the medial meniscus is seen with associated cartilage thinning and subchondral marrow changes imaged with a proton-density weighted coronal sequence (a,b). Similarly, an example anterior cruciate ligament (ACL) tear imaged with a sagittal proton-density-weighted sequence is also shown (c,d). Images were acquired on a 3T system (Skyra, Siemens) using a 15-channel knee coil. Two variational networks models were trained, one for coronal and one for sagittal acquisitions, each with 10 fully sampled cases. For testing, prospective accelerations were performed with parallel imaging (GRAPPA, R = 2) and the VN (R = 3). Images courtesy Dr. Florian Knoll, New York University, New York, NY.
FIGURE 2:
FIGURE 2:
Representative examples of knee images (coronal proton-density weighted fast spin echo sequence, PD-FSE scanned on a GE 3T Premier) obtained using the different reconstruction methods at acceleration rate R = 3. Compared to the traditional method with a combination of compressed sensing and parallel imaging (CS-PI), the sampling-augmented neural network with incoherent structure (SANTIS) for MR image reconstruction provided improved removal of aliasing artifacts in the bone and cartilage and greater preservation of sharp tissue details. SANTIS reconstruction required 0.06 s/slice, compared to 2.2 s/slice for CS-PI. SSIM: structural similarity index; nRMSE: normalized root mean squared error. Images courtesy Dr. Fang Liu, University of Wisconsin, Madison, WI.
FIGURE 3:
FIGURE 3:
A 16-year-old female teenager with a history of leukemia and long-term glucocorticoid treatment. Isotropic sagittal intermediate-weighted (a) and fat-suppressed T2-weighted (d) CAIPIRINHA (controlled aliasing in parallel imaging results in higher acceleration) SPACE TSE MR images with coronal and axial intermediate-weighted (c,d) and fat-suppressed T2-weighted (e,f) reformation MR images show an osteonecrosis of the medial femoral condyle with separation of a large osteochondral fragment as indicated by intersecting joint fluid (white arrows). In addition, there is a medullary bone infarct (b,e; gray arrows) in the proximal tibial metaphysis. The intermediate-weighted 3D CAIPIRINHA SPACE TSE dataset was acquired with a 0.5 × 0.5 × 0.5 mm3 spatial resolution and a total acquisition time of 4 minute and 41 seconds. The fat-suppressed T2-weighted 3D CAIPIRINHA SPACE TSE dataset was acquired with a 0.6 × 0.6 × 0.6 mm3 spatial resolution and a total acquisition time of 4 minutes and 45 seconds. No interpolations techniques were used. Images courtesy Dr. Jan Fritz, Johns Hopkins University, Baltimore, MD.
FIGURE 4:
FIGURE 4:
(a) An overview of the T2-Shuffling technique. A 3D FSE acquisition is modified to randomly shuffle the phase encode ordering of each echo train. Using prior knowledge of the signal relaxation curves for specific anatomy, a subspace-constraint incorporating compressed sensing was applied, leading to a 4D reconstruction along the signal relaxation curve. (b) T2-Shuffling images from a targeted pediatric knee MRI exam reformatted into (left) sagittal PD, (middle) coronal intermediate, and (right) axial T2 weighting. Clinical suspicion of lateral meniscal tear was confirmed with MRI (yellow arrows). Additional related findings were medial discoid meniscus (red arrow) and bone marrow edema (white arrow). Images courtesy Dr. Jon Tamir, University of California Berkeley, Berkeley, CA.
FIGURE 5:
FIGURE 5:
Representative images from a quantitative double-echo steady-state (qDESS) sequence that can generate two novel contrasts. The first echo (S+) generates a T2/T1-weighted contrast (a) while the second echo (S–) has a higher T2 weighting (b). By performing a weighted subtraction of the two echoes, fluid nulling can be performed to enhance visualization of soft tissues (c). Analytical modeling of the two echoes can also be used to accurately characterize the T2 relaxation times of the cartilage and meniscus (d).
FIGURE 6:
FIGURE 6:
Example multiplanar images from 3D radial ultra-short echo time qDESS (UTEDESS) sequence that can generate high-isotropic resolution images with high SNR from short-T2 tissues such as the tendons (solid arrow), ligaments (dotted arrow), and the meniscus (dashed arrow).
FIGURE 7:
FIGURE 7:
Example super-resolution images used for enhancing the slice resolution (left-right) of sagittal DESS sequences 3-fold. Comparisons between the tricubic interpolated images (a,d) show considerable blurring of the osteophytes and cartilage, as depicted by the arrows. Comparatively, the super-resolution images (b,e) show higher image sharpness and are more comparable to the original resolution images (c,f).
FIGURE 8:
FIGURE 8:
Representative T2 maps estimated from different reconstruction methods at R = 5 using an eight-echo spin-echo T2 mapping sequence (GE 3T Signa Excite Hdx), respectively, for a symptomatic patient. The global low rank (GLR) reconstruction generated images with noticeable artifacts in bone and fatty tissues (white arrows). Although the local low rank (LLR) reconstruction improved overall image quality with reduced image artifacts, it led to noticeable smoothing due to the exploitation of local sparsity at high acceleration. In contrast, model-augmented neural network with incoherent k-space sampling (MANTIS) generated nearly artifact-free T2 maps with well-preserved sharpness and texture comparable to the reference T2 maps. This qualitative observation was also confirmed using the residual error maps (displayed with the same scale) and nRMSE values. Images courtesy Dr. Fang Liu, University of Wisconsin, Madison, WI.
FIGURE 9:
FIGURE 9:
(a) A fully-sampled T1ρ map, with images reconstructed with SENSE (b) 4-fold accelerated T1ρ, with images reconstructed with SENSE (c) 4-fold accelerated T1ρ, with images reconstructed with CS and spatiotemporal finite difference (STFD) (d) 4-fold accelerated T1ρ, with images reconstructed with CS and low-rank plus sparse with spatial finite difference (L + S SFD). Images courtesy Dr. Marcelo Zibetti and Dr. Ravinder Regatte, New York University, New York NY.
FIGURE 10:
FIGURE 10:
The architecture for the 2D U-Net encoder-decoder convolutional neural network. An input image with pixel dimensions of 512 × 512 is successively downsampled (dimensions in gray box) using 2 × 2 max pooling layers, but with an increasing number of feature maps (dimensions under gray box) in the decoder. In the decoder, the image is similarly upsampled using transposed convolutions to produce a segmentation mask with the same dimensions as the input image, with labels for multiple tissues in the knee.
FIGURE 11:
FIGURE 11:
Example 3D point-by-point distance error maps (in mm) between manual and automatic segmentation for cartilage and meniscus using a DESS scan from the OAI that has a resolution of 0.34 × 0.45 × 0.7 mm3. The errors in the weight-bearing regions are minimal, with a majority of the errors lying mostly on the edge slices, which are on the order of the image resolution.
FIGURE 12:
FIGURE 12:
A sample analysis workflow using the fully-automated deep open source musculoskeletal analysis (DOSMA) framework. DOSMA automates tissue segmentation (red arrow), interscan registration (yellow arrow), quantitative fitting (green arrow), and visualization and region subdivision (orange arrow). In this example, qDESS scans (a) are used to automatically segment femoral and tibial cartilage (b) and analytically solve for T2 maps in each region (c,d). Corresponding CubeQuant scans for T1ρ relaxation time generation (e) are registered to the high-resolution qDESS scans (f) and used to fit T1ρ maps (g). Quantitative maps with 3D quantitative information are projected into 2D planes to visualize the femoral and tibial cartilage surfaces (d,h). Image courtesy Arjun Desai, Stanford University, Stanford, CA.
FIGURE 13:
FIGURE 13:
A simultaneous bilateral knee MRI setup (a) with two 16-channel flexible phased-array coils (b) that can be tightly wrapped around each knee. This allows for high-resolution imaging (c) and T2 relaxation time mapping (d) of both knees with similar scan times and SNR to single knee acquisitions, and has been shown to maintain quantitative accuracy.

References

    1. Solomon DH, Katz JN, Carrino JA, et al. Trends in knee magnetic resonance imaging. Med Care 2003;41:687–692. - PubMed
    1. Zhang Y, Jordan JM. Epidemiology of osteoarthritis. Clin Geriatr Med 2010;26:355–369. - PMC - PubMed
    1. Cross M, Smith E, Hoy D, et al. The global burden of hip and knee osteoarthritis: Estimates from the Global Burden of Disease 2010 study. Ann Rheum Dis 2014;73:1323–1330. - PubMed
    1. Kellgren JH, Lawrence JS. Osteo-arthrosis and disk degeneration in an urban population. Ann Rheum Dis 1958;17:388–397. - PMC - PubMed
    1. Guermazi A, Roemer FW, Burstein D, Hayashi D. Why radiography should no longer be considered a surrogate outcome measure for longitudinal assessment of cartilage in knee osteoarthritis. Arthritis Res Ther 2011;13:247. - PMC - PubMed

Publication types